Optimizing Collision Energy for MRM Pairs in Contaminant Analysis: Strategies for Sensitivity and Specificity
This article provides a comprehensive guide for researchers and scientists on optimizing collision energy (CE) for Multiple Reaction Monitoring (MRM) methods in the analysis of contaminants.
Optimizing Collision Energy for MRM Pairs in Contaminant Analysis: Strategies for Sensitivity and Specificity
Abstract
This article provides a comprehensive guide for researchers and scientists on optimizing collision energy (CE) for Multiple Reaction Monitoring (MRM) methods in the analysis of contaminants. It covers the foundational role of CE in MRM sensitivity and specificity, explores both traditional and advanced empirical optimization strategies, addresses common troubleshooting scenarios, and compares MRM with emerging high-resolution techniques like Parallel Reaction Monitoring (PRM). Aimed at professionals in drug development and environmental analysis, this resource offers practical methodologies to enhance quantitative accuracy and analytical robustness in complex matrices.
The Critical Role of Collision Energy in MRM Sensitivity and Specificity
Multiple Reaction Monitoring (MRM), also referred to as Selected Reaction Monitoring (SRM), is a highly specific and sensitive mass spectrometry technique used for the targeted quantification of molecules. In contaminant analysis research, its power lies in its ability to monitor specific precursor-product ion transitions, providing a robust method for identifying and quantifying trace-level analytes amidst complex sample matrices. This technique is particularly valuable in drug development and environmental testing, where accurate measurement of contaminants is critical. This guide covers the fundamental principles of these transitions and provides practical troubleshooting advice for optimizing your MRM methods [1] [2] [3].
Core Concepts: FAQs on Precursor and Product Ions
1. What is a precursor-product ion transition in MRM?
An MRM transition is the core measurement event in a tandem mass spectrometry (MS/MS) experiment. It involves a two-stage selection process [1]:
- Precursor Ion Selection: In the first mass analyzer (MS1), the ionized, intact molecule of interest (the "precursor ion") is selected based on its mass-to-charge ratio (m/z). Common precursor ions are the protonated or deprotonated molecules, such as [M+H]+ or [M-H]- [2].
- Fragmentation and Product Ion Selection: The selected precursor ion is then directed into a collision cell, where it collides with an inert gas (e.g., N2, Ar) in a process known as Collision-Induced Dissociation (CID). This causes the precursor to break into smaller fragments. These fragment ions are then analyzed in a second mass analyzer (MS2), where a specific, characteristic fragment (the "product ion" or "daughter ion") is selected for detection [1] [2]. The specific pair of m/z values—precursor ion m/z and product ion m/z—constitutes a "transition." Monitoring this specific pair of ions provides a highly selective fingerprint for the target compound [3].
2. Why is it necessary to monitor at least two MRM transitions per compound?
Using a minimum of two transitions per compound is a standard practice for achieving reliable quantification and confirmatory identity [2].
- Primary Transition: The transition with the highest signal intensity (abundance) is typically used for quantification.
- Confirmatory Transition: One or more additional transitions are monitored to confirm the compound's identity. The ratio of the signal intensities of these transitions (confirmatory/primary) should match the ratio observed for a pure standard analyzed under the same conditions. A deviation beyond a pre-defined threshold indicates potential interference, leading to a false positive [2]. This multi-transition approach drastically improves the specificity and reliability of the analysis in complex samples like those encountered in contaminant research.
3. What are the common scan modes in MS/MS, and how do they relate to MRM development?
Tandem mass spectrometers can operate in several modes, which are useful during method development [1]:
- Product Ion Scan: MS1 is fixed on a specific precursor m/z, and MS2 scans a range of m/z to capture all product ions. This mode is essential for identifying characteristic fragments and selecting the best product ions for your MRM transitions [1] [2].
- Precursor Ion Scan: MS1 scans a range of m/z, while MS2 is fixed on a specific product ion m/z. This helps identify all precursors that generate a common fragment.
- Neutral Loss Scan: Both MS1 and MS2 scan, but with a constant m/z offset, identifying precursors that lose a common neutral molecule (e.g., a phosphate group).
- Selected Reaction Monitoring (SRM): Both MS1 and MS2 are fixed at specific m/z values to monitor a single transition. The term MRM is now commonly used when multiple such transitions are monitored simultaneously [1].
Troubleshooting Guide: Common MRM Transition Issues
1. My MRM signal is low or absent. What should I check?
A weak signal can stem from several points in the workflow:
- Ionization Efficiency: Verify that the precursor ion form is optimal. If the response for [M+H]+ or [M-H]- is low, the compound may be forming an adduct with mobile phase additives (e.g., [M+NH4]+ or [M+Na]+). You may need to re-optimize the ionization conditions or mobile phase composition [2].
- Compound-Dependent Parameters: The orifice voltage (or declustering potential) and collision energy (CE) are critical. The orifice voltage controls the energy with which ions enter the first mass analyzer and must be optimized for maximum precursor ion response. The CE must be optimized to efficiently fragment the precursor ion into your chosen product ion [2].
- Sample and Chromatography: Ensure the sample is properly prepared and the LC method is effectively separating the compound from matrix interferences that can suppress ionization [2].
2. The ratio between my confirmatory and primary MRM transitions does not match the standard. What does this mean?
This is a clear indicator of interference.
- Root Cause: Another compound in the sample matrix is co-eluting with your target analyte and contributing to the signal in one or more of your MRM channels. Since the interfering compound is unlikely to share the same fragmentation pattern, the transition ratio will be skewed [2].
- Solution: Improve the chromatographic separation by optimizing the LC method (e.g., adjusting the mobile phase gradient, changing the column, or modifying the column temperature). If the ratio cannot be corrected, you may need to select an alternative, more specific product ion for the confirmatory transition [2].
3. The chromatographic peak is broad or distorted, affecting my quantitative accuracy.
Peak shape issues are typically related to the liquid chromatography (LC) portion of the LC-MS/MS system.
- Flow Rate: A flow rate that is too high can cause peaks to merge, while one that is too low can lead to broadening [2].
- Mobile Phase and Column: The selected mobile phase might not be ideal for the compound or column chemistry. Consider trying different solvents (e.g., methanol vs. acetonitrile) or additives. Also, ensure the column (e.g., C18 for non-polar compounds) is appropriate and in good condition [2].
- Column Temperature: A uniform and controlled column temperature can prevent peak broadening caused by temperature fluctuations within the column [2].
Workflow and Optimization
The following diagram illustrates the logical sequence for developing and troubleshooting a robust MRM method.
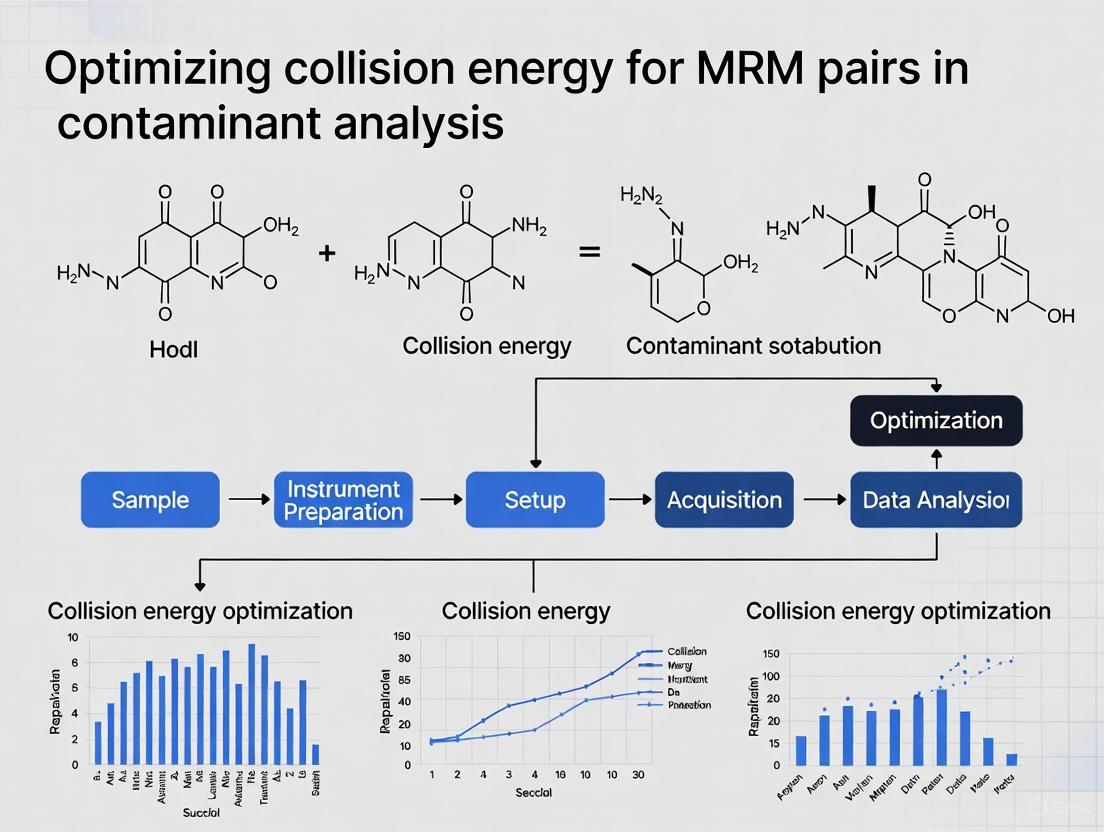
Optimizing Collision Energy for MRM Pairs
The collision energy (CE) is a critical parameter that determines how forcefully the precursor ion is fragmented. The optimal CE is unique to each transition and must be determined empirically. The table below summarizes the effects of different collision energy levels, using the example of Oseltamivir [1].
Table 1: Effect of Collision Energy on Precursor and Product Ions
| Collision Energy Setting | Precursor Ion Abundance | Product Ion Abundance | Degree of Fragmentation | Recommended Use |
|---|---|---|---|---|
| Low (e.g., 0 V) | High | None / Very Low | Minimal / None | Not suitable for MRM; precursor ion analysis. |
| Medium (Optimized) | Medium | High (for specific ions) | Controlled; generates dominant product ions | Ideal for MRM. Provides a strong, specific signal for quantification. |
| High (e.g., >50 V) | Low / Absent | High (for low m/z ions) | Extensive; generates many small fragments | Not ideal for MRM; can yield non-specific fragments. |
Experimental Protocol for CE Optimization:
- Establish Precursor and Product Ions: First, use a product ion scan to identify candidate product ions for your target compound [2].
- Create a CE Ramp Method: Program your mass spectrometer to infuse the standard solution and monitor your desired precursor-product ion pair while automatically ramping the collision energy over a defined range (e.g., from 5 V to 50 V).
- Identify the Optimal CE: The instrument software will typically generate a plot of product ion signal intensity versus collision energy. The CE value that produces the maximum intensity for your chosen product ion is the optimal value to use in your final method [2].
- Repeat for All Transitions: This process must be repeated for every MRM transition in your panel, as the optimal CE can differ significantly even between transitions for the same compound.
The Scientist's Toolkit: Essential Research Reagents and Materials
Table 2: Key Reagents and Materials for MRM-Based Contaminant Analysis
| Item | Function in MRM Experiment |
|---|---|
| Pure Chemical Standard | Serves as a reference for optimizing MS parameters (precursor m/z, fragment ions, CE) and for creating calibration curves for quantification [2]. |
| Stable Isotope-Labeled Internal Standards | Compounds identical to the analyte but labeled with (e.g., ^13C, ^15N). They are added to samples to correct for matrix effects, recovery losses, and instrument variability, significantly improving quantitative accuracy [4]. |
| High-Purity Solvents | Methanol, acetonitrile, and water are used for mobile phase preparation and sample dilution. Purity is critical to minimize background noise and contamination [2]. |
| Mobile Phase Additives | Acids (e.g., formic acid) or buffers (e.g., ammonium formate) are added to the mobile phase to enhance ionization efficiency and improve chromatographic peak shape [2]. |
| LC Column (e.g., C18) | The stationary phase that separates the target compound from other components in the sample matrix before it enters the mass spectrometer, reducing ionization suppression [2]. |
| Collision Gas | Chemically inert gases like Nitrogen (N2) or Argon (Ar) used in the collision cell to fragment the precursor ions via Collision-Induced Dissociation (CID) [1]. |
Why Collision Energy Optimization is Non-Negotiable for Reproducible Quantitation
Frequently Asked Questions
1. Why is collision energy optimization critical for my MRM assays? Collision energy (CE) is a key parameter that dramatically influences fragment ion intensity. Proper optimization ensures you achieve the highest possible sensitivity and selectivity for your target peptides, which is fundamental for obtaining reliable, reproducible quantitative data [5] [6]. Using suboptimal CE values can lead to poor fragmentation, reducing signal strength and compromising the accuracy of your quantitation, especially for low-abundance contaminants.
2. Can't I just use the instrument's default linear equation for collision energy? While default linear equations (of the form CE = slope * (precursor m/z) + intercept) provide a good starting point, they are often not sufficient for the most reproducible results. Research shows that these default equations can be improved. Using a linear equation optimized for your specific instrument platform and peptide charge state can significantly enhance performance. However, for the ultimate in sensitivity, individual optimization of the CE for each transition is recommended [6].
3. What is the practical difference between optimized linear equations and full individual transition optimization? A systematic study compared the signal intensity achieved using three approaches: vendor default equations, optimized linear equations, and individual transition optimization. The results, summarized in the table below, show that while individual optimization is best, optimized linear equations get very close with far less effort [6].
Table 1: Comparison of Collision Energy Optimization Strategies
| Strategy | Description | Relative Performance | Best Use Case |
|---|---|---|---|
| Vendor Default Equations | Generic linear equations provided by the instrument manufacturer. | Baseline | Initial method scoping. |
| Optimized Linear Equations | Lab-specific linear equations derived for a given instrument and charge state [6]. | ~7.8% average gain in total peak area over optimized equations [6] | High-throughput targeted methods where individual optimization is not feasible. |
| Individual Transition Optimization | CE is empirically determined for each specific precursor-product ion pair. | Best | Maximizing sensitivity and precision for validated, high-priority assays. |
4. How do I optimize collision energy in practice? The process can be automated using software like Skyline, a free, open-source tool for building MRM assays [6] [7]. The general workflow involves:
- Generating a transition list: Input your target peptide sequences into Skyline to generate a list of candidate precursor and product ions.
- Data acquisition: The software helps create a method where the instrument acquires data for your peptides across a range of collision energies.
- Data analysis: Skyline automatically analyzes the results and identifies the CE that produces the most intense signal for each transition.
- Exporting the optimized method: The final, optimized CE values are exported for use in your quantitative MRM method [6].
5. My quantitation results are inconsistent. Could poorly optimized collision energy be the cause? Yes. Inconsistent fragmentation due to poorly optimized CE is a common source of irreproducibility. It directly affects the peak areas used for quantification, leading to higher coefficients of variation (CVs) and reducing the reliability of your data across multiple runs [5] [6]. This is especially critical when transferring methods between different instruments or laboratories.
Experimental Protocol: Optimizing Collision Energy Using a Tryptic Digest
Here is a detailed methodology for collision energy optimization, adapted from a published study [6].
1. Sample Preparation:
- Protein Digest: Reconstitute a tryptic digest of a standard protein mixture (for example, six bovine proteins) to a concentration of approximately 50 fmol/μL in a solution of 97% water, 3% acetonitrile, and 0.1% formic acid [6].
- Injection: Inject 2 μL of the digest (100 fmol on-column) into the LC-MS/MS system.
2. LC-MS/MS Systems and Data Acquisition:
- Chromatography: Use a nanoflow HPLC system with a C18 or C12 reversed-phase capillary column (e.g., 75 μm I.D., 20 cm length). Elute peptides using a 60-minute gradient from 3% to 40% acetonitrile in water, both containing 0.1% formic acid [6].
- Mass Spectrometry: Perform analysis on a triple quadrupole mass spectrometer operated in positive electrospray MRM mode.
- Method Building with Skyline:
- Input the protein sequences of interest into Skyline to generate an initial list of candidate peptides and transitions [8] [7].
- In the method settings, specify a range of collision energies (e.g., in 5-unit steps) for each precursor ion to be tested.
- Export the method from Skyline and use it to acquire data on your instrument.
3. Data Analysis and Optimization:
- Automated Processing: Import the acquired data back into Skyline.
- Peak Detection: The software will automatically integrate the chromatographic peaks for each transition at every collision energy tested.
- Optimal CE Selection: Skyline will identify and select the collision energy that yielded the highest integrated peak area for each individual transition. This curated list of optimal CEs forms your final, optimized MRM method [6].
Workflow Diagram: From Peptide to Optimized Method
The following diagram illustrates the logical workflow for developing an optimized MRM assay, from initial peptide selection to final validation.
The Scientist's Toolkit: Essential Research Reagents & Materials
Table 2: Key Reagents and Materials for MRM Assay Development
| Item | Function / Description | Example / Citation |
|---|---|---|
| Trypsin | Protease for digesting proteins into peptides for bottom-up proteomics. | Use sequencing-grade trypsin (e.g., 1 mg/ml in 25 mM ammonium bicarbonate) [8]. |
| Ammonium Bicarbonate | Buffer for maintaining pH during protein denaturation and proteolysis. | 25 mM solution [8]. |
| Formic Acid | Mobile phase additive for LC-MS; improves chromatographic separation and ionization. | 0.1% (v/v) in water and acetonitrile [8] [6]. |
| Reference Protein Digest | A standardized sample of known proteins for system suitability testing and method optimization. | Tryptic digest of six bovine proteins [6]. |
| Synthetic Heavy Isotope-Labeled Peptides | Internal standards for highly accurate and precise absolute quantitation; correct for sample prep losses and ionization variability. | Peptides with labeled (e.g., 13C, 15N) amino acids, used in Direct Isotope Dilution (D-ID) [9]. |
| Skyline Software | Free, open-source Windows application for designing and analyzing targeted MS experiments (SRM, MRM, PRM, DIA). | Used to build transition lists, analyze data, and automate CE optimization [6] [7]. |
Frequently Asked Questions
What are the fundamental MRM parameters affected by Collision Energy (CE)? Collision Energy (CE) directly influences the efficiency with which precursor ions fragment into product ions. The key parameters it interacts with are:
- Dwell Time: The time spent monitoring a specific ion transition. Suboptimal CE can necessitate longer dwell times to achieve an acceptable signal-to-noise ratio, reducing the number of data points across a chromatographic peak [10].
- Cycle Time: The total time to measure all transitions in one cycle. Optimizing CE ensures strong, specific signals, preventing the need to monitor excessive transitions and helping to maintain a short cycle time for a sufficient number of data points per peak [10].
Why does my method work perfectly for some analytes but not others, even with a generalized CE equation? Generalized CE equations are useful starting points but may fail for many analytes. Bond formation and fragmentation efficiency depend on the specific residue content and proton mobility of the molecule [11]. Peptides with missed cleavages, or non-tryptic peptides, and certain compound classes like some peptides and antibiotics (e.g., vasopressin, ivermectin, colistin) may not generate a maximum response under generalized conditions and can even produce uninformative "pseudoMRM" transitions (e.g., 897.5 → 897) at low CE voltages [12].
My background noise increased after instrument maintenance. Could CE settings be involved? While a sudden increase in background noise is often related to contamination introduced during maintenance (e.g., from residual cleaning agents) [13], suboptimal CE can exacerbate the issue. If the CE is set too low, insufficient fragmentation may result in a weak product ion signal. If set too high, it can cause over-fragmentation of the precursor ion or even fragmentation of co-eluting background interferences, thereby increasing chemical noise in the mass spectrometer [11].
What can I do if MRM is not sensitive enough due to high background? For extremely challenging samples with co-eluting interferences, MRM³ is a powerful alternative. This hybrid QqQ/LIT workflow adds an extra stage of fragmentation. A specific fragment ion from a conventional MRM transition is isolated and fragmented again, producing a second generation of product ions. This significantly improves specificity and signal-to-noise by filtering out more background interference [14].
Troubleshooting Guide: Suboptimal Collision Energy
| Symptom | Possible Root Cause | Corrective Action |
|---|---|---|
| Low signal intensity for specific transitions | CE too low (incomplete fragmentation) or too high (precursor over-fragmented) [11] | Perform empirical CE optimization for each transition [11]. |
| High background noise in MRM channel | CE too high, causing fragmentation of co-eluting matrix compounds [11] | Re-optimize CE; use MRM³ for increased specificity [14]. |
| "PseudoMRM" transitions (e.g., 897.5 → 897) | Incapability to form stable product ions for certain "sticky" compounds [12] | Verify with a product ion scan; use SIM mode for quantitation if no fragments are found [12]. |
| Poor inter-day precision and sensitivity | Drift in optimal CE over time due to changes in gas pressure or instrument voltages [11] | Periodically re-calibrate and optimize CE values for critical transitions. |
| Inconsistent data across compound classes | Reliance on a single, generalized CE equation for diverse chemistries [11] | Use compound-specific or class-specific optimized CE values from empirical data or advanced libraries [15]. |
Experimental Protocol: Rapid CE Optimization via m/z Coding
This protocol enables the rapid determination of optimal Collision Energy (CE) for multiple MRM transitions in a single, continuous run, eliminating run-to-run variability [11].
1. Principle A precursor and product ion's precise m/z values are subtly adjusted at the hundredth decimal place. This "codes" different CE values for what the instrument perceives as unique transitions, allowing them to be cycled through rapidly in succession [11].
2. Materials and Reagents
- Instrument: Triple quadrupole mass spectrometer (e.g., Waters Quattro Premier, ABI 4000 QTRAP).
- Software: Control and data analysis software (e.g., MRM software package Mr. M).
- Samples: Standard solution of the target analyte(s) at a suitable concentration.
- LC System: Coupled to the MS, with mobile phase and column appropriate for the analyte.
3. Step-by-Step Procedure
- Step 1: Create Initial Transition List. Compile a list of the MRM transitions (precursor ion → product ion) you wish to optimize. Note the default CE from a generalized equation (e.g., CE = 0.034 x (precursor m/z) + 1.314 for doubly charged peptides) [11].
- Step 2: Generate Coded Transition List. Use a script (e.g., a Perl script as referenced) to create multiple versions of each transition. For each original transition, generate new targets where the precursor and product m/z are adjusted to code for a range of CE values (e.g., from -6 V to +6 V of the default CE in 2 V steps).
- Step 3: Execute Single Optimization Run. Inject the standard solution and run the method containing all coded transitions.
- Step 4: Data Analysis. Process the acquired data using software like Mr. M. The software will extract the signal intensity for each "transition" (i.e., each CE value). The optimal CE is identified as the value that produces the maximum signal intensity for the true product ion [11].
4. Research Reagent Solutions
| Item | Function in Protocol |
|---|---|
| Triple Quadrupole Mass Spectrometer | Platform for performing MRM experiments and the rapid optimization workflow [11]. |
| MRM Optimization Software (e.g., Mr. M) | Enables easy visualization and quantification of signal intensities across different CE values to determine the optimum [11]. |
| Authenticated Chemical Standards | Pure analyte standards are essential for generating reliable and reproducible optimization data [15]. |
| METLIN 960K MRM Library | A large-scale library of empirically acquired MS/MS data and predicted transitions to inform initial CE selection [15]. |
| Script for m/z Recoding | A computational tool (e.g., Perl script) that automatically adjusts precursor and product m/z values to code for different collision energies [11]. |
Workflow for Diagnosing and Resolving CE-Related Issues
The following diagram illustrates a systematic workflow to troubleshoot and resolve issues related to suboptimal Collision Energy.
Key Quantitative Data on CE Optimization Outcomes
The table below summarizes typical performance gains achievable through empirical CE optimization, based on documented studies and principles.
| Analytical Context | Optimization Method | Key Outcome & Impact |
|---|---|---|
| Peptide Analysis (90 transitions) [11] | Rapid m/z coding for CE range (±6 V) | Identified peptide-specific optimal CE that deviated from generalized equation, maximizing product ion signal [11]. |
| Small Molecule Analysis (100+ compounds) [15] | Spline-fitting of CE-intensity profiles from empirical MS/MS data | Enabled robust detection down to 1 nM, confirming sensitivity and scalability of data-driven CE prediction [15]. |
| Instrument Source Parameters [16] | Stepwise optimization of source temp, gas flows, and voltages | Achieved sensitivity gains of 2- to 3-fold, highlighting the need to optimize CE in the context of other parameters [16]. |
| PseudoMRM Challenge [12] | Switching to SIM mode | Resulted in a 10x increase in sensitivity for problematic compounds (e.g., Ivermectin) that failed to produce useful fragments [12]. |
In Multiple Reaction Monitoring (MRM) mass spectrometry, achieving optimal sensitivity and specificity requires the careful tuning of several key instrument parameters. While Collision Energy (CE) is often the focus for inducing peptide fragmentation, parameters like Cone Voltage (CV) and Declustering Potential (DP) are equally critical for robust method development, especially in contaminant analysis research. This guide provides targeted troubleshooting and FAQs to help researchers systematically address experimental challenges and optimize these essential settings.
FAQs: Understanding Key MRM Parameters
1. What is the fundamental difference between Declustering Potential (DP) and Collision Energy (CE)?
- Declustering Potential (DP): Applied at the orifice, DP uses a voltage gradient to break apart solvent clusters that may have formed around sample ions after they enter the vacuum chamber, preventing source contamination and maximizing ion transmission into the analyzer. An unnecessarily high DP can induce unwanted in-source fragmentation. [17]
- Collision Energy (CE): This is the potential difference between Q0 and the collision cell (Q2). Precursor ions are accelerated by this energy into the collision cell, where they collide with gas molecules (e.g., argon) and undergo fragmentation into product ions. Higher CE typically induces more fragmentation. [17] [18]
2. Why is it necessary to optimize CE and DP for each MRM transition, even when generalized equations exist?
Although generalized equations exist for parameters like CE, they may not produce the maximum signal response for all MRM transitions. Peptides with unique residue combinations, missed cleavages, or those analyzed with non-trypsin enzymes may fragment optimally under conditions different from the typical tryptic peptide. Relying solely on generalized equations can lead to suboptimal sensitivity. [11]
3. I've optimized my MRM transition, but my chromatographic peaks are excessively jagged. What could be the cause?
This can result from a very narrow collision energy peak for that specific transition. If the applied CE is even slightly off the narrow optimal value, it can cause signal instability. Troubleshooting steps include: [19]
- Verify CE Optimization: Re-profile the CE around the current value with finer steps to confirm you are at the true signal maximum.
- Explore Alternative Transitions: If available and validated, use a different product ion for the same precursor. The alternate transition may have a broader, more stable CE profile. [19]
- Check Data Point Density: Increase the number of data points across the peak by adjusting the dwell time and cycle time to better define the peak shape. [19]
Troubleshooting Guides
This issue often stems from suboptimal ion transmission from the source into the mass analyzer.
| Possible Cause | Diagnostic Steps | Corrective Action |
|---|---|---|
| Suboptimal Declustering Potential (DP) | Perform a DP ramp while infusing the analyte to see how signal intensity changes. [17] | Systematically optimize the DP for each analyte to find the value that maximizes the precursor ion signal without causing in-source fragmentation. [17] |
| Incorrect Cone Voltage (CV) | Similar to DP, perform a CV ramp during infusion. [11] | Optimize CV to maximize the transmission of the selected precursor ion into the collision cell. [11] |
| Source Contamination | Check for a sudden, consistent drop in signal across multiple analytes. | Clean the ion source and orifice. Increase the Curtain Gas (CUR) setting within manufacturer recommendations to help repel contaminants. [17] [20] |
Problem 2: Unstable Signal or High Background in Complex Matrices
This is common when analyzing contaminants in complex samples like biological or environmental matrices.
| Possible Cause | Diagnostic Steps | Corrective Action |
|---|---|---|
| Insufficient Selectivity | Check for interferences in the MS1 precursor ion chromatogram. [21] | Optimize chromatography to separate the analyte from interferents. If using SWATH/DIA, consider utilizing MS1 ion intensity data in addition to MS2 for more reliable quantitation. [21] |
| Carryover or Contamination | Run blank injections after high-concentration samples. | Implement a robust needle wash protocol and ensure a strong wash step in the LC gradient. |
| Gas Leaks | Use a leak detector to check the gas supply, connections, and column fittings. [20] | Retighten connections or replace cracked parts as necessary. [20] |
Experimental Protocols for Parameter Optimization
Detailed Workflow 1: Automated Optimization via Software
Modern instrument software often includes tools for automated MRM development, which is particularly useful for molecules with multiple charge states.
- Step 1: Precursor Ion Detection: The software automatically discovers ions related to various charge states and profiles the optimal cone voltage for each precursor. [22]
- Step 2: Product Ion Discovery: For each discovered precursor ion, the software identifies potential precursor m/z → product m/z pairs. [22]
- Step 3: Product Ion Optimization: The collision energy for each identified transition is profiled and optimized to find the value that generates the most intense product ion signal. [22]
- Step 4: Method Transfer: The optimized transitions and parameters are directly exported to the acquisition method editor, eliminating transcription errors. [22]
Detailed Workflow 2: Rapid Empirical Optimization via m/z Adjustment
This innovative "single-run" workflow allows for the empirical determination of optimal CE and CV without run-to-run variability.
- Principle: The precursor and product m/z values are subtly altered at the hundredth decimal place. This makes a single transition repeated at seven different parameter values appear as seven unique transitions to the instrument, allowing them to be cycled through in rapid succession. [11] [23]
- Execution:
- Start with a list of MRM transitions.
- Use a script to adjust the Q1 and Q3 m/z values to code for different parameter values (e.g., CE from -6V to +6V of the default in 2V steps).
- The script outputs a new MRM method with all "unique" transitions.
- Analyze the sample in a single run and use software (e.g., Mr. M) to visualize the results and determine the optimal parameter for each transition. [11]
The following diagram illustrates the logical relationship between the key parameters tuned in this workflow and the sections of the mass spectrometer they affect:
The Scientist's Toolkit: Essential Research Reagents & Materials
The following table details key materials and reagents used in MRM method development and optimization.
| Item | Function in MRM Analysis |
|---|---|
| Syringe Pump | Used for direct infusion of the analyte solution into the ion source for parameter optimization without chromatography. [17] |
| LC Pump & Autosampler | Used for Flow Injection Analysis (FIA), another method for sample introduction that uses the LC system but without a chromatographic column. [17] |
| Argon (Ar) Gas | Serves as the Collision Gas (CAD). Precursor ions collide with argon atoms in the collision cell (Q2), transferring kinetic energy and causing fragmentation into product ions. [17] |
| Nitrogen (N₂) Gas | Typically used as the Nebulizer Gas (GS1) for droplet formation and the Heating Gas (GS2) for desolvation in the ion source. [17] |
| Standard Protein/Pepetide Mixture | A digest of known proteins (e.g., 18-protein ISB mix) used as a model system for developing and benchmarking MRM methods. [11] |
| Mobile Phase Additives | Acids like formic acid (0.1%) are added to the LC mobile phase to promote protonation and efficient ionization of analytes in positive ESI mode. [22] |
Proven Strategies and Advanced Workflows for CE Optimization
Frequently Asked Questions (FAQs)
What are traditional rule-based collision energy equations, and why are they used?
Traditional rule-based collision energy (CE) equations are simple mathematical formulas, often linear, that predict the optimal collision energy for a Multiple Reaction Monitoring (MRM) transition based on the mass-to-charge ratio (m/z) of the precursor ion [7]. They provide a practical starting point for method development, especially when pure standards are unavailable for experimental optimization. An example of such an equation for a doubly charged peptide on a TSQ Quantiva instrument is: CE = 0.0339 x m/z + 2.3597 [7].
What are the main limitations of these rule-based equations?
The primary limitation is their constrained accuracy and applicability. They often fail to account for the unique fragmentation behavior of different molecules and chemical classes [15]. These rules are typically derived from limited datasets (e.g., specific peptide types) and may not generalize well to diverse small molecules, such as environmental contaminants or drugs, leading to suboptimal sensitivity [15]. Furthermore, they offer a single, static value and cannot model the continuous, energy-dependent fragmentation profiles of different product ions from the same precursor [15].
How can I identify poor data resulting from suboptimal collision energy?
Inaccurate and imprecise transition data can be identified using algorithms like AuDIT (Automated Detection of Inaccurate and Imprecise Transitions) [24]. Key indicators include:
- Interfering Signals: A significant difference in the relative product ion intensities between the native analyte and its stable isotope-labeled internal standard (SIS), detected with a t-test [24].
- Poor Precision: A high coefficient of variation (CV) in the analyte-to-SIS peak area ratio across sample replicates [24]. Manual inspection is time-consuming and subjective, making automated tools essential for robust data quality control [24].
What are the modern alternatives to rule-based equations?
Modern approaches leverage large, empirical spectral libraries and advanced computational methods:
- Empirical Spline-Based Modeling: This method uses MS/MS data collected at multiple collision energies (e.g., 0, 10, 20, 40 eV) to build a continuous model of fragment ion behavior, precisely predicting the optimal CE for each transition [15].
- AI-Guided Optimization: Supervised learning models, such as RandomForestRegressor and GradientBoostingRegressor, can refine these models to improve prediction accuracy and reproducibility across diverse chemical classes [15].
- Large Empirical Libraries: Resources like the METLIN 960K MRM library provide empirically derived transitions and optimized CE values for nearly one million small molecules, dramatically expanding coverage beyond the scope of simple rules [15].
Troubleshooting Guides
Problem: Inconsistent or Low Signal for MRM Transitions
Potential Cause: The collision energy is not optimized for your specific analyte and instrument, leading to inefficient fragmentation or the selection of weak product ions.
Solution:
- Verify with Rules of Thumb: If no other data is available, start with a vendor-recommended or literature-based equation for your instrument class [7].
- Consult Empirical Libraries: Check if your compound or a close analog exists in a large-scale library like METLIN 960K MRM [15].
- Experimental Optimization (Gold Standard):
- If a pure standard is available, directly infuse it and perform a collision energy ramp around the predicted value while monitoring the intensity of key fragment ions.
- The optimal CE is the value that maximizes the signal for the quantifier transition.
- Validate Transition Quality: Use a quality control algorithm like AuDIT to automatically detect inaccurate transitions caused by interference, ensuring your signal is specific to the target analyte [24].
Problem: Method Fails to Transfer Between Different Instruments or Labs
Potential Cause: Rule-based equations are often instrument-specific. A method developed on one triple-quadrupole mass spectrometer may not perform optimally on another due to differences in collision cell design and pressure.
Solution:
- Re-optimize Key Parameters: When moving a method, re-optimize the collision energy, even if using the same equation, as the optimal value may shift.
- Adopt Vendor-Neutral Workflows: Use precursor-centric transition libraries, like the METLIN 960K, which are derived from empirical data and designed to be more vendor-independent [15].
- Document Full Context: Always report the instrument model, collision gas pressure, and the specific CE equation used alongside the final CE values to facilitate reproduction.
Data Presentation: Collision Energy Optimization Methods
The table below compares different approaches to collision energy optimization for MRM assays.
| Methodology | Underlying Principle | Key Advantages | Key Limitations | Reported Performance / Validation |
|---|---|---|---|---|
| Traditional Rule-Based Equations [7] | Linear relationship between precursor m/z and optimal CE. | Fast, simple, and provides a starting point without pure standards. | Limited chemical applicability; static prediction; instrument-specific. | Serves as a baseline; performance varies significantly with chemical space. |
| Empirical Spline-Based CE Modeling [15] | Cubic spline fitting on fragment ion intensity profiles from data collected at 4+ discrete CEs. | Continuous energy modeling; data-driven; more accurate than linear rules. | Requires initial MS/MS data at multiple energies. | Robust detection down to 1 nM validated for over 100 diverse compounds. |
| AI-Guided Refinement [15] | Supervised machine learning models (e.g., Random Forest) refine spline fitting across chemical classes. | Improved prediction accuracy and reproducibility for novel compounds. | Computational complexity; requires a large, high-quality training dataset. | Improved generalization and predictive accuracy across diverse chemical classes. |
Experimental Protocols
Protocol 1: Foundational MRM Assay Development and CE Optimization Using Rule-Based Equations
This protocol outlines the initial steps for developing a quantitative MRM assay, starting with traditional rules [7].
1. Signature Peptide Selection (for proteins) or Precursor Ion Selection (for small molecules):
- Choose a peptide unique to the target protein with a length of 5-25 amino acids and fully tryptic (or appropriate enzymatic) ends.
- Avoid peptides with chemically unstable residues (e.g., M, W) or known post-translational modifications.
- For small molecules, select a precursor ion ([M+H]+, etc.) with good stability and intensity.
2. Product Ion Selection:
- Select 3-5 specific fragment ions. For peptides, y-ions with higher m/z are generally preferred.
- Choose the most intense fragments from a reference MS/MS spectrum to maximize sensitivity.
3. Initial Collision Energy Setting:
- Apply a rule-based equation appropriate for your instrument and precursor charge state.
4. Assay Validation:
- Confirm peptide identity by acquiring a full MS2 spectrum.
- Use synthetic stable isotope-labeled standards (SIS) for precise quantification and to correct for matrix effects [24].
Protocol 2: Advanced Optimization Using Empirical Data and the METLIN 960K MRM Library
This modern protocol leverages large-scale empirical data to overcome the limitations of rule-based equations [15].
1. Data Source and Spectral Preprocessing:
- Source high-resolution MS/MS spectra from an empirical database like METLIN, which contains data from authenticated chemical standards.
- Ensure data includes spectra collected at multiple, standardized collision energies (e.g., 0, 10, 20, and 40 eV).
2. Fragment Tracking and CE Profiling:
- Use an algorithm to dynamically track fragment ions across the different collision energies.
- Group recurring fragment ions corresponding to the same molecular feature.
- Assign a collision energy–intensity profile to each matched ion group.
3. Spline-Based CE Prediction:
- Apply univariate cubic spline fitting to the CE–intensity curve for each fragment.
- The predicted optimal CE is the maximum of the spline curve.
- AI Refinement (Optional): Use supervised learning models (e.g., GradientBoostingRegressor) to evaluate and refine the spline-fitting parameters across diverse chemical classes, improving generalizability.
4. Transition Selection:
- Quantifier Ion: The most intense and stable fragment from the CE–intensity profile.
- Qualifier Ion: The next-most intense fragment that is reproducible and has a mass separation of ≥2.0 Da from the precursor m/z to avoid precursor-related artifacts.
Workflow Visualization: From Traditional Rules to Modern Optimization
The diagram below illustrates the logical relationship and evolution from traditional to modern collision energy optimization strategies.
| Item / Resource | Function / Application | Relevance to CE Optimization |
|---|---|---|
| Stable Isotope-Labeled Internal Standards (SIS) [24] | Authentic standards with heavy isotopes; correct for matrix effects and validate analyte identity. | Critical for validating transition accuracy via comparing ion ratios with the native analyte (AuDIT algorithm). |
| METLIN 960K MRM Library [15] | A library of ~960,000 empirically acquired small-molecule MS/MS spectra and predicted MRM transitions. | Provides data-driven, optimized CE values, bypassing the need for initial rule-based estimates. |
| Skyline Software [7] | A free, open-source application for building MRM methods and analyzing resulting data. | Central platform for designing MRM assays, managing transition lists, and integrating CE values from various sources. |
| AI BioSync (via XCMS) [15] | A framework of AI and machine-learning tools for refining analytical data and model prediction. | Used to improve the accuracy of spline-based CE predictions across diverse chemical classes. |
| Authenticated Chemical Standards [15] [25] | Pure, confirmed analytes for experimental method development and validation. | Essential for the gold-standard approach of direct experimental CE optimization and for generating empirical spectral libraries. |
Frequently Asked Questions
What is the primary advantage of using the incremental m/z adjustment technique? This technique allows for the determination of the optimal value for any programmable instrument parameter (like Collision Energy or Cone Voltage) for each MRM transition within a single, continuous run. This avoids run-to-run variability, saves significant time, and ensures that comparisons between different parameter values are not affected by changes in instrument performance over time [11].
My instrument software doesn't allow multiple entries for the same precursor-product pair. How does this method work around that? The method cleverly reprograms the precursor and product m/z values at the hundredth decimal place. This makes a single precursor-product target repeated at multiple collision energies appear to the instrument as multiple, distinct MRM targets, allowing them to be cycled through in rapid succession [11].
I am optimizing my method for contaminant analysis. Why can't I just use the generalized collision energy equations? Generalized equations are a useful starting point, but they may fail to produce the maximum signal for all types of MRM transitions. Factors such as specific peptide residue content, proton mobility, and the presence of particular residues or residue combinations can mean that a individually optimized collision energy far outperforms the generalized value, ultimately improving the sensitivity and robustness of your quantitative method for contaminants [11].
After optimization, my chromatographic peaks are very jagged and unstable. What could be the cause? Excessively jagged peaks, even with an optimized collision energy, can indicate that the transition is inherently unstable or that the optimal collision energy window is extremely narrow. This issue is sometimes observed with certain small molecules and specific transitions. Troubleshooting steps include:
- Ensuring an adequate MS sampling rate (aim for 10-15 data points across a chromatographic peak) [7].
- Investigating alternate, more stable MRM transitions for the same compound, if available and allowed by your analytical method [19].
- Checking that the chosen fragment ion is not susceptible to common interferences or in-source fragmentation [19].
I used Skyline for iterative optimization, but the optimal CE shifts incorrectly when I import the data. What should I do? This is a known issue that can arise from how Skyline reads collision energy values from result files. Skyline may default to recalculating the CE using its built-in predictor equation upon data import, rather than using the value from your optimization library. Ensure that you are using the "optimization library" values when exporting new transition lists, and verify the settings under
Settings > Transition Settings > Prediction > Collision Energy[26].
Troubleshooting Guides
Problem: Poor Signal Intensity After Optimization
Potential Causes and Solutions:
Suboptimal Fragment Ion Selection:
- Cause: The selected product ion has low inherent abundance.
- Solution: Re-investigate the MS/MS spectrum. Prioritize y-ions with higher m/z values, as the low m/z range often contains contaminant ions. b-ions are often of low abundance or absent in triple quadrupole fragment spectra [7].
Incorrect Optimization of Precursor Ion:
- Cause: The orifice voltage or declustering potential is not optimized, leading to poor transmission of the precursor ion to the collision cell.
- Solution: Before optimizing collision energy, ensure the precursor ion signal is maximized. Scan through a range of orifice voltages to find the optimum. If signal for
[M+H]+or[M-H]-is low, consider optimizing for adducts like[M+NH4]+[2].
Exceeding Dynamic Range:
- Cause: The concentration of the standard used for infusion or flow injection is too high or too low.
- Solution: Use a pure standard diluted to an appropriate concentration (e.g., 50 ppb - 2 ppm) in a solvent compatible with your prospective mobile phase [2].
Problem: High %RSD in Quantitative Results
Potential Causes and Solutions:
Insufficient Data Points Across Peak:
- Cause: The MS duty cycle is too long, resulting in a poorly defined chromatographic peak shape.
- Solution: Adjust the dwell time and the number of concurrent transitions to achieve a faster duty cycle. A good target is 10-15 data points across a chromatographic peak. For a 30-second peak, this requires a duty cycle of 2-3 seconds [7].
Unstable MRM Transition:
- Cause: As noted in the FAQs, some transitions are inherently unstable, producing jagged peaks that integrate poorly [19].
- Solution: If the transition is known to be problematic, select an alternative, more stable transition for the same compound, ensuring it is permitted by your method's guidelines.
Experimental Protocol & Data Presentation
Detailed Methodology: Incremental m/z Adjustment Workflow
The following workflow, adapted from the foundational technique, allows for rapid CE optimization in a single run [11].
1. Generate Initial MRM Transition List:
- Start with a list of transitions, including precursor m/z, product m/z, and an initial collision energy calculated from a generalized equation (e.g., for a triple-charged peptide:
CE = 0.034 × (precursor m/z) + 2.2835) [7].
2. Reprogram m/z Values to Encode CE:
- Use a script (e.g., in Perl) to create multiple copies of each transition.
- Round the original precursor and product m/z values to the nearest tenth.
- Use the hundredth decimal place of the product m/z value to encode different collision energies.
- For example, for a transition with a product ion at 448.24, the table below shows how the m/z is adjusted to represent a range of CEs from 7.4 V to 19.4 V [11]:
| Peptide | Original Q1 m/z | Original Q3 m/z | Adjusted Q1 m/z | Adjusted Q3 m/z | Adjusted CE (V) |
|---|---|---|---|---|---|
| TPHPALTEAK | 355.53 | 448.24 | 355.51 | 448.21 | 7.4 |
| TPHPALTEAK | 355.53 | 448.24 | 355.51 | 448.22 | 9.4 |
| TPHPALTEAK | 355.53 | 448.24 | 355.51 | 448.23 | 11.4 |
| TPHPALTEAK | 355.53 | 448.24 | 355.51 | 448.24 | 13.4 |
| TPHPALTEAK | 355.53 | 448.24 | 355.51 | 448.25 | 15.4 |
| TPHPALTEAK | 355.53 | 448.24 | 355.51 | 448.26 | 17.4 |
| TPHPALTEAK | 355.53 | 448.24 | 355.51 | 448.27 | 19.4 |
Source: Adapted from J Proteome Res. 2009 Jul;8(7):3746–3751 [11].
3. Execute the Single Optimization Run:
- Load the modified transition list (now containing hundreds of apparent transitions) into the triple quadrupole mass spectrometer.
- Perform a single LC-MS/MS run, typically infusing or injecting the analyte of interest.
4. Data Analysis and Visualization:
- Process the data using MRM analysis software (e.g., Mr. M, Skyline).
- The software will group the subtly different m/z values back to their original transition.
- Plot the signal intensity of each transition against the collision energy used (as encoded by the m/z).
- The collision energy that produces the maximum signal intensity is the optimal value for that specific MRM pair.
Workflow Diagram
The following diagram illustrates the logical flow of the incremental m/z adjustment technique:
The Scientist's Toolkit: Essential Research Reagents & Materials
The following table lists key materials and software used in the development and application of the incremental m/z optimization technique and related MRM assays.
| Item | Function in the Experiment |
|---|---|
| Triple Quadrupole Mass Spectrometer (e.g., Waters Quattro Premier, ABI 4000 QTRAP, Agilent 6470) | The primary instrument used for MRM data acquisition. It selectively filters precursor ions, fragments them in a collision cell, and filters specific product ions for detection [11] [19]. |
| Pure Chemical Standard | A solution of the pure analyte (e.g., diluted to 50 ppb-2 ppm) is essential for optimization free from interference, ensuring the measured signal is specific to the target compound [2]. |
| MRM Software Package (e.g., Skyline, Mr. M) | Critical for designing the MRM experiment, analyzing the resulting chromatographic data, visualizing the collision energy curves, and determining the optimal instrument parameters [11] [7]. |
| Script for m/z Adjustment (e.g., Perl script) | A custom script is used to automate the process of generating the modified transition list by reprogramming the precursor and product m/z values to encode different collision energies [11]. |
| d-SPE Sorbents (e.g., C18 end-capped, PSA) | Used in sample cleanup (e.g., QuEChERS) to purify complex samples like food contaminants (mycotoxins) before LC-MS/MS analysis, reducing matrix effects and improving sensitivity [27]. |
| LC-MS Grade Solvents & Columns | High-purity solvents (water, methanol, acetonitrile) and appropriate UHPLC columns (e.g., Raptor Biphenyl) are necessary for achieving good chromatographic separation, which is crucial for accurate quantification [27] [2]. |
FAQ: Database Fundamentals and Access
What is the METLIN 960K MRM Database? The METLIN 960K MRM Database is a public resource containing empirically derived multiple reaction monitoring (MRM) transitions for approximately 960,000 compounds [28]. It is designed to enable sensitive and specific targeted quantification of small molecules by mass spectrometry, bridging the gap between discovery and quantitative analysis [29].
How does it differ from previous MRM libraries? Unlike prior methods that relied on in silico fragmentation or heuristic rules, all transitions in the METLIN 960K library are derived directly from experimental MS/MS data using absolute intensities [28]. This empirical approach uses a data-driven framework that models collision energy-dependent fragmentation, leading to more reliable and optimized transitions.
What types of transitions are available? The database provides transitions derived through a novel, adaptive modeling pipeline. Furthermore, the broader METLIN-MRM ecosystem, upon which this 960K resource builds, traditionally offers three types of transitions [30] [31]:
- Experimentally Optimized (EO) Transitions: Acquired by analyzing pure standards on triple quadrupole instruments.
- Computationally Optimized (CO) Transitions: Optimized by ranking empirical MS/MS fragments from a qTOF instrument based on their selectivity and intensity.
- Public Repository (PR) Transitions: User-submitted transitions from peer-reviewed literature, promoting data sharing and reproducibility.
In which ionization modes are transitions available? The METLIN 960K MRM library provides transitions for compounds in both positive and negative ionization modes [28].
FAQ: Experimental Optimization and Setup
How were the collision energies for transitions determined? The library was created using an empirical spline-based pipeline. Collision energy-dependent intensity profiles were built from experimental MS/MS data collected at four discrete energies (0, 10, 20, and 40 eV). This allowed for continuous CE modeling and precise prediction of optimal fragmentation conditions for each compound [28].
How many transitions should I monitor per compound? It is a common practice to monitor at least two MRM transitions per compound [2]. The most intense transition is typically used for quantification, while the second is used for confirmation. Monitoring a third or fourth transition, if available, can further ensure accuracy and help avoid interferences [2].
What is the typical sensitivity of assays developed with this database? Validation studies across more than 100 authentic compounds demonstrated robust detection down to 1 nM, confirming the high sensitivity of the approach [28].
Can I use this database for compounds without commercial standards? Yes. A key advantage of this database is its immediate applicability in situations where authentic metabolite and impurity standards are unavailable, such as in early drug metabolism studies [28] [29].
FAQ: Data Analysis and Interpretation
What software can I use to analyze data acquired with these transitions? The METLIN-MRM library is integrated with XCMS-MRM, a cloud-based data analysis platform [30] [31]. XCMS-MRM can process raw data files from any vendor format, perform peak detection and integration, and provide quality control indicators [31].
How does XCMS-MRM improve data quality? XCMS-MRM uses information from all transitions for a given compound and applies unimodality through an isotonic regression to the final chromatographic-peak profile. This improves peak quality by ensuring only one peak is integrated, minimizing interference from noise and co-eluted peaks [30].
What quality control indicators does the platform provide? The XCMS-MRM platform provides indicators to assess accuracy, specificity, limits of detection (LOD), limits of quantification (LOQ), and linear dynamic ranges [31].
Troubleshooting Guide
Problem: Low Signal Intensity for a Transition
Potential Causes and Solutions:
- Cause 1: The predicted optimal collision energy may not be perfectly tuned for your specific instrument.
- Solution: Consider fine-tuning the collision energy around the provided value. A published workflow allows for rapid re-optimization of CE in a single run by subtly adjusting precursor and product m/z values to code for different energies [11].
- Cause 2: The transition may be susceptible to matrix effects or interference in your specific sample.
- Solution: Consult the database for alternative transitions for the same compound. Using the most selective transition, rather than just the most intense, can reduce interference [31].
- Cause 3: The parent ion formation is inefficient.
- Solution: Verify the parent ion mass. Besides the common
[M+H]+or[M-H]-, consider checking for adducts with mobile phase additives (e.g.,[M+NH4]+) [2].
- Solution: Verify the parent ion mass. Besides the common
Problem: Poor Chromatographic Peak Shape
Potential Causes and Solutions:
- Cause: LC conditions are not optimized for the compound, leading to broad or tailing peaks.
Problem: Inconsistent Quantification Results
Potential Causes and Solutions:
- Cause 1: The ratio between the quantifier and qualifier transitions does not match the expected ratio from a standard.
- Solution: A compound should only be confirmed if the ratio of its MRM pairs matches the ratio observed in the standard [2]. A mismatch suggests potential interference.
- Cause 2: Insufficient data points across the chromatographic peak.
- Solution: Ensure a fast enough sampling rate. Ideally, 10-15 data points should be acquired across a peak. This can be managed by adjusting the dwell time and using scheduled MRM to reduce the number of concurrent transitions [7].
Essential Research Reagent Solutions
The following table details key resources used when working with the METLIN 960K MRM database.
| Resource Name | Function & Description | Access Information |
|---|---|---|
| METLIN 960K MRM Database | Core transition library providing precursor/product ion pairs and optimized collision energies for ~960k compounds [28]. | https://metlin.scripps.edu/ |
| XCMS-MRM Platform | Cloud-based platform for data analysis; performs peak detection, integration, and provides QC metrics for MRM data [30] [31]. | http://xcmsonline-mrm.scripps.edu |
| AI BioSync | An XCMS enhancement using AI and machine-learning tools to refine spline fitting of MS/MS data for biological and analytical relevance [28]. | Integrated within the pipeline. |
| Chemical Standards | Pure compounds used for initial method development and validation of database predictions [2]. | Commercial vendors. |
| Stable Isotope-Labeled Standards | Internal standards for absolute quantification, correcting for matrix effects and recovery losses [31]. | Commercial vendors. |
Experimental Protocol: Utilizing the METLIN 960K MRM Database
This protocol outlines the steps to use the METLIN 960K MRM resource for targeted quantitation.
Step 1: Transition Selection and Method Setup
- Access the METLIN database (https://metlin.scripps.edu/) and search for your target compounds [31].
- Select the desired MRM transitions from the library. For each compound, it is recommended to select a minimum of two transitions [2].
- Export the transition list, which includes precursor ion, product ion, and optimized collision energy values.
- Program these transitions into your triple quadrupole mass spectrometer method.
Step 2: LC-MS/MS Analysis
- Use an appropriate LC system coupled to a triple quadrupole mass spectrometer.
- Employ a suitable chromatographic column (e.g., C18 for non-polar compounds) and mobile phase [2].
- Inject the sample and run the MRM method. The instrument will monitor the specified transitions over the chromatographic run.
Step 3: Data Processing with XCMS-MRM
- Upload the raw data files from your mass spectrometer to the XCMS-MRM platform (http://xcmsonline-mrm.scripps.edu) [31].
- The platform will automatically process the data, performing peak detection, integration, and alignment across samples.
- Review the automated peak integration and manually refine it if necessary for transitions affected by co-elution or matrix effects.
Step 4: Validation and Quantification
- Check the quality control indicators provided by XCMS-MRM, including transition intensity ratios [31] [2].
- For absolute quantification, use a calibration curve generated from chemical standards. Stable-isotope labeled internal standards are recommended for the highest accuracy [31].
Workflow and Signaling Pathways
The following diagram illustrates the integrated workflow from transition selection to quantitative results using the METLIN and XCMS-MRM platforms.
Workflow for Using the METLIN 960K MRM Resource
AI and Spline-Based Modeling for Precise CE Prediction from Sparse Data
Troubleshooting Guides
Data-Related Issues
Problem: Poor Spline Fit and Unreliable CE Predictions
- Symptoms: High variance in predicted optimal collision energy (CE); poor reproducibility of MRM transitions; model fails to identify intense fragment ions.
- Potential Causes:
- Insufficient Data Points: Attempting to fit spline curves with MS/MS data collected at fewer than four distinct collision energies [15].
- Incorrect Fragment Tracking: Misalignment of fragment ions across different collision energies due to high mass tolerance or spectral noise [15].
- Low Signal-to-Noise Ratio: High background noise obscures true fragment intensity profiles, leading to inaccurate spline modeling [15].
- Solutions:
- Ensure MS/MS data is collected at a minimum of four discrete collision energies (e.g., 0, 10, 20, and 40 eV) to provide a stable foundation for spline fitting [15].
- Tighten the mass tolerance for fragment ion alignment (e.g., ±0.5 Da) and implement algorithms that require a fragment to be detected in at least three of the four CE levels to be considered valid [15].
- Apply spectral preprocessing techniques, such as centroiding and noise filtering, before initiating the fragment tracking and spline fitting process [15].
Problem: AI Model Fails to Generalize Across Compound Classes
- Symptoms: Accurate CE predictions for one class of molecules (e.g., lipids) but poor performance for others (e.g., pharmaceuticals).
- Potential Causes:
- Biased Training Data: The supervised learning model was trained on a dataset that does not adequately represent the chemical diversity of your target analytes [15].
- Suboptimal Hyperparameters: The model's hyperparameters (e.g., for RandomForest or GradientBoosting algorithms) are not tuned for the specific task of CE prediction [32].
- Solutions:
- Refine the AI model using a diverse training set that encompasses a wide range of chemical classes relevant to your application, such as metabolites, lipids, and contaminants [15].
- Conduct systematic hyperparameter optimization (HPO) using frameworks like Optuna with Bayesian Optimization and Hyperband (BOHB) to identify the most effective model configuration for your data [32].
Implementation and Workflow Issues
Problem: Inability to Distinguish Isomeric Compounds
- Symptoms: The model suggests identical or very similar optimal CE values and transitions for isomeric compounds, leading to poor analytical specificity.
- Potential Causes:
- Model Limitations: The foundational model or feature set lacks the granularity to capture subtle fragmentation differences between isomers [33].
- Solutions:
- Employ a more advanced foundation model, such as LSM-MS2, which is specifically designed to improve the identification of challenging isomeric compounds by learning a more nuanced chemical space [33].
- Validate model predictions for isomers against a targeted internal benchmark set to ensure performance meets the required standards for your research [33].
Problem: High Computational Demand for Large-Scale Prediction
- Symptoms: Processing times for predicting transitions across thousands of compounds are prohibitively long.
- Potential Causes:
- Inefficient Code: The implementation of spline fitting and AI refinement may not be optimized for large datasets [15].
- Insufficient Hardware: Lack of access to high-performance computing (HPC) resources.
- Solutions:
- Leverage established computing clusters and parallel processing frameworks, as used in the development of the METLIN 960K MRM library, to handle large-scale computations efficiently [15].
- Utilize optimized scientific computing libraries in Python (e.g., NumPy, Pandas) and R for spline calculations to improve performance [15].
Frequently Asked Questions (FAQs)
Q1: What is the minimum number of collision energy data points required for accurate spline-based CE prediction? A minimum of four discrete collision energy data points is recommended to construct a stable and continuous spline curve for predicting the optimal CE. Using fewer points can lead to unstable and unreliable extrapolations [15].
Q2: How does AI enhance the basic spline-fitting approach for CE prediction? While spline fitting creates the core CE-intensity profiles, AI and supervised learning models (e.g., Random Forest, Gradient Boosting) act as a refinement layer. They evaluate and optimize the spline-fitting performance across diverse chemical classes, improving the overall reproducibility and predictive accuracy of the model [15].
Q3: Can this approach be used for compounds where no authentic standard is available? Yes. A primary advantage of using a large, empirical spectral library like METLIN is that it enables MRM transition generation for a vast array of compounds based on previously acquired MS/MS data from authentic standards. This allows for predictive modeling even when a commercial standard for a specific compound is unavailable [15].
Q4: My predicted transitions are too close to the precursor m/z. How can I improve selectivity? The selection algorithm can be configured with a minimum m/z separation threshold (e.g., ≥2.0 Da) between the precursor and the product ion to avoid precursor-related artifacts. For applications requiring higher specificity, you can apply a more stringent post-processing filter (e.g., ≥7.0 Da) to the generated transition list [15].
Q5: What are the common pitfalls when validating AI-spline model predictions? Common pitfalls include:
- Using instrument data that is not comparable to the model's training data (e.g., different instrument types, resolution).
- Failing to verify fragment m/z agreement within a reasonable mass tolerance (e.g., ±0.5 Da).
- Not assessing the CE prediction error (ΔCE) against a small set of manually optimized standards to calibrate expectations [15].
Table 1: Key Performance Metrics for AI-Enhanced Spline CE Prediction
| Metric | Reported Performance | Validation Context |
|---|---|---|
| Spectral Identification Accuracy | 30% improvement in identifying challenging isomers [33] | Comparison against existing methods on a targeted isomer dataset. |
| Identification in Complex Samples | 42% more correct identifications [33] | Analysis in a biologically complex medium (NIST human plasma dilution series). |
| Analytical Sensitivity | Robust detection down to 1 nM concentration [15] | Validation across >100 authentic compounds. |
| Fragment m/z Agreement | Within ± 0.5 Da [15] | Benchmarking against experimental MRM transitions. |
Table 2: Comparison of Spectral Identification Methods
| Method | Key Principle | Advantages | Limitations |
|---|---|---|---|
| Cosine Similarity | Direct spectral comparison using cosine similarity [33]. | Simple, widely implemented, fast. | Performance degrades with spectral noise and library incompleteness. |
| DreaMS | Deep learning model for spectral embedding and retrieval [33]. | State-of-the-art performance prior to LSM-MS2. | Less effective for biological interpretation from minimal data. |
| LSM-MS2 (Foundation Model) | Transformer-based model trained on millions of spectra [33]. | Superior isomer identification, rich embeddings for biological interpretation. | Complex model architecture requiring significant computational resources. |
| AI-Enhanced Spline (This Work) | Spline fitting of CE profiles refined with supervised AI [15]. | Precise CE prediction, vendor-independent, derived from empirical data. | Requires data at multiple CEs; performance depends on training set diversity. |
Experimental Protocols
Protocol 1: Generating a CE Prediction Model from Sparse MS/MS Data
This protocol details the process of creating a collision energy prediction model using spline fitting and AI refinement, based on the methodology from the METLIN 960K MRM library [15].
1. Data Acquisition and Preprocessing
- Instrumentation: Collect high-resolution MS/MS spectra using Q-TOF, Orbitrap, or similar instruments.
- Data Collection: For each compound, acquire MS/MS spectra in both positive and negative ionization modes at four standardized collision energies: 0, 10, 20, and 40 eV [15].
- Spectral Processing:
- Convert raw vendor files to centroided data formats (e.g., .mzML) using tools like ProteoWizard.
- Apply noise reduction and baseline correction algorithms to clean the spectra.
2. Fragment Ion Tracking and Alignment
- Implement a dynamic fragment tracking algorithm with a mass tolerance of ±0.5 Da.
- Group recurring fragment ions across the four collision energies, requiring a fragment to be present in at least three of the four CE levels to be considered for modeling. This excludes in-source fragments and isotopic interferences [15].
- For each matched ion group, construct a collision energy-intensity profile, capturing the empirical change in fragment abundance.
3. Spline Fitting for Continuous CE Modeling
- For each fragment's CE-intensity profile, apply a univariate cubic spline fit (e.g., using the
splinespackage in R) to create a continuous curve. - The predicted optimal CE for a fragment is the value at which the spline curve reaches its maximum intensity. Clamp any predicted values below 5 eV to 5 eV, as this is the typical lower operational limit for triple-quadrupole instruments [15].
4. AI-Guided Model Refinement
- Use supervised regression models (e.g., RandomForestRegressor or GradientBoostingRegressor from scikit-learn in Python) to evaluate the relationship between empirical and spline-predicted CEs.
- The goal of this step is to identify the most robust spline-fitting conditions and to improve generalization across diverse chemical classes [15].
- Utilize hyperparameter optimization (HPO) platforms like Optuna to fine-tune the AI models for maximum accuracy and efficiency [32].
5. Transition Selection
- Rank all validated fragments by their relative intensity at the predicted optimal CE.
- Select the quantifier ion as the most intense and stable fragment.
- Select the qualifier ion as the next-most intense fragment that is also reproducible and meets a mass separation criterion (typically ≥2.0 Da from the precursor m/z) to ensure selectivity [15].
- Output the final transitions as precursor m/z → product m/z pairs with their associated predicted optimal CE values.
Protocol 2: Validating Predicted MRM Transitions
This protocol describes how to benchmark the transitions generated by the AI-spline model against experimental data [15].
1. Benchmark Set Creation
- Assemble a set of over 100 authentic chemical standards, encompassing the compound classes of interest (e.g., rare metabolites, diverse small molecules, potential contaminants).
- Manually develop and optimize MRM transitions for these standards on relevant triple-quadrupole mass spectrometers (e.g., from Agilent, Waters, Thermo, SCIEX).
2. Experimental Comparison
- Analyze the benchmark compounds at various concentrations (e.g., 1 μM and 1 nM) to assess sensitivity [15].
- Compare the model-predicted transitions and CEs to the experimentally optimized ones.
- Key Metrics:
- Fragment m/z agreement: The predicted product m/z should be within ±0.5 Da of the experimental fragment [15].
- CE prediction error (ΔCE): The difference between the predicted and experimentally determined optimal CE.
- Transition overlap: The degree to which the predicted quantifier/qualifier ions match the manually optimized set.
3. Performance Assessment in Complex Matrices
- Use a dilution series of a complex biological sample (e.g., NIST SRM 1950 human plasma) to evaluate the model's performance under realistic conditions with high background and ion suppression [33].
- Measure the number of correct identifications and the robustness of detection at low concentrations.
Workflow and System Diagrams
The Scientist's Toolkit: Research Reagent Solutions
Table 3: Essential Resources for AI-Spline CE Prediction Research
| Resource / Tool | Function / Description | Relevance to Research |
|---|---|---|
| METLIN 960K MRM Library | A massive library of empirically derived MRM transitions for nearly one million small molecules [15]. | Provides the foundational empirical MS/MS data required for training and validating spline and AI models. |
| Empirical MS/MS Data | Experimentally acquired tandem mass spectra of authenticated chemical standards at multiple CEs [15]. | The essential raw material for building CE-intensity profiles and training robust models. |
| AI BioSync (XCMS Enhancement) | A framework providing AI and machine-learning tools for deciphering spectral data [15]. | Offers the AI refinement layer for optimizing spline fitting across diverse chemical classes. |
| Scikit-learn / Python | A core library providing machine learning algorithms like RandomForest and GradientBoosting [15]. | Used to implement the supervised learning models for refining CE predictions. |
| Optuna (HPO Framework) | A Python platform for hyperparameter optimization, supporting algorithms like BOHB [32]. | Critical for maximizing the performance and efficiency of the AI components in the pipeline. |
| Garibaldi Computing Cluster | An example of a high-performance computing (HPC) environment [15]. | Enables large-scale computation needed for processing hundreds of thousands of compounds. |
| Foundation Models (e.g., LSM-MS2) | Large-scale deep learning models trained on millions of spectra to learn a semantic chemical space [33]. | Can be used to generate rich spectral embeddings that complement the spline-based CE prediction approach. |
FAQs: Core Concepts and Troubleshooting
Q1: Why is collision energy optimization critical for analyzing highly polar contaminants?
Collision Energy (CE) is a key parameter in MRM that determines the efficiency with which precursor ions fragment into specific product ions. Proper optimization significantly enhances the response intensity of the target product ions, which is crucial for achieving the high sensitivity and specificity required to detect trace-level polar contaminants in complex matrices like food and water [34]. Without optimized CE, methods may suffer from poor sensitivity, inadequate signal-to-noise ratios, and an inability to meet stringent detection limits set by regulatory bodies [35] [36].
Q2: What are the common sources of contamination and background interference in LC-MS/MS, and how can I mitigate them?
Background contamination can severely suppress analyte signals and interfere with detection. Common contaminants and their solutions include [37] [38]:
- Inorganic Clusters (e.g., Acetonitrile-Cu): Markers at m/z 145.0 and 147.0 cause ion suppression.
- Solution: Flush the HPLC system with a 10 mM EDTA solution in water (divert flow to waste) and use fresh, high-quality acetonitrile [37].
- Polyethylene Glycols (PEGs): Appear as a series of ions 22 or 44 m/z apart (e.g., 173.1, 217.1). They cause high background and ion suppression.
- Solution: Identify and remove the source, which can be solvents, plasticware, or even some LC column packing material. Flush the aqueous flow path with a modifier-free aqueous mobile phase at a high temperature (e.g., 100°C) [37].
- Triton Detergents: A marker ion is often seen at m/z 293.2.
- Solution: Wash glassware without detergent and dry in a muffle furnace [37].
- General Best Practices:
- Always wear nitrile gloves when handling solvents, samples, and instrument components [38].
- Use dedicated, detergent-free solvent bottles for LC-MS and avoid refilling mobile phase bottles; instead, empty and fill them frequently [38].
- Use LC-MS grade additives and solvents from a trusted source [38].
Q3: My method lacks sensitivity for a highly polar pesticide. What steps should I take?
- Review Sample Cleanup: For highly polar compounds, traditional reversed-phase separation and cleanup may not be sufficient. Consider using ion chromatography (IC) for separation and implementing specific sample clean-up steps, such as precipitation cartridges to remove interfering inorganic ions (e.g., chloride, sulfate) [39].
- Re-optimize MS Parameters: Systematically re-optimize the fragmentor voltage and collision energy for your target analyte, as even small deviations can significantly impact sensitivity [34].
- Reduce Matrix Effects: Employ advanced sample preparation techniques. For water analysis, using response surface methodology (RSM) to optimize Solid-Phase Extraction (SPE) parameters (sample pH, volume, eluent) can significantly improve extraction efficiency and reduce matrix effects [35].
- Consider Sample Enrichment: For ultratrace analysis, techniques like vacuum-assisted evaporative concentration can lower your limits of quantification [39].
Troubleshooting Guide: Common Pitfalls and Solutions
| Problem Area | Specific Symptom | Potential Cause | Recommended Solution |
|---|---|---|---|
| Ionization & Signal | Severe ion suppression, no analyte signal. | Co-eluting matrix components or mobile phase contaminants [38]. | - Use isotope-labeled internal standards.- Improve chromatographic separation.- Change mobile phase additive source [38]. |
| MRM Sensitivity | Low signal for quantifier ion. | Suboptimal collision energy (CE) [34]. | Perform a CE optimization experiment, testing a range of energies (e.g., in 2-5 eV increments) to find the maximum response for your product ion [34]. |
| Chromatography | Poorly resolved, broad, or tailing peaks for polar analytes. | Inappropriate chromatographic mode for highly polar compounds [39]. | Switch from reversed-phase LC to Ion Chromatography (IC) for a better retention and separation of ionic, highly polar substances [39]. |
| Sample Preparation | Low recovery during SPE for multi-residue analysis. | Non-optimized SPE conditions (pH, sorbent, eluent) for the diverse compound list [35]. | Use a structured optimization approach like Response Surface Methodology (RSM) to find the ideal compromise for all target analytes [35]. |
| Background Noise | High baseline in blank injections, specific ion clusters (e.g., m/z 145, PEGs). | Contaminated solvents, glassware, or instrument flow path [37]. | - Run a solvent blank to isolate the source.- Follow cleaning procedures (EDTA flush for inorganics, hot water flush for PEGs).- Use LC-MS grade solvents and wear gloves [37] [38]. |
Optimizing Collision Energy: A Detailed Experimental Protocol
This protocol is essential for developing a sensitive and robust MRM method within a thesis focused on contaminant analysis.
Objective: To determine the optimal collision energy for fragmenting a precursor ion into its most abundant and stable product ion for MRM quantification.
Materials:
- Pure analytical standard of the target contaminant.
- LC-MS/MS system with MRM capability.
- Appropriate solvents for diluting the standard.
Methodology:
- Standard Preparation: Dilute the pure chemical standard to a concentration within the instrument's linear dynamic range (e.g., 50 ppb to 2 ppm) using a solvent compatible with your prospective mobile phase [2].
- Precursor and Product Ion Identification: Directly infuse the standard solution into the mass spectrometer. Using a product ion scan mode, fragment the precursor ion (e.g.,
[M+H]+) with a medium collision energy to identify characteristic product ions. Select at least two abundant and specific ions: one as the quantifier (for concentration calculation) and one as the qualifier (for confirmatory identity) [2] [34]. - Collision Energy Optimization:
- In the MRM method editor, create transitions for your chosen precursor-to-product ion pairs.
- For each transition, set up a series of experiments where the collision energy is varied across a defined range. A typical range is 24–32 eV with 2 eV increments [34].
- Inject the standard solution and acquire data for all CE steps.
- Data Analysis:
- Plot the peak area or abundance of the product ion against the collision energy for each transition.
- Identify the collision energy value that produces the maximum stable response for each product ion. This is the optimized CE for that specific MRM transition [34].
Collision Energy Optimization Data Example
The table below illustrates the type of data generated during CE optimization, using Aflatoxin B1 as an example.
| Analyte | Precursor Ion (m/z) | Product Ion (m/z) | Optimized Collision Energy (eV) | Purpose |
|---|---|---|---|---|
| Aflatoxin B1 [34] | 313.2 | 285.1 | 24 | Quantification |
| Aflatoxin B1 [34] | 313.2 | 241.1 | 32 | Qualification/Confirmation |
| Your Contaminant | [M+H]+/[M-H]- | Daughter Ion | XX | Quantification |
| Your Contaminant | [M+H]+/[M-H]- | Daughter Ion | YY | Qualification/Confirmation |
The Scientist's Toolkit: Essential Research Reagents & Materials
The following reagents and materials are fundamental for developing and running robust methods for highly polar contaminant analysis.
| Item | Function/Benefit | Application Note |
|---|---|---|
| LC-MS Grade Solvents & Additives | Minimize background contamination and ion suppression. Critical for high-sensitivity work [38]. | Use dedicated bottles. Avoid plastic containers for acids like formic acid [38]. |
| Ion Chromatography (IC) System | Separates highly polar and ionic compounds that are not retained by standard reversed-phase LC [39]. | Essential for pesticides like glufosinate, chlorate, and many transformation products [39] [36]. |
| High-Resolution Mass Spectrometer (e.g., Q-Orbitrap) | Provides accurate mass for confirmatory identification and non-targeted screening of unknown polar compounds [39] [36]. | |
| Mixed-Mode or HILIC SPE Sorbents | Retain highly polar analytes through mechanisms other than just reversed-phase (e.g., ion-exchange) [35]. | Crucial for extracting a wide range of micropollutants from water [35]. |
| Ba/Ag/H Cartridges | Remove interfering inorganic anions (e.g., chloride, sulfate) via precipitation to reduce matrix effects in IC-HRMS [39]. | Sample clean-up step before injection for complex matrices like groundwater [39]. |
| QuEChERS Extraction Kits | Provide a quick, easy, and effective sample preparation for complex food matrices [25]. | Must be optimized for the specific matrix (e.g., adjusting solvent-to-sample ratio for high-fat insects) [25]. |
Solving Common CE Optimization Challenges in Complex Matrices
In targeted mass spectrometry, specifically in Multiple Reaction Monitoring (MRM) experiments, the intensity of fragment ion signals is paramount for achieving high-sensitivity detection and reliable quantification. Low fragment ion intensity can severely compromise data quality, leading to poor limits of detection and quantification. Within the context of optimizing MRM pairs for contaminant analysis, two of the most critical and directly controllable instrumental parameters are Collision Energy (CE) and dwell time. This guide provides a systematic approach to diagnosing and correcting low intensity by optimizing these key parameters.
FAQ: Fundamental Concepts
Q1: What is the relationship between Collision Energy and fragment ion intensity?
Collision Energy (CE) is the voltage applied in the collision cell to accelerate precursor ions and cause fragmentation through collisions with gas molecules. If the CE is too low, the precursor ion will not fragment efficiently, leading to weak fragment ion signals. If the CE is too high, the precursor and its product ions may undergo further fragmentation into non-detectable smaller species or be scattered away, also reducing the target fragment signal [40]. The optimal CE is thus a balance that produces the maximum yield of your specific fragment ion.
Q2: How does dwell time affect my MRM data?
Dwell time is the time the mass spectrometer spends monitoring a specific transition [7]. A longer dwell time allows the instrument to collect more signal for that transition, improving the signal-to-noise ratio [41]. However, the total duty cycle (the time to monitor all transitions in a method) is fixed. Therefore, an excessively long dwell time for one transition reduces the time available for others, potentially resulting in too few data points collected across a chromatographic peak for reliable quantification [7]. The goal is to find a dwell time that provides sufficient signal-to-noise while still acquiring enough data points per peak.
Q3: Can the peptide sequence itself cause low fragment ion intensity?
Yes, the chemical properties of the peptide significantly influence fragmentation efficiency. The mobile proton theory explains that peptides with a high number of basic residues (arginine, lysine, histidine) or those classified as "non-mobile" often exhibit lower overall fragment ion intensities [42]. Furthermore, the presence of specific amino acids near the fragmentation site can enhance or suppress intensity; for instance, a proline residue proximal to the cleavage site can enhance fragmentation, while basic residues at the fragmentation site are associated with lower intensity [42].
Troubleshooting Guide: A Step-by-Step Workflow
Follow the workflow below to systematically diagnose and resolve low fragment ion intensity. It begins with a fundamental check of your transition design and proceeds through the optimization of CE and dwell time.
Step 1: Verify and Select Optimal Transitions
Before adjusting instrument parameters, ensure your MRM transition is well-designed.
- Select Prototypic Peptides: Choose peptides that are unique to your analyte and are readily detectable by LC-MS. Ideally, they should be 5-25 amino acids long with no missed cleavages or chemically unstable residues (e.g., M, N-terminal Q, N, Q) [7].
- Choose High-Intensity Fragment Ions: Preferentially select y-ions with higher mass-to-charge (m/z) ratios, as the low m/z region is often crowded with chemical noise. b-ions are often of low abundance in triple quadrupole instruments [7]. For small molecules, select a abundant, specific product ion.
Step 2: Optimize Collision Energy (CE)
This is the most critical step for increasing fragment ion signal. The following table provides a foundation for CE optimization, based on established equations [7].
Table 1: Base Collision Energy (CE) Equations for Different Instrument Types
| Instrument Model | Peptide Charge State | Collision Energy (CE) Equation |
|---|---|---|
| TSQ Quantiva | 2+ | CE = 0.0339 × (m/z) + 2.3597 |
| TSQ Quantiva | 3+ | CE = 0.0295 × (m/z) + 1.5123 |
| TSQ Altis (1.5 mTorr) | 2+ | CE = 0.034 × (m/z) + 2.2835 |
| TSQ Altis (1.5 mTorr) | 3+ | CE = 0.0295 × (m/z) + 1.4831 |
| TSQ Vantage (1.5 mTorr) | 2+ | CE = 0.030 × (m/z) + 2.905 |
Experimental Protocol: CE-Breakdown Curves
For a rigorous, data-driven optimization, generate a CE-breakdown curve [40]. This method is superior to a simple stepwise optimization as it visualizes the full response profile.
- Create an MRM Method: For your precursor ion and its most abundant fragment, create a series of identical transitions.
- Code CE Values: Use a script or manual entry to assign a range of CE values to these transitions. A common strategy is to test values from -6 V to +6 V around the value predicted by the equation in Table 1 [11]. To run these in a single injection, subtly adjust the precursor and product ion m/z values in the hundredth decimal place to make each transition unique to the instrument software [11].
- Acquire Data: Inject your analyte and acquire data for the full set of transitions.
- Plot and Analyze: Plot the measured fragment ion intensity (or area) against the applied collision energy. The optimal CE is the value at the peak of this curve [40].
Step 3: Optimize Dwell Time
Once CE is optimized, fine-tune dwell time to balance sensitivity and chromatographic fidelity.
Table 2: Dwell Time Guidance and Calculations
| Parameter | Recommended Value | Impact & Consideration |
|---|---|---|
| Minimum Dwell Time | ~10-20 ms [7] [43] | Shorter times reduce signal-to-noise (S/N). |
| Target Data Points per Peak | 10-15 points [7] | Essential for reliable peak integration and quantification. |
| Duty Cycle Calculation | Duty Cycle = Σ (Dwell Times for all transitions) | Must be short enough to cycle through all transitions and achieve target data points. |
Experimental Protocol: Dwell Time Adjustment
- Calculate Your Current Duty Cycle: Sum the dwell times for all transitions in a given retention time window.
- Estimate Peak Width: Determine the average width (in seconds) of a chromatographic peak in your method.
- Check Data Point Sufficiency: Divide your peak width by the duty cycle. If the result is less than ~10 points per peak, you have too few data points [7].
- Adjust Dwell Time:
- If S/N is low and data points are sufficient, increase the dwell time for the problematic transition(s) to a maximum of ~100 ms [7].
- If data points are insufficient, you must reduce dwell times across all transitions or implement scheduled MRM to monitor fewer transitions in specific time windows, allowing for longer dwell times without sacrificing data points.
The Scientist's Toolkit: Essential Research Reagents & Materials
Table 3: Key Materials for MRM Assay Development
| Item | Function in the Experiment |
|---|---|
| Standard Protein or Analyte Mixture | A well-characterized sample used for initial method development and optimization, free from complex matrix interferences [11]. |
| Stable Isotope-Labeled (SIL) Internal Standards | Chemically identical, heavy-isotope-containing versions of the target analytes. They correct for sample loss, ionization efficiency variations, and matrix effects [40]. |
| Trypsin (Sequencing Grade) | High-purity enzyme used to digest proteins into peptides for bottom-up proteomics analysis. Its specificity ensures predictable cleavage sites [7]. |
| Anionic Surfactant (e.g., sodium deoxycholate) | Aids in protein denaturation and solubilization during digestion, improving digestion efficiency and peptide yield. Must be acid-labile for easy removal before LC-MS [44]. |
| Mobile Phase Additives (LC-MS Grade) | High-purity solvents and additives like formic acid and acetonitrile are essential for stable electrospray ionization and high-resolution chromatographic separation [44]. |
Advanced Considerations
- Proton Mobility: Be aware that peptides with limited proton mobility (e.g., those with multiple basic residues) often generate lower overall fragment ion intensities, which may require more extensive optimization [42].
- Scheduled MRM: This powerful technique dramatically improves data quality. By specifying an expected retention time for each transition, the instrument only monitors transitions when their analytes are expected to elute. This reduces the number of concurrent transitions, allowing for longer dwell times and more data points across the peak without compromising method scope [7].
- High-Resolution MRM: On instruments like Q-TOFs, the "MRM-HR" mode collects full, high-resolution product ion scans. This provides superior selectivity by distinguishing your target fragment from isobaric interferences, which can sometimes be mistaken for low intensity [43].
Addressing Matrix Effects and Ion Suppression Through Robust CE Selection
FAQs: Understanding Matrix Effects, Ion Suppression, and CE Optimization
Q1: What are matrix effects and ion suppression, and how do they impact my MRM results? Matrix effects occur when co-eluting compounds from the sample matrix interfere with the ionization of your target analyte in the mass spectrometer source. This often manifests as ion suppression, where the interfering compounds reduce the analyte's signal, leading to diminished response, inaccurate quantification, and poor reproducibility. The impact is significant because it can reduce assay accuracy by as much as 26% [45]. In MRM analysis, this means your calibration curves may be unreliable, and quantitative results for contaminants or drugs in complex samples could be significantly underestimated.
Q2: How can collision energy (CE) optimization help mitigate these issues? Optimizing CE enhances the selectivity and robustness of your MRM method. A well-optimized CE value ensures your monitored transition produces a strong, specific signal from the analyte of interest. This specificity makes the measurement less susceptible to interference from background matrix ions that may have similar precursor masses but different fragmentation patterns. Using optimal CE values maximizes the signal for your chosen product ions, improving the signal-to-noise ratio and making the quantification more reliable even in the presence of matrix components [2] [11].
Q3: Why is it critical to have a stable isotope-labeled (SIL) internal standard co-elute perfectly with my analyte? A stable isotope-labeled (SIL) internal standard is designed to have nearly identical physicochemical properties to the analyte. When it completely co-elutes with the analyte, it experiences the same matrix effects at the exact same moment in the chromatographic run. This allows it to correctly compensate for the ion suppression or enhancement. If the peaks do not fully overlap, the internal standard and analyte will be exposed to different micro-environments of the matrix, leading to incorrect correction and a large scatter in the data [45].
Q4: Beyond CE, what other key parameters should be optimized for a robust MRM method? While CE is crucial, a holistic approach to method development is necessary. Other key parameters to optimize include:
- Declustering Potential (DP): Optimizing this voltage helps minimize solvent clusters and can reduce unwanted in-source fragmentation [17].
- Chromatographic Separation: Improving LC separation to resolve the analyte from matrix interferents is the first line of defense against matrix effects [2].
- Cone Voltage: This parameter focuses on the transmission of the precursor ion and may require compound-specific optimization for maximum response [11].
Q5: Are there automated tools available to help with CE and other parameter optimizations? Yes, modern software platforms often include automated optimization tools. For instance, the MRM Optimization tool in waters_connect for Quantitation Software is designed to automatically evaluate multiple precursor and product ion combinations across various charge states and profile both cone voltage and collision energy. This is particularly beneficial for molecules like peptides that can form multiple charge states, simplifying a otherwise complex and time-consuming process [46].
Troubleshooting Guides
Problem: Inconsistent Calibration Curve and Poor Precision
Symptoms: High variability in replicate samples, poor linearity in calibration curves, and inaccurate quantification of target contaminants.
Potential Causes and Solutions:
| Cause | Diagnostic Steps | Solution |
|---|---|---|
| Incomplete co-elution of analyte and SIL internal standard | Overlay the extracted ion chromatograms (XICs) for the analyte and its SIL internal standard. Check if the retention times match exactly and the peak shapes overlap perfectly. | Use a chromatographic column with different selectivity (e.g., HILIC instead of C18) or adjust the mobile phase gradient to achieve complete peak overlap [45]. |
| Sub-optimal Collision Energy | Inject a standard and create a CE ramp around the theoretical value (e.g., ± 6 eV). Plot the peak area for the transition against the CE to find the maximum response. | Use the rapid optimization strategy of creating multiple MRM targets with subtly different Q1/Q3 m/z values to test different CEs in a single run [11]. |
| Significant Residual Matrix Effects | Perform a post-column infusion experiment to visualize areas of ion suppression/enhancement across the chromatographic run. | Improve sample clean-up and enhance chromatographic separation to move the analyte's retention time away from the suppression zone [45]. |
Problem: Low Signal-to-Noise for Key MRM Transitions
Symptoms: The primary quantitative transition for your contaminant has a weak signal, making it difficult to achieve a low limit of quantification.
Potential Causes and Solutions:
| Cause | Diagnostic Steps | Solution |
|---|---|---|
| CE is too high or too low | Perform a product ion scan at different collision energies to map the intensity of all fragments. The optimal CE provides the most intense signal for your selected product ion without causing over-fragmentation. | Systematically optimize the CE for at least two MRM transitions per analyte to ensure you have a sensitive quantitative ion and a confirmatory ion [2]. |
| Ion Source Contamination | Check for a drop in sensitivity for other established methods running on the same instrument. | Increase the curtain gas (CUR) setting to help keep the source clean and perform routine source cleaning [17]. |
Experimental Protocols
Detailed Methodology: Rapid MRM Parameter Optimization viam/zReprogramming
This protocol describes a efficient strategy for simultaneously optimizing collision energy (CE) and cone voltage (CV) for multiple MRM transitions in a single LC-MS run, avoiding run-to-run variability [11].
1. Reagents and Materials:
- ISB Standard Protein Mixture: A digest of a known protein mixture can be used as a model system.
- Solvents: HPLC-grade water, acetonitrile, and methanol with 0.1% formic acid.
- Instrumentation: A triple quadrupole mass spectrometer (e.g., Waters Quattro Premier, ABI 4000 QTRAP).
2. Step-by-Step Procedure:
- Step 1: Transition List Generation. Start with a list of your target MRM transitions, including precursor ion (m/z), product ion (m/z), and an initial CE calculated from a general equation (e.g., CE = 0.034 × (precursor m/z) + 1.314 for a Waters instrument) [11].
- Step 2: List Expansion. Use a script to expand the list. For each original transition, create multiple new entries that correspond to different CE (or CV) values. For example, create 7 versions of one transition, with CE values ranging from -6 eV to +6 eV of the default value in 2 eV steps [11].
- Step 3: m/z Adjustment. To make the instrument recognize these as unique transitions, the script subtly adjusts the precursor and product m/z values at the hundredth decimal place. The second decimal of the Q1 m/z is used to code for the transition, and the second decimal of the Q3 m/z is used to code for the collision energy. The appropriate CE is then programmed for each unique pair [11].
- Step 4: Data Acquisition. Inject the standard sample and run the LC-MS method with this expanded MRM list. The instrument will cycle through all the "different" transitions, effectively testing multiple CEs for your original transition in one go.
- Step 5: Data Analysis. Analyze the resulting data using MRM software. The peak area for each transition (each unique m/z pair) is plotted against its corresponding CE value. The CE that yields the maximum peak area is identified as the optimal value for that specific transition.
Workflow Diagram: MRM Optimization to Combat Matrix Effects
The diagram below illustrates the logical workflow for developing a robust MRM method that is resilient to matrix effects.
Key Research Reagent Solutions
The following table details essential materials and reagents used in developing robust MRM methods, as featured in the cited experiments.
Table: Essential Research Reagents for MRM Method Development
| Reagent / Material | Function in the Context of CE Optimization & Matrix Effects | Example from Literature |
|---|---|---|
| Stable Isotope-Labeled (SIL) Internal Standards | Corrects for variable ion suppression/enhancement during MS analysis. Must co-elute perfectly with the analyte for accurate correction. | Used to correct for matrix effects in the analysis of antimicrobial drugs; critical when analyte and ISTD did not fully co-elute [45]. |
| Well-Characterized Standard Mixture | Provides a consistent sample for systematic optimization of instrument parameters like CE and CV without matrix interference. | A mixture of 18 standard proteins (ISB mix) was used to develop and demonstrate the rapid CE optimization workflow [11]. |
| Acidified Mobile Phase Additives | Promotes protonation and improves ionization efficiency in positive ESI mode, which can influence optimal CE and overall signal strength. | 0.1% formic acid in both water and acetonitrile was used as mobile phase for the separation of peptides and drugs [45] [46]. |
| Reference Glycoprotein Standards | Complex model analytes used to study and optimize CE for specific challenging molecule classes, like glycopeptides. | α-1 acid glycoprotein (AGP), fetuin, and transferrin were used to map optimal CE for a diverse set of N-glycopeptides [47]. |
Data Presentation: Comparison of MRM Optimization Techniques
The table below summarizes different experimental approaches to CE optimization, highlighting their key features and applicability.
Table: Comparison of MRM Collision Energy Optimization Methods
| Optimization Method | Key Principle | Advantages | Best Suited For |
|---|---|---|---|
| Rapid m/z Reprogramming [11] | Subtly adjusts Q1/Q3 m/z to test multiple CEs in a single run. | High efficiency; avoids run-to-run variability; ideal for large transition lists. | High-throughput labs optimizing many compounds simultaneously. |
| Software-Assisted Automation [46] | Uses instrument software to automatically profile CE for precursor-product pairs. | User-friendly; reduces manual labor and transcription errors; handles multiple charge states well. | Biomolecules (peptides, oligonucleotides) and complex method development. |
| Stepped Collision Energy [47] | Fragments ions at multiple, fixed CE values within a single MS/MS scan. | Captures different fragment types in one spectrum; improves confidence for complex analytes. | Glycopeptide analysis and other analytes with complex fragmentation pathways. |
| Traditional Direct Infusion [2] [17] | Manually infusing standard and tuning parameters while observing signal response. | Direct control; good for fundamental understanding and troubleshooting. | Initial method scoping and labs without access to advanced automation. |
Optimizing for Different Charge States and Atypical Peptides or Molecules
Troubleshooting Guides
Guide 1: Addressing Poor MRM Sensitivity for Atypical Peptides
Problem: Low signal intensity for peptides with missed cleavages, non-tryptic termini, or unusual residue composition, despite using generalized instrument parameters.
Background: Generalized collision energy (CE) equations are typically optimized for standard tryptic peptides. Atypical peptides often have different fragmentation efficiencies and may require instrument parameters that deviate significantly from these standard values [11].
Investigation Steps:
- Verify Method Parameters: Confirm that the initial method uses the vendor-recommended CE calculation. A typical default for a triple quadrupole might be
CE = 0.034 × (precursor m/z) + 1.314for doubly charged peptides [11]. - Check for Signal Saturation: Visually inspect the chromatogram for overloading, which can cause peak broadening and a loss of sensitivity. Dilute the sample and re-inject to see if signal-to-noise improves.
- Confirm Specificity: Ensure the signal is from the target analyte and not a co-eluting interference by checking ion ratios.
- Verify Method Parameters: Confirm that the initial method uses the vendor-recommended CE calculation. A typical default for a triple quadrupole might be
Solution: Implement an automated or systematic optimization of collision energy and cone voltage for each individual MRM transition. Modern software can automate this process [48]. Alternatively, a manual approach can be used:
- Create a method that tests a range of CE values (e.g., ±6 V from the calculated value in 2 V steps) for each transition [11].
- To perform this in a single run without run-to-run variability, program the instrument by using the hundredth decimal place of the precursor and product ion m/z values to code for different collision energies [11].
- Analyze the results to identify the CE that produces the maximum signal intensity for each transition.
Preventive Measure: Always perform transition-specific optimization for quantitative assays, especially when working with non-tryptic peptides, peptides with post-translational modifications, or small molecules with atypical fragmentation patterns.
Guide 2: Resolving Signal Instability and Drift During Batch Analysis
Problem: A noticeable loss of signal for calibrators and quality control samples over the course of a single analytical batch, affecting quantitation accuracy.
Background: Signal drift can be caused by several factors, including ion source contamination, suboptimal chromatography, or non-specific adsorption of analytes to container surfaces [49].
Investigation Steps:
- Inspect Ion Source: Check for contamination and clean the source components if necessary according to the manufacturer's guidelines.
- Review System Suitability Data: Analyze the data from system suitability tests (SSTs) injected at the beginning and end of the batch to quantify the degree of drift.
- Evaluate Sample Preparation: Consider if non-specific adsorption is a factor, particularly for lipidic or hydrophobic analytes like sulfatides. This can be tested by performing sequential transfer and freeze-thaw experiments to monitor analyte loss [49].
Solution: A multi-pronged approach is often required:
- Chromatography: For unstable responses, especially with lipid molecules, changing the LC column chemistry can be critical. For instance, switching from a C18 to a C8 column has been shown to stabilize the response for sulfatides across hundreds of injections [49].
- Sample Handling: If non-specific adsorption is identified, add a blocking agent to the sample collection containers or preparation tubes. Bovine Serum Albumin (BSA) or hexadecylpyridinium chloride monohydrate (HDP) can be evaluated for this purpose [49].
- Assay Configuration: If signal loss is consistent and predictable, and the internal standard corrects for it, it may be acceptable. However, for greater robustness, consider moving the assay to a dedicated mass spectrometer or implementing more frequent system conditioning injections [49].
Preventive Measure: Establish and monitor strict system suitability criteria. Pre-treat sample containers with suitable blocking agents for problematic analytes, and validate column chemistry for long-term stability.
Guide 3: Managing Isobaric Interference in Complex Matrices
Problem: A potential false-positive identification or inaccurate quantification due to an interfering compound that shares the same precursor ion mass and retention time as the target analyte.
Background: In complex samples like urine or environmental extracts, isobaric compounds can co-elute with the target, leading to interference that is not flagged by standard ion ratio checks if the interference produces the same qualifier ions [49].
Investigation Steps:
- Review Clinical/Contextual Data: Flag results that are inconsistent with other data (e.g., a metabolite is detected without its parent drug in a patient sample) [49].
- Confirm with an Alternative Method: Analyze the sample using a different analytical technique (e.g., a different LC method or mass spectrometer) to confirm the result [49].
- Investigate Fragmentation: Perform a product ion scan on the sample to look for fragment ions unique to the true analyte that are not present in the interference.
Solution: Improve the specificity of the MRM method:
- Develop a Unique Transition: Investigate the full fragmentation spectrum of the authentic standard to identify a product ion that is exclusive to the target compound. For example, in a case of noroxycodone interference, a new qualifier transition (
302.1384 → 284.1000) was found to be specific to the true analyte and absent in the interfering signal [49]. - Chromatographic Resolution: Modify the LC method (gradient, column temperature, or mobile phase) to achieve baseline separation of the target from the interfering compound.
- Enhanced Data Review: Implement rules-based algorithms or AI-based tools in the data processing middleware to automatically flag samples that show a discrepancy between the primary and unique confirmatory transitions [49].
- Develop a Unique Transition: Investigate the full fragmentation spectrum of the authentic standard to identify a product ion that is exclusive to the target compound. For example, in a case of noroxycodone interference, a new qualifier transition (
Preventive Measure: During method development, always test for specificity in the intended matrix by analyzing blank samples from multiple sources. Incorporate at least one highly specific MRM transition for definitive identification.
Frequently Asked Questions (FAQs)
FAQ 1: Why can't I use a generalized collision energy equation for all my MRM transitions?
Generalized equations are based on average fragmentation behavior of common peptides (e.g., tryptic, doubly charged) and assume consistent proton mobility. Atypical peptides—such as those with missed cleavages, non-tryptic termini, or unusual residue content—often have different fragmentation efficiencies and proton mobilities. This means the energy required for optimal fragmentation can be significantly higher or lower than the calculated value, making individual optimization essential for maximum sensitivity [11].
FAQ 2: What is the most efficient way to optimize collision energy for dozens of MRM transitions?
Automated software tools are the most efficient. For instance, the MS Optimization tool in waters_connect for Quantitation Software can automatically run through the process of precursor ion detection, cone voltage optimization, product ion discovery, and collision energy evaluation for multiple analytes [48]. A manual but highly efficient alternative is to program a single run that tests multiple CE values for each transition by slightly adjusting the precursor and product m/z values in the hundredth decimal place. This allows you to test a range of energies for all transitions in one experiment without run-to-run variability [11].
FAQ 3: My lipid analyte's response is unstable across many injections, even with an internal standard. What could be wrong?
The problem may lie with the liquid chromatography column chemistry, not the mass spectrometer. Some lipid classes, like sulfatides, have shown unstable response on C18 columns, with signal increasing by 15-40% after many injections. This issue may not be corrected by the internal standard. A proven solution is to switch to a different column chemistry, such as a BEH C8 column, which has demonstrated stable response for over 200 injections for these compounds [49].
FAQ 4: How can I prevent false positives from isobaric interferences in complex samples like urine?
Relying on a single MRM transition is risky. The best strategy is to use multiple MRM transitions and, crucially, to invest time in finding a highly specific qualifier transition that is unique to your target molecule and not produced by common interferences. This transition should be identified during method development and validated with real-world blank matrices. Furthermore, using rules-based or AI-powered data review can help automatically flag results where the specific qualifier ion is absent [49].
Experimental Data and Protocols
Table 1: MRM Transition Optimization Data for Atypical Molecules
The following data illustrates how optimal instrument parameters can vary from generalized equations.
| Analyte Type | Precursor m/z | Default CE (V) | Optimized CE (V) | Signal Gain (%) | Key Finding |
|---|---|---|---|---|---|
| Gefitinib-based PROTAC [48] | 934.5 | Vendor Calculation | 30 (for 934.3→617.2) | ~200% vs. other transitions | Different optimal CE for each product ion. |
| Triply Charged Peptide (TPHPALTEAK) [11] | 355.53 | 13.4 | 17.4 (for y4 ion) | Significant* | Optimal CE was 4V higher than default. |
| Noroxycodone (New Qualifier) [49] | 302.1384 | N/A | Specific to 302.1→284.1 | N/A | This unique transition eliminated isobaric interference. |
*The original study demonstrated that optimal values frequently deviated from the equation, maximizing individual transition sensitivity [11].
Table 2: Key Research Reagent Solutions for MRM Optimization
Essential materials and their functions for developing and troubleshooting MRM methods.
| Reagent / Material | Function / Application | Key Consideration |
|---|---|---|
| BEH C8 Chromatography Column [49] | Provides stable retention and response for challenging lipids like sulfatides. | Superior stability for lipid analysis compared to C18 columns in specific applications. |
| Isotope-Labeled Internal Standards | Corrects for sample prep losses, matrix effects, and instrument variability. | Not always sufficient to correct for column-related response instability [49]. |
| Blocking Agents (e.g., BSA, HDP) | Reduce non-specific adsorption of analytes to container walls [49]. | Critical for low-concentration analytes in low-protein matrices like urine and CSF. |
| Kura BGTurbo Enzyme [49] | Hydrolyzes conjugated metabolites (e.g., glucuronides) in urine prior to LC-MS/MS analysis. | Essential for comprehensive urine drug testing. |
| Waters_connect for Quantitation Software [48] | Automates MRM transition optimization (precursor/product ion selection, CV, CE). | Streamlines method development and reduces transcription error. |
Detailed Protocol: Automated MRM Optimization Using waters_connect Software
This protocol is adapted from an application note for high-sensitivity quantification of drugs and metabolites [48].
- Sample Preparation: Prepare a standard solution of the analyte (e.g., 100 ng/mL) in a compatible solvent such as 50:50 methanol: 0.1% aqueous acid.
- Initial Source Tuning: Infuse the sample directly into the mass spectrometer ion source. Optimize source-dependent parameters (e.g., capillary voltage, source temperature, and gas flows) by monitoring the precursor ion signal.
- Automated MRM Optimization:
- In the software, select the "Optimization" function and add a new analyte.
- Input the analyte name and molecular formula or mass.
- Select the polarity (positive/negative) and expected adducts (e.g., [M+H]⁺).
- Choose the sample introduction mode (e.g., infusion or LC introduction).
- Start the automated optimization process. The software will iteratively: a. Confirm the precursor ion. b. Optimize the cone voltage. c. Generate product ions. d. Optimize the collision energy for each potential MRM transition.
- Data Review: Use the interactive graphical interface to review the results. Examine the cone voltage profile and the product ion spectra at different collision energies to select the most intense and specific transitions.
- Method Transfer: Directly transfer the optimized MRM transitions and parameters from the optimization tool to the LC-MS acquisition method editor to eliminate transcription errors.
Workflow Diagrams
Diagram 1: Automated MRM Optimization Workflow
Diagram 2: Troubleshooting Signal Instability
FAQ: Tuning and Optimization
Q1: What is the fundamental difference in tuning goals for a Triple Quadrupole (QqQ) versus a Hybrid (e.g., Q-TOF) system for MRM methods?
The fundamental tuning goal for a Triple Quadrupole (QqQ) in MRM mode is to maximize sensitivity and signal-to-noise for specific, pre-defined ion transitions to achieve accurate quantification, often at the expense of full-scan spectral information. In contrast, tuning a Hybrid System (like a Q-TOF) for MRM seeks to balance quantitative sensitivity with the ability to perform high-resolution, accurate mass (HRAM) confirmation of product ions, enabling confident analyte identification and non-targeted screening. The QqQ excels at monitoring the most abundant, characteristic fragment ions with high duty cycle, while the Q-TOF aims to provide a full, high-resolution product ion spectrum for each precursor. [50] [51] [52]
Q2: I am observing inconsistent MRM signals on my QqQ system. What are the key instrument parameters I should investigate?
Inconsistent MRM signals on a QqQ system often relate to source contamination, gas flow stability, or MRM timing parameters. Key areas to investigate include:
- Ion Source Contamination: Check for and clean common contaminants like polyethylene glycol (PEG) clusters or inorganic clusters (e.g., acetonitrile-Cu), which can cause signal suppression and instability. [37]
- Nebulizer Gas and Drift: Verify that the nebulizer gas pressure is stable and that you are not receiving errors such as "nebulizer % drive is out of range," which can indicate a plugged line or gas leak. [37]
- Dwell Time and Cycle Time: Optimize the dwell time (the time spent monitoring each MRM transition) and cycle time (the total time to monitor all MRMs in a cycle). A dwell time that is too short can reduce sensitivity, while a long dwell time in a method with many transitions can lead to an excessively long cycle time and too few data points across a chromatographic peak. Aim for 12-20 data points per peak. [10]
Q3: When transitioning a method from a QqQ to a Q-TOF, why might my optimized collision energies need re-evaluation?
While the fundamental fragmentation pathways may be similar, the optimal collision energy (CE) often differs between QqQ and Q-TOF instruments due to fundamental design differences. The collision cells operate at different pressures and with different geometries, leading to varying numbers of collisions and energy transfer efficiencies. Therefore, a CE optimized on a QqQ will not be directly transferable to a Q-TOF and must be re-optimized experimentally on the specific hybrid instrument to achieve optimal fragmentation and sensitivity. [50] [53]
Q4: My Q-TOF data shows high background in the solvent blank. How can I identify the source?
Running a solvent blank scan (MS2 scan with no injection) is a critical first step. Compare the high-resolution accurate masses of the background ions to common contaminant libraries. Key suspects include:
- Inorganic Clusters: Look for markers like m/z 145.0 and 147.0 for acetonitrile-Cu clusters. [37]
- Polyethylene Glycols (PEG): Identified by a series of ions 44 m/z apart (e.g., m/z 173.1, 217.1). [37]
- Detergents (Triton): Markers include m/z 293.2. [37] Systematically isolate potential sources by changing solvents and bypassing different modules of the LC system (e.g., autosampler, column) to pinpoint the contamination origin. [37]
Troubleshooting Guides
Guide 1: Troubleshooting Low Sensitivity on a Triple Quadrupole (QqQ)
Issue: Signal response for MRM transitions is lower than expected.
| Step | Action | Reference |
|---|---|---|
| 1 | Check for Gas Leaks: Inspect the gas supply, gas filters, column connectors, and all fittings for leaks. A leak can cause a loss of sensitivity and contaminate the sample. | [20] |
| 2 | Verify Ion Source Conditions: Ensure nebulizer, desolvation, and drying gas flows and temperatures are optimized for your mobile phase and flow rate. | [37] |
| 3 | Investigate Contamination: Perform a solvent blank scan and compare the TIC abundance and contaminant profile to historical data. High background can cause ion suppression. Clean the source and LC flow path if necessary. | [37] |
| 4 | Re-optimize MRM Parameters: Re-check the orifice voltage and collision energy for your target compounds. These parameters can drift over time or may not have been fully optimized. | [2] |
| 5 | Review Dwell Time: If the method has many MRM transitions, the dwell time for each may be too short, reducing sensitivity. Adjust dwell time to balance sensitivity and the number of data points per peak. | [10] |
Guide 2: Troubleshooting Poor Mass Accuracy on a Hybrid (Q-TOF) System
Issue: Mass measurement accuracy is outside acceptable limits (e.g., > 5 ppm).
| Step | Action | Reference |
|---|---|---|
| 1 | Perform Mass Calibration: Execute a full mass calibration of the TOF analyzer using a certified calibration solution appropriate for your mass range. | [37] |
| 2 | Allow for Instrument Warm-up: Ensure the instrument has stabilized for the recommended time after startup, as temperature fluctuations can affect mass accuracy. | [51] |
| 3 | Check Ion Statistics: For very low-abundance ions, poor signal-to-noise can lead to inaccurate centroid determination and poor mass accuracy. | [51] |
| 4 | Evaluate Source Conditions: Very high ion loads can cause space-charge effects within the ion guide or collision cell, shifting apparent mass. Dilute the sample or reduce the injection volume. | [51] |
| 5 | Verify Lock Mass or Internal Standard: If using a lock mass or internal standard for correction, ensure it is consistently introduced and its signal is stable. | [53] |
Experimental Protocols
Protocol 1: Basic Compound Optimization for MRM on QqQ and Q-TOF
This protocol outlines the general steps for optimizing MS parameters for a target compound, applicable to both QqQ and Q-TOF systems. [2]
1. Dilution of Chemical Standard:
- Prepare a pure standard of the target compound.
- Dilute it to a suitable concentration (typically 50 ppb - 2 ppm) in a solvent compatible with your prospective LC mobile phase. [2]
2. MS/MS Optimization:
- Parent Ion Identification: Directly infuse the standard solution. Identify the precursor ion ([M+H]+, [M-H]-, or adducts like [M+NH4]+) by scanning in Q1 (QqQ) or MS1 (Q-TOF). Optimize the orifice voltage or declustering potential by scanning a voltage range to find the value that gives the maximum response of the parent ion. [2]
- Product Ion Optimization: Introduce the optimized parent ion into the collision cell. For a QqQ, scan a range of collision energies to produce a spectrum of fragment ions. Select the most abundant 2-4 fragments to use as MRM transitions. For each transition, finely optimize the collision energy to maximize the daughter ion signal. For a Q-TOF, perform the same collision energy scan to obtain a high-resolution product ion spectrum, which will be used for both quantification and confirmation. [2]
3. Chromatography Optimization:
- Select an appropriate LC column (e.g., C18 for non-polar compounds).
- Inject the standard and optimize the LC conditions (mobile phase gradient, flow rate, column temperature) to achieve a well-resolved, sharp peak shape. [2]
4. Verification:
- Run a calibration curve with the optimized parameters to confirm that the response is proportional to the concentration and that the peak shape is consistent. [2]
Protocol 2: Advanced Fragmentation for Confirmatory Analysis on Hybrid Systems
This protocol describes a method for using multiple dissociation techniques on a modified Q-TOF platform for robust confirmatory analysis of pesticides, as cited in the literature. [53]
1. Sample Preparation:
- Centrifuge wine or juice samples at 14,000 rpm for 10 minutes at 4°C.
- Spike the supernatant with deuterated internal standards (e.g., thiacloprid-d4).
- Utilize a column-switching LC system with online dilution to inject large volumes (e.g., 80 μL) for high sensitivity. [53]
2. Data Acquisition:
- The modified Q-TOF platform is configured to enable three fragmentation modes in a single LC-MS/MS analysis:
- Collision-Induced Dissociation (CID): Standard fragmentation via collisions with gas.
- Electron-Activated Dissociation (EAD): Uses electrons to induce fragmentation, often producing complementary fragments to CID.
- Ultraviolet Photodissociation (UVPD): Uses a 266 nm laser to induce fragmentation, providing rich spectral information. [53]
- The workflow involves an untargeted data-independent acquisition (e.g., SWATH) for initial screening, followed by a targeted confirmatory analysis using scheduled MRM with CID, EAD, and UVPD MS/MS spectra. [53]
3. Data Analysis:
- Build an in-house MS/MS library containing EAD and UVPD spectra for identification.
- Confirm the identity of detected pesticides based on accurate mass, retention time, and matching MS/MS spectra from multiple fragmentation techniques against the library. [53]
Quantitative Data Comparison
The table below summarizes a performance comparison between a Triple Quadrupole (QqQ) and a Quadrupole-Time-of-Flight (QTOF) for the determination of allergen proteins in wine, as reported in a comparative study. [50]
Table 1: Analytical Performance of QqQ vs. QTOF for Allergen Protein Determination in Wine
| Parameter | Triple Quadrupole (QqQ) | Hybrid QTOF | Notes / Implication |
|---|---|---|---|
| Limit of Detection (LOD) / Limit of Quantification (LOQ) | 10 to 20-fold lower | Higher | QqQ is more sensitive and better for quantifying very low abundance analytes. [50] |
| Number of Detectable Transitions | Fewer | More (e.g., 12 more for α-casein) | QTOF can monitor more product ions, providing richer structural information for confirmation. [50] |
| Primary Strength | Accurate quantification at low levels (Gold standard) | Fit-for-purpose LOD/LOQ with more identification points | QqQ is superior for targeted quantification; QTOF is a proper alternative when higher identification confidence is needed. [50] |
Workflow Diagrams
The Scientist's Toolkit: Key Research Reagent Solutions
Table 2: Essential Materials for LC-MS/MS Method Development in Contaminant Analysis
| Item | Function | Example(s) |
|---|---|---|
| Pure Chemical Standards | To optimize MS parameters without interference; used for creating calibration curves. | Target analyte standard (e.g., Pesticide mix, allergen proteins); Deuterated Internal Standards (e.g., thiacloprid-d4). [53] [2] |
| Tuning and Calibration Solutions | To calibrate mass accuracy and ensure instrument performance is within specification. | ESI Tuning Mix (e.g., Agilent G1969-85000); APCI Tuning Mix. [37] |
| High-Purity Solvents & Additives | To prepare mobile phases and samples; minimizes background noise and ion suppression. | UHPLC-MS grade water and organic solvents (MeOH, ACN); Additives (Formic Acid, Ammonium Formate). [53] |
| LC Columns | To separate analytes from the sample matrix and each other, reducing ionization suppression. | C18 reversed-phase columns; other chemistries based on analyte properties. [2] |
| Cleaning Solutions | To remove contamination from the LC flow path and ion source, restoring sensitivity. | EDTA solution (for inorganic clusters); High-purity water and solvents. [37] |
Troubleshooting Common MRM Issues
Why is my MRM signal unstable or jagged, leading to poor reproducibility? This is often observed when a transition has an extremely narrow optimal collision energy (CE) peak. Small, unavoidable fluctuations in instrument parameters then cause large signal variations.
- Solution: First, try selecting an alternative product ion for the transition. For some problematic compounds, an alternate transition can provide much greater stability and meet QC reproducibility requirements, even if the primary transition is listed in standard methods [19]. If an alternate transition is not feasible, empirically re-optimize the CE with smaller voltage steps around the suspected optimum to precisely characterize the narrow peak.
Why is the collision energy value not saved in my MRM method editor? This is a known software bug in specific versions of MassLynx SCN (e.g., SCN 1050) for certain instruments like the Xevo TQ-GC [54].
- Solution: Waters does not recommend using the affected SCN version for controlling Xevo TQ-GC systems. The recommended fix is to downgrade the software to an earlier, stable version (e.g., SCN 1049) [54]. A registry edit workaround exists but is not recommended.
Why am I seeing ghost peaks or high background in my MRM chromatograms? Carryover and contamination from the autosampler are common sources of ghost peaks, critical for high-sensitivity LC-MS/MS [55].
- Solution: Perform a systematic autosampler cleaning and inspection [55]:
- Run a blank injection to confirm the presence of ghost peaks.
- Replace the needle and needle seat.
- Replace the sample loop.
- Clean or replace the injection valve's rotor seal and stator head. Always use fresh mobile phases and clean solvents, and ensure the needle wash station is functioning correctly.
Method Development & Optimization Protocols
Protocol 1: Automated Optimization for Multiply Charged Molecules
For biomolecules like peptides that form multiple charge states, manual optimization is complex. Automated software tools significantly streamline this process [56].
- Procedure:
- Precursor Ion Detection: The software discovers all precursor ions and optimizes the cone voltage for each charge state.
- Product Ion Discovery: For each precursor, the system identifies potential product ions.
- Collision Energy Optimization: The collision energy for each precursor-product ion pair is profiled and optimized.
- Review and Transfer: Use the software's interactive viewer to review the ranked transitions and directly export the optimal parameters to the acquisition method, eliminating transcription errors [56].
Protocol 2: Empirical CE Optimization via m/z Adjustment
This "single-run" workflow allows for rapid empirical optimization of CE (or other parameters) without run-to-run variability [11] [6].
- Procedure:
- Create a list of MRM transitions for your target analytes.
- Use a script to generate multiple unique MRM targets from a single transition by slightly adjusting the precursor and product m/z values at the hundredth decimal place. Each unique pair is assigned a different CE value.
- Acquire data for all these "different" transitions in a single run.
- Analyze the resulting data to determine which CE value produced the highest signal intensity for the original transition.
Protocol 3: Utilizing Large-Scale Empirical MRM Libraries
Leverage expansive empirical spectral libraries to bypass initial method development for known compounds.
- Procedure:
- Consult a library like the METLIN 960K MRM, which provides transitions derived from empirical MS/MS data collected at multiple collision energies (e.g., 0, 10, 20, 40 eV) [15].
- The library uses spline fitting to model CE-dependent intensity profiles, predicting the optimal CE and best quantifier/qualifier ions for nearly one million small molecules [15].
- Use these predicted transitions as the starting point for your analysis, then perform final fine-tuning on your specific instrument.
Research Reagent Solutions
| Item | Function |
|---|---|
| Authentic Chemical Standards | Pure compounds used to acquire empirical MS/MS data for building predictive libraries and for final method validation [15]. |
| Stable Isotope-Labeled Internal Standards | Account for variability in sample preparation and ionization efficiency, essential for precise quantification [6]. |
| PGC (Porous Graphitic Carbon) Column | Provides superior separation for glycan isomers and other challenging analytes, reducing co-elution in MRM analysis [57]. |
| High-Purity Mobile Phases & Additives | Minimize background noise and signal suppression; critical for achieving high sensitivity in contaminant analysis [55]. |
Workflow Visualization
Diagram 1: Automated MRM Optimization Workflow
Diagram 2: Data-Driven Transition Development
Performance Data
Table 1: Comparison of Collision Energy Optimization Methods
| Method | Key Principle | Advantages | Best For |
|---|---|---|---|
| Linear Equation Prediction [6] | CE = k * (precursor m/z) + b |
Fast, requires no standards, good for large-scale screening | Discovery-oriented SRM targeting hundreds of peptides |
| Empirical Single-Run Optimization [11] | Subtle m/z adjustment to test multiple CEs in one run | Avoids run-to-run variability, truly empirical | Final optimization of high-priority targets |
| Spline Fitting with AI Refinement [15] | Models continuous CE-intensity profile from data at 4 discrete energies | High predictive accuracy, no pure standard needed, scalable | Leveraging large spectral libraries (e.g., METLIN 960K) |
| Automated Software Tools [56] | Instrument-controlled optimization of precursor, product ions, and CE | Hands-off, eliminates transcription errors, reviews all charge states | Multiply charged molecules (peptides, biomolecules) |
Table 2: Validation of Predicted vs. Optimized Collision Energies
| Validation Metric | Finding | Implication for Method Development |
|---|---|---|
| Signal Intensity [6] | Using optimized linear equations achieved ~92% of the signal from fully empirical optimization. | Acceptable for many discovery-phase experiments; balance between sensitivity and throughput. |
| Sensitivity [15] | The METLIN 960K MRM library enabled robust detection down to 1 nM for over 100 diverse standards. | Data-driven predictions are sufficient for sensitive detection of many analytes without manual work. |
| Reproducibility [15] | Supervised learning models improved the reproducibility and predictive accuracy of spline-based CE models across chemical classes. | Algorithmic refinement increases robustness for quantitative applications. |
Benchmarking Performance and Comparing MRM with Emerging Techniques
Frequently Asked Questions
Q1: What are the key validation metrics I should use to assess an optimized Collision Energy (CE) method? The core metrics for validating a CE method are sensitivity, reproducibility, and the Limit of Detection (LOD) and Limit of Quantitation (LOQ). Sensitivity ensures your method detects low analyte levels, reproducibility confirms the method's reliability across runs, and LOD/LOQ define the lowest concentrations your method can detect and accurately quantify [6] [58].
Q2: How do I define the detection and quantification capabilities of my CE-optimized method? The following definitions are crucial for characterizing your method's performance at low concentrations [59]:
- Limit of Blank (LoB): The highest apparent analyte concentration expected when replicates of a blank sample (containing no analyte) are tested. It is calculated as: LoB = meanblank + 1.645(SDblank).
- Limit of Detection (LoD): The lowest analyte concentration that can be reliably distinguished from the LoB. It is calculated as: LoD = LoB + 1.645(SD_low concentration sample).
- Limit of Quantitation (LoQ): The lowest concentration at which the analyte can be quantified with acceptable precision and bias. It is always greater than or equal to the LoD [59] [58].
Q3: My method's sensitivity is inconsistent after CE optimization. What could be wrong? Inconsistency often stems from an improperly defined calibration curve or matrix effects. Ensure your calibration standards are prepared in a matrix similar to your sample and that the curve is linear across your intended range. Re-calculating the linear equation for CE prediction for your specific instrument and analyte can also improve consistency [6] [58].
Troubleshooting Guide
| Problem | Possible Cause | Solution |
|---|---|---|
| High variability in replicate samples | 1. Insufficient method optimization.2. Sample matrix interference.3. Instrument performance issues. | 1. Verify CE optimization using a minimum of 20 replicates for established methods, or 60 for developing new methods [59].2. Use a matrix-matched blank to account for interference [58].3. Perform routine instrument maintenance and calibration. |
| LoD/LoQ values are higher than expected | 1. Excessive noise from the sample matrix or reagents.2. Suboptimal CE leading to poor fragmentation efficiency. | 1. Re-evaluate sample preparation and clean-up to reduce noise [58].2. Re-optimize the CE using a empirical approach or recalculate the predictive linear equation for your specific instrument platform [6]. |
| Poor reproducibility between instruments or reagent lots | 1. CE equation not calibrated for different instrument models or reagent lots. | 1. Establish and use instrument-specific linear equations for CE prediction. Incorporate data from multiple instruments and reagent lots during method development [59] [6]. |
Experimental Protocols for Key Metrics
Protocol for Determining LoB and LoD
This protocol follows the CLSI EP17 guideline to establish fundamental detection limits [59].
- Sample Requirements:
- Blank Sample: A sample containing all matrix constituents except the target analyte.
- Low-Concentration Sample: A sample with the analyte present at a concentration near the expected LoD.
- Replicates:
- For a manufacturer to establish these parameters: 60 replicates of each sample.
- For a laboratory to verify a manufacturer's claim: 20 replicates of each sample.
- Procedure & Calculations:
- Measure all replicates of the blank sample. Calculate the mean and standard deviation (SDblank).
- Calculate the LoB: LoB = meanblank + 1.645(SDblank).
- Measure all replicates of the low-concentration sample. Calculate its standard deviation (SDlow).
- Calculate the LoD: LoD = LoB + 1.645(SD_low concentration sample).
- Verification: Once a provisional LoD is established, test a sample with that concentration. No more than 5% of the values should fall below the LoB. If they do, the LoD must be re-estimated at a higher concentration [59].
Protocol for CE Optimization via Predictive Equations
This workflow allows for efficient, high-throughput CE optimization, as implemented in tools like Skyline [6].
- Principle: The optimal CE for a peptide is predicted from its mass-to-charge ratio (m/z) using a linear equation: CE = k * (precursor m/z) + b, where k is the slope and b is the intercept.
- Procedure:
- Empirical Calibration: Select a set of representative peptides and empirically determine the optimal CE for each one by infusion.
- Generate Equation: Plot the optimal CE values against the precursor m/z for these peptides. Perform linear regression to derive the slope (k) and intercept (b) for each charge state.
- Application: Apply the derived equation to predict the CE for new target peptides in your SRM/MRM method.
- Validation: Compare the signal intensity achieved with the predicted CE against a set of empirically optimized values. The difference is often minimal, demonstrating the method's effectiveness [6].
The diagram below illustrates the core workflow for establishing the detection and quantification capabilities of an analytical method.
The Scientist's Toolkit: Essential Research Reagent Solutions
The table below lists key materials and their functions for developing and validating CE-optimized MRM methods.
| Item | Function in Experiment |
|---|---|
| Tryptic Protein Digest | A complex sample matrix used to develop and optimize the SRM/MRM method under realistic conditions [6]. |
| Synthetic Stable Isotope-Labeled Peptides | Serve as internal standards to account for sample preparation losses and ionization variability, crucial for precise quantification [6]. |
| Matrix-Matched Blank | A sample containing all components of the test matrix except the analyte, essential for accurate determination of LoB and LoD [58]. |
| Low Concentration Calibrators | Samples with known, low concentrations of analyte used to empirically determine the LoD and LoQ [59]. |
| LC-MS/MS Mobile Phase Additives | Reagents like formic acid are used to control pH and improve ionization efficiency in the LC mobile phase [6]. |
In the field of targeted mass spectrometry, two primary techniques stand out for the precise detection and quantification of molecules: Multiple Reaction Monitoring (MRM) and Parallel Reaction Monitoring (PRM). For researchers focused on contaminant analysis, the choice between these methods significantly impacts the success of method development, particularly in optimizing collision energy (CE) for sensitive and accurate assays. MRM, conducted on triple quadrupole (QQQ) instruments, is the established gold standard for high-throughput, sensitive quantification of predefined targets [60] [61]. In contrast, PRM, implemented on high-resolution accurate-mass (HRAM) platforms like Orbitrap or Q-TOF instruments, offers high specificity and flexibility by acquiring full-scan MS/MS spectra [60] [62]. This technical guide delves into the core differences between these techniques, providing troubleshooting advice and methodological protocols to help you optimize your targeted analyses within a contaminant research framework.
Core Technical Principles and Instrumentation
1.1 Multiple Reaction Monitoring (MRM) MRM is a targeted quantification technique performed on a triple quadrupole (QQQ) mass spectrometer. Its operation is based on monitoring specific precursor-to-fragment ion transitions:
- Quadrupole 1 (Q1): Selects a specific precursor ion based on its mass-to-charge ratio (m/z).
- Quadrupole 2 (q2): Functions as a collision cell, where the selected precursor ion is fragmented using a pre-optimized collision energy (CE).
- Quadrupole 3 (Q3): Monitors specific, predefined fragment ions (transitions) [60] [63].
This sequential filtering results in an exceptionally sensitive and specific signal for the target analyte, making MRM ideal for high-throughput applications where numerous samples need to be analyzed for a validated set of compounds [60].
1.2 Parallel Reaction Monitoring (PRM) PRM is a targeted technique performed on HRAM instruments, such as quadrupole-Orbitrap or Q-TOF systems. Its workflow differs from MRM:
- Quadrupole (Q1): Isolates a specific precursor ion.
- Collision Cell (q2): Fragments the isolated ion.
- High-Resolution Mass Analyzer (Orbitrap/TOF): Instead of monitoring a few predefined fragments, this analyzer records the entire, high-resolution MS/MS spectrum of all resulting product ions [60] [62].
This full-spectrum acquisition provides two key advantages: it eliminates the need for upfront transition optimization and allows for retrospective data analysis, as other fragment ions can be quantified from the stored data post-acquisition [64].
Performance Comparison: Throughput, Flexibility, and Specificity
The table below summarizes the critical performance characteristics of MRM and PRM to guide your method selection.
| Feature | MRM (Multiple Reaction Monitoring) | PRM (Parallel Reaction Monitoring) |
|---|---|---|
| Instrumentation | Triple Quadrupole (QQQ) [60] [61] | Orbitrap, Q-TOF [60] [61] |
| Throughput | High. Fast duty cycle; suitable for 100s-1000s of samples [60] [65] | Moderate. Longer scan times for full spectra limit targets per run [60] |
| Flexibility | Low. Analyzes only predefined transitions; re-analysis required for new ions [60] | High. Retrospective analysis of full MS/MS spectrum; new ions can be quantified without new runs [60] [62] |
| Specificity & Resolution | Unit resolution. Relies on transition uniqueness; susceptible to isobaric interference [60] [66] | High (HRAM). Resolves interference via accurate mass; high confidence in analyte ID [60] [62] |
| Sensitivity | Very High. Maximized dwell time on specific transitions [60] [67] | High. Sufficient for most applications, though can be lower than MRM for trace analysis [60] [67] |
| Method Development | Time-consuming. Requires optimization of CE and voltage for each transition [60] [11] | Quick. Minimal optimization; CE can often be predicted or broadly optimized [60] |
| Best For | High-throughput screening, routine quantification of known contaminants [60] [61] | Low-abundance targets, complex matrices, novel/unknown contaminant analysis [60] [65] |
Experimental Protocols: From Method Setup to Collision Energy Optimization
Protocol 1: Rapid MRM Collision Energy Optimization
Optimizing collision energy is critical for maximizing fragment ion signal and thus, assay sensitivity in MRM [11]. This protocol describes a rapid, single-run method for CE optimization.
Principle: Subtly adjusting the precursor and product m/z values at the hundredth decimal place creates unique MRM targets for different CE values, allowing them to be cycled through rapidly in one run without run-to-run variability [11].
Materials:
- Pure analytical standard of the target contaminant
- LC-MS/MS system (Triple Quadrupole)
- Solvent (e.g., 50/50 methanol/water with 0.1% formic acid)
Step-by-Step Procedure:
- Standard Preparation: Dilute the pure contaminant standard to a suitable concentration (e.g., 50 ppb-2 ppm) in an appropriate solvent [2].
- Initial Parameter Setup: Define the precursor ion ([M+H]+ or [M-H]-) and initial candidate product ions based on literature or database searches (e.g., NIST). Use a generalized equation (e.g., CE = 0.034 x (precursor m/z) + 1.314 for doubly charged ions) to calculate a starting CE value [11].
- Generate MRM Transition List: Using a script or manually, create a list of MRM transitions where for a single precursor-product ion pair, the m/z values are slightly adjusted (e.g., at the 0.01 place) to create 5-7 unique entries. Program each unique entry with a different CE value, typically varying ±6 V from the calculated value in 2 V steps [11].
- Data Acquisition: Inject the standard and run the MRM method. The instrument will cycle through all CE conditions for the target as if they were different compounds.
- Data Analysis: Use MRM software (e.g., Skyline, Mr.M [11]) to visualize the peak area or intensity for each transition at each CE value. The CE yielding the highest signal for a given fragment ion is optimal.
Troubleshooting:
- Low Signal at All CEs: Verify precursor ion identity and consider alternative adducts (e.g., [M+NH4]+). Re-check standard concentration and instrument calibration [2].
- Poor Chromatographic Peak: Optimize LC conditions (column, mobile phase, gradient) to ensure a well-resolved peak before finalizing CE optimization [2].
Protocol 2: PRM Assay Development for Contaminant Screening
PRM simplifies method development as it does not require pre-selection of fragment ions.
Principle: A precursor ion of interest is isolated and fragmented, and all product ions are recorded in a high-resolution MS/MS scan. The optimal CE can be determined by infusing a standard and testing a range of energies to find the value that generates a comprehensive and intense fragment spectrum [60] [64].
Materials:
- Pure analytical standard of the target contaminant
- LC-HRAM-MS system (e.g., Q-Exactive Orbitrap)
- Solvent
Step-by-Step Procedure:
- Standard Preparation: As in Protocol 1.
- Full MS/MS Scan: Inject the standard and acquire a full MS/MS spectrum at a mid-range CE (e.g., 25-35 eV). This helps identify characteristic fragment ions for the target.
- Scheduled PRM Method: Create a scheduled PRM method in the instrument software.
- Inclusion List: Input the precursor m/z and a retention time window.
- Collision Energy: A single, broadly optimized CE (e.g., from step 2) or a stepped CE can be applied. Stepped energy can be beneficial for generating more fragments but requires more instrument time.
- Data Acquisition: Run the sample with the scheduled PRM method.
- Data Analysis: Process the data using software like Skyline. The software will extract ion chromatograms (XICs) for all fragment ions from the high-resolution MS/MS data, allowing for identification and quantification.
Troubleshooting:
- Low Signal: Increase the maximum injection time (maxIT) to allow more ions to be accumulated, improving sensitivity for low-abundance contaminants [63].
- Co-isolation Interference: Narrow the quadrupole isolation window (e.g., from 1.5 Th to 0.7 Th) to reduce the number of co-isolated background ions, improving specificity [62].
The Scientist's Toolkit: Essential Research Reagents and Materials
The following table lists key materials required for developing and running targeted MRM and PRM assays in contaminant research.
| Item | Function | Application Notes |
|---|---|---|
| Pure Analytical Standards | Method development and calibration; provides known target for optimization [2]. | Essential for both MRM and PRM. Critical for determining optimal CE. |
| Stable Isotope-Labeled (SIL) Internal Standards | Normalizes for matrix effects and compensates for sample prep/instrument variability [63]. | Recommended for both techniques to achieve high quantitative accuracy. |
| LC-MS Grade Solvents | Mobile phase preparation; minimizes background noise and system contamination. | Required for reproducible chromatography and sensitive detection. |
| High-Performance LC Column | Chromatographic separation of target contaminants from matrix interferents. | Choice (e.g., C18) depends on contaminant polarity. |
| Triple Quadrupole MS | Platform for running MRM assays [60]. | Ideal for high-throughput, quantitative analysis of known contaminant panels. |
| HRAM Mass Spectrometer | Platform for running PRM assays (e.g., Q-Orbitrap, Q-TOF) [60]. | Necessary for PRM's high specificity and flexibility. |
| Software (e.g., Skyline) | Open-source tool for method development, data analysis, and transition validation [63] [61]. | Supports both MRM and PRM workflows. |
Frequently Asked Questions (FAQs)
Q1: For analyzing a new, poorly characterized contaminant, should I start with MRM or PRM? Start with PRM. Its high resolution and full-spectrum acquisition provide greater flexibility when fragment ion information is limited. You can acquire all fragment data without pre-defining transitions, which is invaluable for initial method development and characterizing unknown compounds. Once the contaminant is well-characterized, you can transition to a more sensitive MRM assay for routine monitoring [60] [64].
Q2: My MRM assay shows high background noise. How can I improve specificity?
- Check for Interference: Use a blank sample to confirm the signal is from your target.
- Optimize Transitions: Re-evaluate your chosen fragment ions. Select more specific, higher-mass fragments if possible.
- Chromatography: Improve LC separation to better resolve the target from co-eluting matrix components.
- Confirm with PRM: If accessible, use a PRM assay on a high-resolution instrument to confirm the identity of the interfering signal and validate your MRM transitions [60] [66].
Q3: Can I convert my existing MRM method to a PRM method? Yes, the conversion is straightforward. The precursor ion m/z and optimal retention time window from your MRM method can be directly used to build the PRM inclusion list. The key advantage is that you do not need to pre-select fragment ions for PRM, simplifying the process [60].
Q4: What is the most critical parameter to optimize for MRM sensitivity? Collision energy (CE) is among the most critical parameters. An improperly optimized CE can lead to incomplete fragmentation or over-fragmentation, drastically reducing the signal of the monitored product ions and thus, overall assay sensitivity [11] [2]. Systematically optimizing CE for each transition, as outlined in Protocol 1, is essential.
Q5: Why is my PRM data noisier than my MRM data for the same low-abundance contaminant? This often relates to how data is extracted. PRM specificity comes from post-acquisition processing of high-resolution fragment ions. Ensure you are extracting the chromatograms for the most abundant and specific fragment ions with a narrow mass tolerance (e.g., 10 ppm). Increasing the maximum injection time can also boost the signal for low-abundance targets in PRM [63] [64].
The Role of High-Resolution Mass Spectrometry in Verification and Transition Selection
Frequently Asked Questions (FAQs)
1. What is the key advantage of High-Resolution Multiple Reaction Monitoring (MRMHR) over traditional MRM? MRMHR, performed on instruments like Q-TOF mass spectrometers, provides high data richness and excellent specificity because it records full, high-resolution MS/MS spectra for all analytes. This allows for confirmation of identity by checking for additional fragment ions of diagnostic value, beyond just the one or two transitions monitored in traditional MRM [68].
2. Why is individual optimization of Collision Energy (CE) critical for MRM assays? While generalized equations exist for predicting CE based on precursor m/z, they often fail to produce the maximum signal for all types of MRM transitions. Factors like peptide residue content, proton mobility, and the presence of b-type ions that undergo secondary fragmentation mean that optimal CE can vary significantly from the calculated value. Individual optimization ensures maximum sensitivity and robustness for your specific assay [11].
3. How can I quickly determine the optimal Collision Energy and Cone Voltage for a large set of transitions? A highly efficient workflow involves using a script to subtly adjust the precursor and product m/z values at the hundredth decimal place. This codes for different CE or CV values, creating a series of unique MRM targets for the same transition that can be cycled through in a single run. This avoids run-to-run variability and allows for rapid visualization and selection of the optimal parameters using analysis software [11].
4. My analyte signal is low during optimization. What could be the cause? Low signal for the expected [M+H]+ or [M-H]- ions can sometimes result from the formation of adducts with mobile phase additives (e.g., forming [M+NH4]+ with ammonium formate). Try re-optimizing for these alternative adduct masses. Also, ensure you are using a pure chemical standard diluted to an appropriate concentration (e.g., 50 ppb-2 ppm) to avoid interference [2].
5. When should I consider using a data-independent acquisition method like SWATH for quantification? SWATH acquisition is particularly powerful when you need to screen for a very large number of compounds in a single run without pre-defining transitions. It generates comprehensive, high-quality MS/MS spectra for all ions in a sample, creating a permanent data record that can be re-interrogated later for compounds not initially targeted. Studies have shown it can provide performance similar to MRMHR for many analytes [68].
Troubleshooting Guides
Problem: Poor Sensitivity in MRMHR Assay
Question: "My MRMHR assay lacks the sensitivity needed to detect low-abundance contaminants. What steps can I take to improve it?"
| Troubleshooting Step | Action Details & Technical Parameters |
|---|---|
| Verify MS/MS Optimization | Confirm optimal orifice/declustering voltage for parent ion and CE for fragment ions. Use pure standard to find the most abundant at least two MRM pairs; one for quantification, another for confirmation [2]. |
| Optimize Chromatography | Review LC conditions. Use a suitable column (e.g., C18 for non-polar compounds); optimize mobile phase gradient, flow rate, and column temperature to produce a sharp, well-resolved peak and separate the analyte from matrix interferences [2]. |
| Check Sample Cleanup | Matrix effects can suppress ionization. Implement a cleanup step. A two-step QuEChERS-based cleanup (e.g., with PSA) can effectively reduce matrix components and improve analyte recovery and signal [68]. |
Problem: Inconsistent Quantification Results
Question: "My quantitative results are not reproducible across different runs or between users. How can I improve method robustness?"
| Troubleshooting Step | Action Details & Technical Parameters |
|---|---|
| Confirm Stable Instrument Parameters | Re-calibrate the instrument. Systematically optimize key parameters like CE and cone voltage for each transition, as generalized equations may not be optimal [11]. |
| Use Internal Standards | Always use stable isotope-labeled internal standards for each target analyte. They correct for losses during sample preparation, matrix effects, and instrumental fluctuations. |
| Validate Method Reproducibility | Conduct reproducibility experiments (e.g., multi-day, multi-user). A well-optimized method should show high reproducibility, with reported protein quantification in independent experiments having a coefficient of variation below 5% [69]. |
Experimental Protocols & Data
Protocol: Rapid Optimization of Collision Energy and Cone Voltage
This protocol allows for the determination of optimal instrument parameters for each MRM transition in a single run, avoiding run-to-run variability [11].
1. Required Materials
- Research Reagent Solutions
- Pure Chemical Standard: A solution of your target analyte, free from interference, typically diluted to 50 ppb-2 ppm in a solvent compatible with the LC mobile phase [2].
- Solvents: HPLC-grade water, acetonitrile, and methanol.
- Additives: Formic acid, ammonium formate, or other volatile salts for mobile phase modification.
2. Step-by-Step Methodology
Step 1: Create the Initial Transition List
- Generate a list of all precursor-product ion pairs (MRM transitions) you wish to optimize.
Step 2: Reprogram m/z Values to Code for Parameters
- Use a script (e.g., in Perl) to modify the precursor and product m/z values. The script rounds each m/z to the nearest tenth and uses the second decimal place to code for the parameter being tested.
- Example: For a precursor ion at m/z 355.53 and a product ion at m/z 448.24, the script creates seven entries where the product m/z is adjusted to 448.21, 448.22, ..., 448.27. Each of these is assigned a different collision energy (e.g., 7.4 V, 9.4 V, ..., 19.4 V) [11].
- This makes seven different parameter sets for the same transition appear as seven unique transitions to the instrument software.
Step 3: Execute the Single Optimization Run
- Load the modified MRM method containing all "coded" transitions into the triple quadrupole mass spectrometer.
- Inject the standard and acquire data. All parameter combinations are cycled through rapidly in one injection.
Step 4: Data Analysis and Visualization
- Analyze the data using MRM software (e.g., Mr. M).
- The software groups the signals from the subtly different m/z values (which correspond to the same physical transition) and plots the signal intensity against the collision energy or cone voltage.
- The parameter value that yields the maximum product ion signal is identified as the optimal value for that transition.
The workflow for this optimization is outlined below:
Performance Comparison: MRMHR vs. SWATH Acquisition
The following table summarizes a comparative study of MRMHR and SWATH acquisition modes for quantifying 48 wastewater-borne pollutants in lettuce, demonstrating their comparable performance for most analytes [68].
| Performance Metric | High-Resolution MRM (MRMHR) | SWATH Acquisition |
|---|---|---|
| General Recoveries | 80 - 120% for most compounds | 80 - 120% for most compounds |
| Problematic Compound Recovery | Sulfanilamide: 26.8%Ciprofloxacin: 27.8%Sulfamethazine: 28.4% | Sulfanilamide: 25%Ciprofloxacin: 33.9%Sulfamethazine: 35% |
| Key Advantage | Robust, targeted quantitation; high specificity and sensitivity for predefined transitions. | Comprehensive data recording; allows retrospective analysis without predefined targets. |
| Application Fit | Ideal for targeted verification of a specific, known set of contaminants. | Ideal for suspect screening and quantification of a very broad range of analytes. |
The Scientist's Toolkit: Essential Research Reagents & Materials
The following table details key reagents and materials essential for developing and optimizing HR-MS methods for contaminant analysis.
| Item | Function & Application |
|---|---|
| Stable Isotope-Labeled Internal Standards | Corrects for matrix effects and analytical variability; essential for achieving accurate quantification [11]. |
| QuEChERS Extraction Kits | Provides a quick, easy, and effective sample preparation method for complex matrices like food (e.g., lettuce) or biological samples [68]. |
| LC-MS Grade Solvents & Additives | (Water, Acetonitrile, Methanol, Formic Acid) Minimizes chemical noise and ion suppression, ensuring high sensitivity and reproducible chromatography [68] [2]. |
| High-Purity Chemical Standards | Used for instrument calibration, method development, and optimization free from interference [2]. |
| PSA (Primary Secondary Amine) Sorbent | Used in a cleanup step to remove polar interferences like fatty acids and sugars from sample extracts, reducing matrix effects [68]. |
Troubleshooting Guides
Guide 1: Resolving Inconsistent Results After Transferring CE Values
Problem: After successfully optimizing Collision Energy (CE) on one instrument and transferring the method to another platform in a different lab, the sensitivity and signal intensity for the Multiple Reaction Monitoring (MRM) transitions have significantly decreased.
Explanation: Optimal CE values are highly dependent on the specific instrument platform, collision cell design, and gas pressure. A value optimized on one system is often not directly transferable to another. Furthermore, different vendors may use different equations and default values for calculating CE, leading to discrepancies [11] [70].
Solution Steps:
- Verify Instrument Equations: Check the default CE calculation formulas in the method editor on the new instrument. Do not assume they are identical to the original platform. The equation
CE = 0.034 × (m/z precursor) + 1.314is an example from one vendor and may not be universal [11]. - Re-optimize Critically: For a limited set of key analytes, perform a fresh, rapid CE optimization on the new instrument. Use the transferred CE as a starting point and test a range of values (e.g., ± 6 V) to find the new optimum [11].
- Use Ion-Type Specific Equations: If full re-optimization is not feasible, apply more refined equations. Research shows that
b-ionsoften require lower CE thany-ions, while transitions involving fragmentation next to aspartic or glutamic acid (D/E-X) may require higher energy [70]. Using a single equation for all transition types can lead to suboptimal performance. - Leverage Advanced Libraries: Consult large-scale empirical MRM libraries, such as the METLIN 960K MRM library, which provides experimentally derived optimal CE values for a wide range of compounds. These can serve as a robust starting point for method transfer [15].
Guide 2: Fixing Retention Time Shift Issues in Transferred MRM Methods
Problem: A transferred Scheduled MRM (sMRM) method, where transitions are monitored only in narrow retention time (RT) windows, is missing peaks because the analyte RTs have shifted on the new LC system.
Explanation: Scheduled MRM relies on precise RT windows. Even minor changes in the LC system—such as a different column batch, minor variations in mobile phase pH, or a different dwell volume—can cause RT shifts. If a peak elutes outside its scheduled window, it will not be acquired [71].
Solution Steps:
- Switch to a Robust MRM Mode: Implement a Scout triggered MRM (stMRM) workflow if supported by your instrument platform (e.g., on SCIEX systems). This mode uses "marker" transitions to trigger the acquisition of dependent target analytes, removing the need for precise RT windows and making the method resilient to RT shifts [71].
- Widen RT Windows Initially: As a temporary measure, significantly widen the RT windows in the sMRM method for the initial testing phase on the new system. This ensures no peaks are missed while you re-establish the exact elution profile.
- Re-calibrate RTs: Inject a standard and update the RT for each analyte in the sMRM method based on the new chromatographic conditions.
Guide 3: Handling Skyline Software Errors During Iterative CE Optimization
Problem: When using Skyline software to perform iterative CE optimization, the software does not center the second round of optimization around the correct, newly determined optimal CE value. Instead, it reverts to a value from a default equation.
Explanation: Skyline uses a collision energy predictor that can sometimes override experimentally optimized values. If the software is not correctly configured to prioritize the results from a previous optimization round (stored in an internal optimization library) over its default equation, it will generate incorrect methods for subsequent rounds [26].
Solution Steps:
- Check the Optimization Library: Navigate to
Settings > Transition Settings > Prediction > Optimization Library > Edit Currentin Skyline. Verify that the optimal CE value from your first round of optimization is correctly stored in the library [26]. - Use "Explicit Collision Energy": For the problematic transitions, you can manually enter the optimized CE value from the first round into the "Explicit Collision Energy" column in the document grid. This forces Skyline to use this specific value [26].
- Verify Export Settings: When exporting the transition list for the next optimization round, ensure the option to "use optimization values when present" is selected. If this fails, it may indicate a software bug, and you should report the issue to the Skyline support team with your raw data files [26].
Frequently Asked Questions (FAQs)
Q1: Why can't I use a single, generalized CE equation for all my MRM transitions?
While generalized equations provide a good starting point, they often fail to produce the maximum signal for all types of MRM transitions. The optimal CE depends on factors beyond just the precursor ion's mass-to-charge ratio, including the peptide's sequence, the specific product ion type (b-ion vs. y-ion), and the chemical bonds being broken. Using a one-size-fits-all equation can result in significantly reduced sensitivity for many transitions [11] [70].
Q2: What is the most efficient way to optimize CE for a large panel of analytes during method transfer?
The most efficient strategy is to use an automated optimization tool provided by your instrument's software or third-party platforms like Skyline. For example, the MRM Optimization tool in waters_connect for Quantitation Software can automatically discover precursor ions, generate product ions, and optimize cone voltage and collision energy across multiple charge states, directly transferring the best transitions to the acquisition method [72]. Alternatively, you can use a rapid, single-run method that programs different CE values by subtly adjusting the precursor and product m/z values, allowing you to test multiple CEs for many transitions in one injection [11].
Q3: Are there emerging technologies that can simplify CE method transfer in the future?
Yes, data-driven approaches and artificial intelligence are playing an increasing role. Large, empirically derived MRM libraries are a key development. The METLIN 960K MRM library, for instance, uses a spline-based pipeline fitted with data from four collision energies to model and predict optimal CE for over 960,000 compounds. This provides a vendor-independent, empirically grounded starting point for method development and transfer, reducing reliance on instrument-specific equations [15].
Experimental Protocols for Method Transfer
Protocol: Rapid Single-Run CE Optimization
This protocol is designed for quickly re-optimizing CE on a new instrument platform after transfer [11].
Materials:
- Standard solution of the target analyte(s)
- Triple quadrupole mass spectrometer
- Software for MRM method creation and data analysis (e.g., Skyline, vendor-specific software)
Step-by-Step Method:
- Prepare Transition List: Start with your list of MRM transitions and their original (transferred) CE values.
- Program CE Variation: For each transition, create multiple new entries that correspond to a range of CE values (e.g., the original value ± 2, 4, and 6 V). To make the instrument treat these as unique transitions, subtly adjust the second decimal place of the precursor (Q1) and product (Q3) m/z values for each CE step [11].
- Create Acquisition Method: Build an MRM method that includes all these subtly different transitions.
- Acquire Data: Inject the standard and acquire data in a single run.
- Analyze Results: Use analysis software (e.g., the Mr. M package) to plot the signal intensity for each transition against its corresponding CE value. The CE that produces the highest intensity is the new optimum.
- Update Method: Update your final quantitative MRM method with the true m/z values and the newly determined optimal CE.
The table below summarizes the core parameters to focus on when transferring and optimizing CE methods.
| Parameter | Impact on MRM Sensitivity | Consideration for Method Transfer |
|---|---|---|
| Collision Energy (CE) | Directly affects fragmentation efficiency and product ion signal. | Not directly transferable. Must be re-optimized on the new platform or validated against a robust empirical library [11] [70] [15]. |
| Cone Voltage (CV) / Declustering Potential (DP) | Affects ion transmission and declustering in the source. | Can also be instrument-specific. Should be optimized alongside CE for best results [11]. |
| Retention Time (RT) | Critical for Scheduled MRM; shifts can cause missed acquisitions. | Always re-confirm RT on the new LC system. Consider using Scout triggered MRM to avoid this issue [71]. |
Workflow Visualization
Diagram 1: Cross-Platform CE Method Transfer Workflow
Diagram 2: Instrument-Specific Factors in CE Optimization
The Scientist's Toolkit: Essential Research Reagents & Software
| Tool Name | Function / Purpose | Vendor / Source |
|---|---|---|
| waters_connect for Quantitation | Automated software for MRM method development, including precursor ion discovery and CE optimization for multiply charged molecules [72]. | Waters |
| Skyline | Open-source software for building MRM methods, analyzing results, managing optimization libraries, and troubleshooting CE values [26]. | MacCoss Lab, University of Washington |
| Scout Triggered MRM (stMRM) | An algorithm that uses marker ions to trigger MRM acquisition, making methods robust against retention time shifts during transfer [71]. | SCIEX |
| METLIN 960K MRM Library | A large-scale library of empirically acquired MRM transitions and predicted optimal CE values for nearly one million small molecules [15]. | The Scripps Research Institute |
| Lipid Maps Database | A comprehensive database used to build MRM-profiling methods for lipid exploratory analysis, including precursor ions and class-specific product ions [4]. | LIPID MAPS Consortium |
Troubleshooting Guides and FAQs
Troubleshooting Common MRM Assay Issues
1. Issue: Loss of Sensitivity in MRM Analysis
- Potential Causes and Solutions:
- Gas Leaks: A common cause of sensitivity loss and sample contamination. Systematically check the instrument for leaks, including the gas supply, gas filters, shutoff valves, EPC connections, weldment lines, and column connectors. Retighten connections or replace cracked parts as needed [20].
- Suboptimal Collision Energy (CE): Generalized CE equations may not yield maximal signal for all peptides. Rapidly determine the optimal CE for each transition by testing a range of values (e.g., ±6 V from the calculated value) in a single run using specialized software or scripts [11].
- Low Dwell Time: Excessively short dwell times can degrade the signal-to-noise ratio, especially for low-abundance analytes. Use the Scheduled MRM Algorithm Pro to monitor transitions only during their expected elution time, which allows for longer dwell times and higher duty cycles even in multiplexed assays [73]. For Dwell Time Weighting, assign higher dwell time weights (~5) to low-abundance analytes and normal weights (1) to high-abundance ones to optimize cycle time and sensitivity [73].
2. Issue: Poor Chromatographic Peak Shape or Insufficient Data Points
- Potential Causes and Solutions:
- Insufficient Cycle Time: The cycle time must be fast enough to acquire enough data points across a chromatographic peak. For accurate quantification, aim for 6-8 data points across the peak at half height [73].
- Too Many Concurrent MRMs: Monitoring too many transitions simultaneously forces a trade-off between dwell time and cycle time. Implement scheduled MRM: by associating each transition with an expected retention time, the number of concurrent MRMs at any point is drastically reduced, enabling optimal dwell times and cycle times [7] [73]. This allows over 1,000 transitions per hour to be monitored while maintaining peak integrity [7].
3. Issue: Specificity Concerns and Uncertain Peak Identity
- Potential Causes and Solutions:
- Insufficient Transitions: Using only one transition per peptide increases the risk of misidentification due to co-eluting interferences. Monitor 3-4 fragments per peptide to increase confidence [7]. Use MRM Triggered MRM acquisition, where a primary transition above a set threshold triggers the acquisition of secondary confirming transitions for the same compound [73].
- Lack of Spectral Confirmation: For ultimate confidence, use an MRM-triggered MS/MS workflow (e.g., MIDAS on QTRAP systems) to collect a full product ion spectrum when the MRM signal is detected. Using Group-based triggering, where all transitions for a compound must exceed a threshold, reduces false MS/MS triggers and confirms compound identity with high specificity [73].
Frequently Asked Questions (FAQs)
Q1: What is the fundamental difference between SRM and MRM? A: The terms are often used interchangeably. Selected Reaction Monitoring (SRM) is the highly sensitive and selective method for monitoring a specified precursor ion and one of its product ions. When SRM is applied to monitor multiple product ions from one or more precursor ions, it is referred to as Multiple Reaction Monitoring (MRM). The specific precursor/product ion pairs are called "transitions" [7].
Q2: What are the key criteria for selecting a proteotypic peptide for an MRM assay? A: A good signature peptide should be [7]:
- Unique to the protein of interest.
- Easily detectable, typically 5-25 amino acids long.
- Have the correct enzymatic cleavage ends (e.g., tryptic ends for trypsin digestion).
- Avoid missed cleavages, ragged ends, and amino acids prone to modifications (e.g., Methionine oxidation, Asparagine deamidation).
Q3: How do I determine the optimal number of transitions to monitor per peptide? A: During method development, you may monitor many transitions. For a established, quantitative assay, it is standard practice to monitor 3-4 fragments per peptide [7]. This provides a balance between confident identification/quantification and maintaining a sufficient sampling rate across the chromatographic peak.
Q4: What is a key statistical parameter for assessing the quality of my HCS/MRM assay? A: The Z'-factor is a standard statistical parameter for evaluating assay robustness. An assay with a Z'-factor greater than 0.4 is considered robust for screening, though many prefer a value greater than 0.6 [74].
Optimizing Collision Energy for MRM Pairs: A Practical Guide
General equations provide a starting point for Collision Energy (CE), but optimal sensitivity often requires peptide-specific optimization. The following workflow and table provide a clear path for this critical step.
Workflow for Rapid CE Optimization [11] This strategy allows for the determination of optimal CE for multiple transitions in a single run, avoiding run-to-run variability.
Default Collision Energy Equations for Common Instruments [7] [11]
Table: Base CE equations for different triple quadrupole instruments. m/z refers to the mass-to-charge ratio of the precursor ion.
| Instrument Model | Charge State | Collision Energy (CE) Equation |
|---|---|---|
| TSQ Altis | 2+ | CE = 0.034 × m/z + 2.2835 |
| TSQ Altis | 3+ | CE = 0.0295 × m/z + 1.4831 |
| TSQ Quantiva | 2+ | CE = 0.0339 × m/z + 2.3597 |
| TSQ Quantiva | 3+ | CE = 0.0295 × m/z + 1.5123 |
| Waters Quattro Premier | 2+ | CE = 0.034 × m/z + 1.314 |
The Scientist's Toolkit: Essential Research Reagent Solutions
Table: Key reagents and materials for developing and running robust MRM assays.
| Item | Function/Benefit |
|---|---|
| Synthetic Stable Isotope-Labeled (SIL) Peptides | Serve as internal standards for precise and accurate quantification, correcting for sample preparation losses and ion suppression [75]. |
| Sequencing-Grade Modified Trypsin | High-purity enzyme ensures complete and reproducible protein digestion, generating consistent signature peptides for reliable quantification [75]. |
| Skyline Software | A free, open-source Windows application for building MRM methods, analyzing resulting data, and iteratively refining targeted proteomics assays [7]. |
| Solid Black Polystyrene Microplates | Reduce well-to-well optical cross-talk and background fluorescence in cell-based assays, improving the signal-to-noise ratio [74]. |
| Immunodominant Proteins/Peptides | For infectious disease research (e.g., Brucella), these peptides are key targets for developing highly specific diagnostic MRM assays [76]. |
Conclusion
Optimizing collision energy is a cornerstone of developing robust, sensitive, and specific MRM methods for contaminant analysis. Moving beyond generic equations to empirical, data-driven strategies—including innovative single-run techniques and AI-powered modeling—is crucial for maximizing performance, especially for challenging analytes like highly polar molecules. While MRM remains the gold standard for high-throughput quantitative analysis, techniques like PRM offer complementary strengths for complex identification tasks. The future of targeted analysis lies in the intelligent integration of these approaches, leveraging large-scale empirical spectral libraries and sophisticated computational tools to achieve unprecedented accuracy and efficiency in biomedical and environmental research.
References
- 1. Core principles [https://www.shimadzu.com/an/service-support/technical-support/analysis-basics/fundamental/core_principles.html]
- 2. 4 Steps to Successful Compound Optimization on LC-MS/MS [https://www.technologynetworks.com/analysis/how-to-guides/4-steps-to-successful-compound-optimization-on-lc-msms-311382]
- 3. MRMaid 2.0: Mining PRIDE for Evidence-Based SRM ... [https://pmc.ncbi.nlm.nih.gov/articles/PMC3437039/]
- 4. Step-by-Step Approach to Build Multiple Reaction ... [https://pmc.ncbi.nlm.nih.gov/articles/PMC10332339/]
- 5. Optimization strategies for bottom-up proteomics [https://pubmed.ncbi.nlm.nih.gov/34859467/]
- 6. Effect of Collision Energy Optimization on the ... [https://pmc.ncbi.nlm.nih.gov/articles/PMC3005404/]
- 7. SRM [https://proteomicsresource.washington.edu/protocols05/MRM.php]
- 8. Species Determination and Quantitation in Mixtures Using ... [https://pmc.ncbi.nlm.nih.gov/articles/PMC5092036/]
- 9. An accurate and transferable protocol for reproducible ... [https://pubmed.ncbi.nlm.nih.gov/25302342/]
- 10. Understanding MRM Fundamentals: Dwell Time, Cycle ... [https://www.sepscience.com/understanding-mrm-fundamentals-dwell-time-cycle-time-and-duty-cycle-10389]
- 11. Rapid Optimization of MRM-MS Instrument Parameters by ... [https://pmc.ncbi.nlm.nih.gov/articles/PMC2811718/]
- 12. pseudoMRM transitions - Forum - LC/MS [https://community.agilent.com/technical/lcms/f/forum/7267/pseudomrm-transitions]
- 13. High background after preventative maintenance [http://www.chromforum.org/viewtopic.php?t=104464]
- 14. Powerful scan modes of QTRAP® System Technology [https://sciex.com/tech-notes/technology/powerful-scan-modes-of-qtrap-system-technology]
- 15. Adaptive Modeling of Tandem Mass Spectrometry Data [https://pmc.ncbi.nlm.nih.gov/articles/PMC12613142/]
- 16. LC–MS Sensitivity: Practical Strategies to Boost Your ... [https://www.chromatographyonline.com/view/lc-ms-sensitivity-practical-strategies-boost-your-signal-and-lower-your-noise]
- 17. Learn with Lin about LC–MS bioanalysis: part III tune ... [https://www.bioanalysis-zone.com/learn-with-lin-about-lc-ms-bioanalysis-part-iii-tune-the-triple-quadrupole-system_covance/]
- 18. Putting it together: why should I tune my mass spectrometer? [https://www.biotage.com/blog/putting-it-together-why-should-i-tune-my-mass-spectrometer]
- 19. Very narrow collision energy peak for MRM. [http://www.chromforum.org/viewtopic.php?t=119084]
- 20. A Guide To Troubleshooting Mass Spectrometry [https://gentechscientific.com/a-guide-to-troubleshooting-mass-spectrometry/]
- 21. MS1 Peptide Ion Intensity Chromatograms in MS2 (SWATH ... [https://pmc.ncbi.nlm.nih.gov/articles/PMC4563724/]
- 22. Automated Multiple Reaction Monitoring (MRM) Method ... [https://www.waters.com/nextgen/fi/en/library/application-notes/2025/automated-multiple-reaction-monitoring-mrm-method-development-for-peptide-drugs-using-waters_connect-for-quantitation-software.html?srsltid=AfmBOor5wotfWyHDyxIS4nlQSwnYCk04XkrS0t9G7tkYTdtoamMWxUd8]
- 23. Rapid optimization of MRM-MS instrument parameters by ... [https://pubmed.ncbi.nlm.nih.gov/19405522/]
- 24. Automated Detection of Inaccurate and Imprecise ... [https://pmc.ncbi.nlm.nih.gov/articles/PMC2851178/]
- 25. Optimization and Validation of a QuEChERS-Based ... [https://www.mdpi.com/1420-3049/30/11/2293]
- 26. Problem performing iterative CE optimization with explicit ... [https://skyline.ms/__r3/announcements-thread.view?rowId=47547]
- 27. Optimization, Validation, and Application of Cleanup ... [https://pmc.ncbi.nlm.nih.gov/articles/PMC11594120/]
- 28. Creation of the METLIN 960K MRM Database [https://pubmed.ncbi.nlm.nih.gov/41150651/?utm_source=FeedFetcher&utm_medium=rss&utm_campaign=pubmed-2&utm_content=1Rosxv1hqDRpVDAGIYITBhUfrOHYEDqys2UKgIyyRKtWFfKoPJ&fc=20240607134118&ff=20251028213355&v=2.18.0.post22+67771e2]
- 29. New MRM database for 960K compounds using adaptive ... [https://www.linkedin.com/posts/garysiuzdak_adaptive-modeling-of-tandem-mass-spectrometry-activity-7388992328763469824-dgVs]
- 30. metlin-mrm/xcms-mrm [https://www.lipidmaps.org/resources/tools/9?task=3]
- 31. METLIN–MRM: a cloud library and public resource for ... [https://pmc.ncbi.nlm.nih.gov/articles/PMC6629029/]
- 32. Methodology for contamination detection and reduction in ... [https://pmc.ncbi.nlm.nih.gov/articles/PMC12367959/]
- 33. LSM-MS2: A Foundation Model Bridging Spectral ... [https://arxiv.org/html/2510.26715v1]
- 34. Development of a UHPLC-MS/MS Method for Quantitative ... [https://pmc.ncbi.nlm.nih.gov/articles/PMC12474191/]
- 35. SPE-LC-MS/MS optimisation using response surface ... [https://www.sciencedirect.com/science/article/pii/S0021967325004005]
- 36. Application of LC-MS/MS for the analysis of highly polar ... [https://www.sciencedirect.com/science/article/pii/S030881462504419X]
- 37. Troubleshooting LC/TQ Contamination Issues - Articles [https://community.agilent.com/knowledge/lcms-portal/kmp/lcms-articles/kp105.troubleshooting-lc-tq-contamination-issues]
- 38. Contaminants Everywhere! Tips and Tricks for Reducing ... [https://www.chromatographyonline.com/view/contaminants-everywhere-tips-and-tricks-reducing-background-signals-when-using-lc-ms]
- 39. Ion chromatography coupled to high-resolution mass ... [https://www.sciencedirect.com/science/article/pii/S0048969723027912]
- 40. Collision energy-breakdown curves – An additional tool to ... [https://www.sciencedirect.com/science/article/pii/S237699982030012X]
- 41. Dwell Time - an overview [https://www.sciencedirect.com/topics/biochemistry-genetics-and-molecular-biology/dwell-time]
- 42. Multifactorial Understanding of Ion Abundance in Tandem Mass... [https://pmc.ncbi.nlm.nih.gov/articles/PMC3768159/]
- 43. Collision Energy setting for sMRM in ABsciex 5600 [https://skyline.ms/announcements/home/support/thread.view?rowId=4975]
- 44. An HS-MRM Assay for the Quantification of Host-cell ... [https://pmc.ncbi.nlm.nih.gov/articles/PMC6100639/]
- 45. The Importance of Complete Overlapping of Analyte and ... [https://www.chromatographyonline.com/view/the-importance-of-complete-overlapping-of-analyte-and-internal-standard-peaks-in-eliminating-matrix-effects-with-liquid-chromatography-mass-spectrometry-lc-ms-]
- 46. Automated Multiple Reaction Monitoring (MRM) Method ... [https://www.waters.com/nextgen/us/en/library/application-notes/2025/automated-multiple-reaction-monitoring-mrm-method-development-for-peptide-drugs-using-waters_connect-for-quantitation-software.html?srsltid=AfmBOorLwAuzLB5AEOXGtlPGrKs3TPt5wJb0TO8D0EosOfCKpfnbolXk]
- 47. Diversity Matters: Optimal Collision for Tandem Mass... Energies [https://pmc.ncbi.nlm.nih.gov/articles/PMC9639208/]
- 48. Automated MRM Transition Optimization Using ... [https://www.waters.com/nextgen/us/en/library/application-notes/2025/automated-mrm-transition-optimization-using-waters_connect-for-quantitation-software.html?srsltid=AfmBOop9JZrROnBoc75B8gS1xXZYEwH9ApvQ2F_YFvFPVJMgbt2j1aHd]
- 49. Poster Presentations for Troubleshooting [https://www.msacl.org/program/view_abstract_selection.php?topic=Troubleshooting&event=2025]
- 50. Comparison of triple quadrupole and hybrid ... [https://pubmed.ncbi.nlm.nih.gov/40158471/]
- 51. Advancements and Emerging Techniques in Mass ... [https://www.chromatographyonline.com/view/advancements-and-emerging-techniques-in-mass-spectrometry-a-comprehensive-review]
- 52. Advantages of Transitioning from Single Quad MS to Triple ... [https://conquerscientific.com/advantages-of-transitioning-from-single-quad-ms-to-triple-quadrupole-ms/]
- 53. General Screening and Multiple Dissociation Methods for ... [https://pmc.ncbi.nlm.nih.gov/articles/PMC12268824/]
- 54. SCN 1050 does not accept a value for collision energy in the ... [https://support.waters.com/KB_Inf/MassLynx/WKB315460_SCN_1050_does_not_accept_a_value_for_collision_energy_in_the_MRM_method_editor_for_Xevo_TQ-GC]
- 55. Troubleshooting Source of Contamination on Samplers [https://community.agilent.com/knowledge/lc-portal/kmp/lc-articles/kp1097.troubleshooting-source-of-contamination-on-samplers]
- 56. Automated Multiple Reaction Monitoring (MRM) Method ... [https://www.waters.com/nextgen/us/en/library/application-notes/2025/automated-multiple-reaction-monitoring-mrm-method-development-for-peptide-drugs-using-waters_connect-for-quantitation-software.html?srsltid=AfmBOorrhrRlx7J2XfrMT7s0viUc-0wO0Zkfo5hB6pjTXxbtSMYEB-ky]
- 57. Development and application of GlycanDIA workflow for ... [https://www.nature.com/articles/s41467-025-61473-y]
- 58. A tutorial for computing limits of detection and ... [https://www.sciencedirect.com/science/article/abs/pii/S0003267021011685]
- 59. Limit of Blank, Limit of Detection and Limit of Quantitation [https://pmc.ncbi.nlm.nih.gov/articles/PMC2556583/]
- 60. PRM vs MRM: A Comparative Guide to Targeted ... [https://www.metwarebio.com/prm-vs-mrm-targeted-ms-comparison/]
- 61. PRM vs. MRM: Comparative Analysis in Quantitative ... [https://www.mtoz-biolabs.com/prm-vs-mrm-comparative-analysis-in-quantitative-proteomics.html]
- 62. Parallel Reaction Monitoring for High Resolution and High ... [https://pmc.ncbi.nlm.nih.gov/articles/PMC3494192/]
- 63. An Introduction to Advanced Targeted Acquisition Methods [https://pmc.ncbi.nlm.nih.gov/articles/PMC8600983/]
- 64. Principles of Parallel Reaction Monitoring (PRM) [https://www.creative-proteomics.com/resource/parallel-reaction-monitoring-prm-principles-techniques-applications.htm]
- 65. PRM and MRM in Targeted Proteomics: Advantages and ... [https://www.mtoz-biolabs.com/prm-and-mrm-in-targeted-proteomics-advantages-and-limitations.html]
- 66. Comparison of Quantitative Mass Spectrometry Platforms ... [https://pmc.ncbi.nlm.nih.gov/articles/PMC6021760/]
- 67. Advantages and Disadvantages of MRM/PRM Techniques [https://www.mtoz-biolabs.com/advantages-and-disadvantages-of-mrm-prm-techniques.html]
- 68. Comparison of high resolution mrm and sequential window ... [https://www.sciencedirect.com/science/article/pii/S0021967320308414]
- 69. Reduction of multiple reaction monitoring protein target list ... [https://www.sciencedirect.com/science/article/pii/S0022030222004131]
- 70. Collision energy optimization of b- and y-ions for ... - PubMed [https://pubmed.ncbi.nlm.nih.gov/20968307/]
- 71. Scout triggered MRM algorithm [https://sciex.com/tech-notes/technology/scout-triggered-mrm-algorithm-mrm-workflow]
- 72. Automated Multiple Reaction Monitoring (MRM) Method ... [https://www.waters.com/nextgen/us/en/library/application-notes/2025/automated-multiple-reaction-monitoring-mrm-method-development-for-peptide-drugs-using-waters_connect-for-quantitation-software.html?srsltid=AfmBOoqvcAF085hPrlduc0JEp0QcINGY2R1s_cSkENNvOWydGMR9GQpp]
- 73. The Scheduled MRM™ Algorithm Pro [https://sciex.com/tech-notes/technology/scheduled-mrm-algorithm-pro]
- 74. 10 Tips for Successful High Content Screening (HCS) Assays [https://www.enzo.com/note/10-tips-for-successful-high-content-screening-hcs-assays/]
- 75. Development of a UPLC-MRM-based targeted proteomic ... [https://www.nature.com/articles/s41598-022-15171-0]
- 76. Development of multiple reaction monitoring (MRM) assays ... [https://pubmed.ncbi.nlm.nih.gov/35925648/]