Automated Headspace Sampling in Pharmaceutical QC: Enhancing Accuracy, Efficiency, and Compliance
This article provides a comprehensive overview of automated headspace sampling technology and its critical role in modern pharmaceutical quality control.
Automated Headspace Sampling in Pharmaceutical QC: Enhancing Accuracy, Efficiency, and Compliance
Abstract
This article provides a comprehensive overview of automated headspace sampling technology and its critical role in modern pharmaceutical quality control. It covers foundational principles, explores advanced methodological applications for analyzing residual solvents and volatile impurities, offers practical troubleshooting guidance for common operational issues, and evaluates validation strategies and emerging comparative techniques. Tailored for researchers, scientists, and drug development professionals, this resource aims to support the implementation of robust, reliable, and efficient analytical methods that meet stringent regulatory standards.
The Role of Automated Headspace Sampling in Modern Pharmaceutical Quality Control
Core Principles of Headspace Gas Chromatography
Headspace Gas Chromatography (HS-GC) is a specialized analytical technique designed for the analysis of volatile compounds in complex solid or liquid matrices by sampling the gas phase (the "headspace") above the sample contained in a sealed vial [1]. This approach provides distinct advantages for analyzing samples where the components of interest are volatile, but the sample matrix is non-volatile or insoluble, making it ideal for pharmaceutical applications [1] [2].
The fundamental principle involves heating a sample in a sealed vial to promote the vaporization of volatile analytes. These volatiles then diffuse into the headspace above the sample until equilibrium is established between the sample and the gas phase [1] [2]. The distribution of an analyte at equilibrium is described by its partition coefficient (K), which is the ratio of its concentration in the sample phase (CS) to its concentration in the gas phase (CG): K = CS/CG [2]. A portion of this headspace gas is then transferred to the gas chromatograph for separation and analysis [1].
The detector response (A) is proportional to the concentration of the analyte in the gas phase (CG), which is governed by the equation: A ∝ CG = C0 / (K + β) Where C0 is the original concentration of the analyte in the sample, K is the partition coefficient, and β is the phase ratio (the ratio of the gas volume to the sample volume in the vial) [2]. To maximize detector response, the sum of K and β should be minimized, which is achieved by optimizing parameters such as incubation temperature and sample volume [2].
HS-GC in Pharmaceutical Quality Control
Headspace Gas Chromatography is a cornerstone technique in pharmaceutical quality control, primarily used to ensure patient safety and product quality by detecting and quantifying unwanted volatile impurities [1] [3]. Its ability to analyze complex matrices with minimal sample preparation makes it exceptionally suitable for this field.
The most prominent application is the analysis of Residual Solvents in active pharmaceutical ingredients (APIs), excipients, and finished drug products [1] [4]. These solvents, used or produced during manufacturing, offer no therapeutic benefit and may pose toxic risks if not adequately removed [4]. The United States Pharmacopeia (USP) general chapter <467> stipulates the standard method for this analysis, which is rigorously followed by the industry [2] [3]. For instance, a 2025 study developed and validated an HS-GC method for determining six residual solvents—methanol, ethyl acetate, isopropyl alcohol, triethylamine, chloroform, and toluene—in losartan potassium raw material, demonstrating the technique's critical role in verifying API purity [4].
Beyond residual solvents, HS-GC is vital for:
- Stability Testing: Monitoring the formation of volatile degradation products in drug formulations over time to determine appropriate storage conditions and expiration dates [3].
- Container Closure Integrity Testing: Detecting and quantifying volatile compounds that may migrate from the packaging material into the product, or vice versa, ensuring the packaging provides adequate protection [3].
- Drug Product Testing: Assessing the overall composition and quality of final pharmaceutical formulations to ensure accurate labeling and compliance with regulatory requirements [3].
Table 1: Key Pharmaceutical Applications of HS-GC
| Application Area | Primary Objective | Example Analytes |
|---|---|---|
| Residual Solvent Analysis (USP <467>) | Ensure safety by quantifying toxic solvents from manufacturing [4] [3]. | Methanol, Chloroform, Toluene, Triethylamine, Isopropyl Alcohol [4]. |
| Stability Testing | Determine shelf-life and storage conditions by monitoring degradation [3]. | Volatile degradation products. |
| Container Closure Integrity | Verify that packaging does not leach volatiles or compromise product [3]. | Migrants from packaging materials. |
Regulatory Framework and Solvent Classification
The International Council for Harmonisation (ICH) guideline Q3C provides a foundational framework for classifying residual solvents based on their inherent risk [4]. This classification system directly informs the establishment of strict concentration limits in pharmaceutical products.
Table 2: ICH Classification of Residual Solvents with Examples
| Class | Risk Description | Solvent Examples | Concentration Limits |
|---|---|---|---|
| Class 1 | Solvents to be avoided (known human carcinogens, strong environmental hazards) | Benzene, Carbon tetrachloride | Strict limits (e.g., 2 ppm for benzene) |
| Class 2 | Solvents to be limited (nongenotoxic animal carcinogens, other irreversible toxicities) | Methanol, Chloroform, Toluene, Triethylamine [4] | Limits based on permitted daily exposure (PDE), typically in ppm range |
| Class 3 | Solvents with low toxic potential | Isopropyl Alcohol, Ethyl Acetate [4] | Higher limits (e.g., 5000 ppm or 0.5%) |
Experimental Protocols: Residual Solvent Analysis in an API
The following detailed protocol is adapted from a 2025 study that developed and validated an HS-GC method for the determination of six residual solvents in losartan potassium raw material [4].
Materials and Instrumentation
- API Sample: Losartan potassium raw material [4].
- Target Residual Solvents: Methanol, Ethyl acetate, Isopropyl alcohol, Triethylamine, Chloroform, Toluene [4].
- Diluent: Dimethylsulfoxide (DMSO), GC grade. The high boiling point of DMSO (189°C) minimizes interference during analysis [4].
- Instrumentation: Agilent 7890A Gas Chromatograph equipped with a Flame Ionization Detector (FID) and an Agilent 7697A Headspace Sampler [4].
- GC Column: Agilent DB-624 capillary column (30 m × 0.53 mm × 3 µm film thickness) [4].
Preparation of Standard and Sample Solutions
- Standard Solution: Prepare stock solutions of each solvent and dilute in DMSO to final concentrations based on ICH specification limits. Example concentrations used in the study were: Methanol (600 µg/mL), Isopropyl Alcohol (1000 µg/mL), Ethyl Acetate (1000 µg/mL), Chloroform (12 µg/mL), Triethylamine (1000 µg/mL), and Toluene (178 µg/mL) [4].
- Sample Solution: Accurately weigh 200 mg of the losartan potassium API into a 20 mL headspace vial. Add 5.0 mL of DMSO, cap, and crimp the vial immediately to prevent loss of volatiles [4].
- Vortex: Shake all vials on a vortex shaker for 1 minute to ensure proper mixing and dissolution [4].
Instrumental Conditions
Table 3: Detailed HS-GC Method Conditions [4]
| Parameter | Setting |
|---|---|
| Headspace Conditions | |
| Equilibration Time | 30 minutes |
| Equilibration Temperature | 100 °C |
| Syringe Temperature | 105 °C |
| Transfer Line Temperature | 110 °C |
| Pressurization Time | 1 minute |
| GC Conditions | |
| Column | DB-624 (30 m × 0.53 mm × 3 µm) |
| Carrier Gas & Flow | Helium, constant flow of 4.718 mL/min |
| Oven Temperature | 40°C (hold 5 min) → 160°C @ 10°C/min → 240°C @ 30°C/min (hold 8 min) |
| Inlet Temperature | 190 °C |
| Split Ratio | 1:5 |
| Detector (FID) | Temperature: 260 °C |
| Total Run Time | 28 minutes |
Validation Data and Results
The developed method was validated according to Brazilian guidelines (RDC 166/2017) and proved to be [4]:
- Selective: Able to identify all target solvents in the API without interference.
- Linear: Correlation coefficient (r) ≥ 0.999 for all solvents' standard curves.
- Precise: Relative standard deviations (RSD) for repeatability and intermediate precision were ≤ 10.0%.
- Accurate: Average recoveries ranged from 95.98% to 109.40%.
- Sensitive: Limits of quantification (LOQ) were below 10% of the ICH specification limits for each solvent.
Analysis of a losartan potassium batch detected only isopropyl alcohol and triethylamine, confirming the effectiveness of the purification process in removing most synthesis solvents [4].
The Scientist's Toolkit: Essential Research Reagent Solutions
Table 4: Key Materials and Reagents for HS-GC Analysis
| Item | Function / Purpose |
|---|---|
| DB-624 or similar mid-polarity GC column | A 6% cyanopropylphenyl / 94% dimethyl polysiloxane stationary phase ideal for separating volatile organic compounds like residual solvents [4]. |
| Dimethylsulfoxide (DMSO), GC grade | High-boiling point solvent used to dissolve samples; minimizes interference and is suitable for a wide range of APIs [4]. |
| High-purity Helium, Nitrogen, or Hydrogen | Serves as the inert carrier gas to transport vaporized analytes through the chromatographic system [1]. |
| Sealed Headspace Vials (e.g., 20 mL) with Crimp Caps | Specialized vials designed to maintain a consistent and sealed environment for sample equilibration and to prevent the loss of volatile analytes [2] [4]. |
| Certified Reference Standards | High-purity solvents for preparing calibration standards, essential for accurate method development, validation, and quantification [4]. |
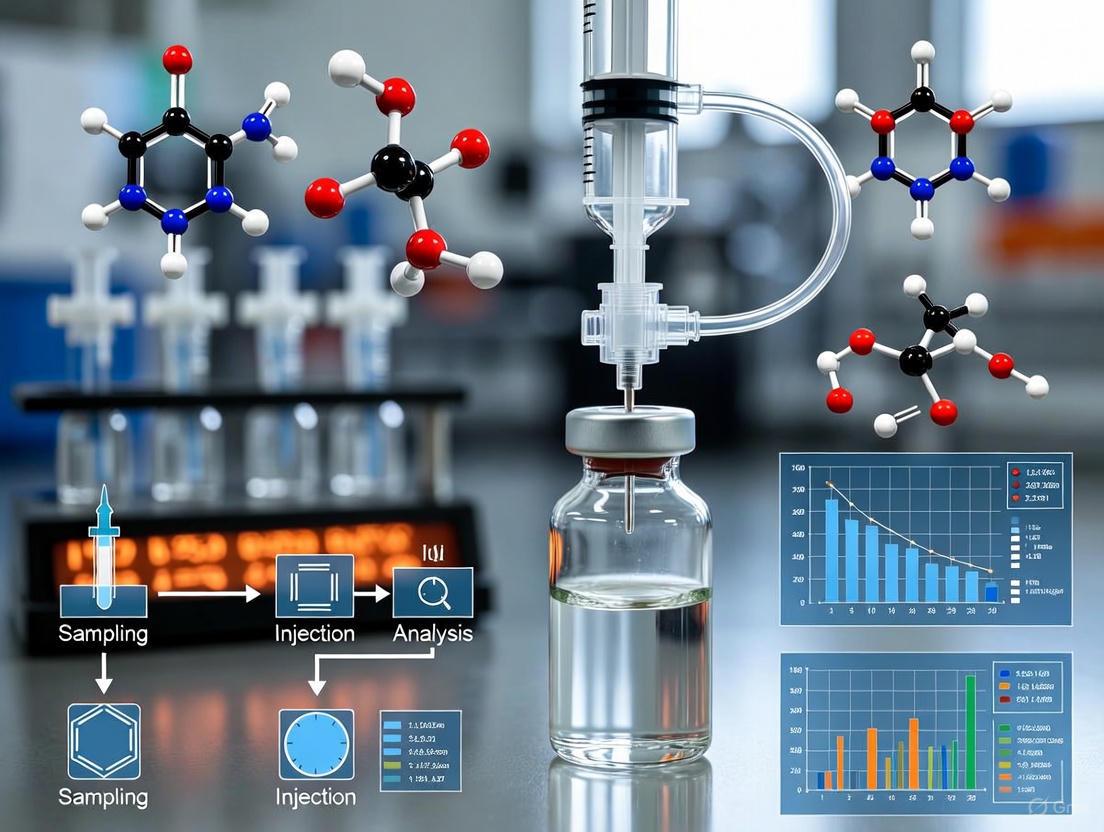
Workflow and Signaling Pathways
The following diagram illustrates the logical workflow and component relationships in a static headspace gas chromatography system, from sample preparation to data analysis.
The headspace sampling process, particularly in a valve-and-loop system, can be broken down into three key automated steps that occur after vial equilibration.
Residual solvents are volatile organic chemicals used in or produced during the synthesis of drug substances, excipients, or drug product formulation. These solvents provide no therapeutic benefit and may be harmful to patient safety, affecting efficacy, stability, and toxicity profiles. Consequently, regulatory agencies worldwide mandate strict control of residual solvents in finished pharmaceutical products.
The International Council for Harmonisation (ICH) Q3C guideline and United States Pharmacopeia (USP) general chapter <467> provide the primary frameworks for classifying residual solvents and establishing permissible limits. These guidelines classify solvents into three categories based on risk: Class 1 (solvents to be avoided), Class 2 (solvents with limited use), and Class 3 (solvents with low toxic potential). Adherence to these regulations is not optional but a mandatory requirement for pharmaceutical quality assurance [5] [6].
Automated headspace sampling techniques have emerged as critical enablers for regulatory compliance, offering the precision, reproducibility, and throughput necessary for modern pharmaceutical quality control laboratories. This application note details the regulatory drivers and analytical protocols supporting residual solvents analysis within pharmaceutical quality control frameworks.
Regulatory Framework and Classification
The ICH Q3C guideline, legally effective in November 2021, and USP <467> form the cornerstone of residual solvents control, providing Permissible Daily Exposure (PDE) limits for commonly used solvents [5]. The European Pharmacopoeia (Ph. Eur.) general chapter 2.4.24 similarly adopts these principles [7].
These regulations emerged from the fundamental recognition that complete solvent removal is often impractical from a manufacturing standpoint, making controlled trace levels inevitable in final products [6]. The regulatory framework places the onus on manufacturers to establish suitable analytical procedures and justify solvent use when necessary [5].
Table 1: Residual Solvent Classification and Limits According to ICH Q3C
| Class | Risk Profile | Examples | Permitted Concentration (ppm) |
|---|---|---|---|
| Class 1 | Solvents with unacceptable toxicities | Benzene (1 ppm) | Strictly limited or avoided [5] |
| Class 2 | Solvents with inherent toxicity | n-Hexane (290 ppm) | Limited based on PDE [7] [8] |
| Class 3 | Solvents with low toxic potential | Acetone (5000 ppm), Ethanol | Less stringent limits [7] [8] |
Analytical Methodologies
Established Chromatographic Techniques
Gas Chromatography (GC) remains the dominant analytical technique for residual solvent analysis due to its exceptional selectivity, sensitivity, and compatibility with volatile compounds [6]. The two primary sample introduction techniques are static Headspace-GC (HS-GC) and direct-injection GC.
Static Headspace-GC (HS-GC) is the preferred technique for regulatory testing, particularly for samples soluble in water or organic solvents [7]. This approach involves heating the sample in a sealed vial to partition volatile compounds into the headspace, then injecting this vapor into the GC system. Key advantages include:
- Protection of GC instrumentation: Non-volatile sample matrices remain in the vial, preventing liner degradation and artifact formation [8].
- Enhanced capability: Effectively handles challenging materials with poor solubility through heated vial shaking [8].
- Automation readiness: Ideal for high-throughput, unattended operation in regulated environments [9].
Direct-Injection GC, while historically significant, sees declining use due to limitations including potential instrument contamination and matrix effects [6].
Emerging Direct Mass Spectrometry Techniques
Selected Ion Flow Tube Mass Spectrometry (SIFT-MS) represents a technological advancement that transforms volatile impurities analysis through chromatography-free operation. This technique utilizes soft chemical ionization with multiple reagent ions and mass spectrometric detection for real-time, quantitative analysis [10] [11].
SIFT-MS applications in pharmaceutical analysis include:
- Residual solvent analysis as an alternative procedure for USP
<467>[10] - Formaldehyde analysis without derivatization in various excipients [10] [11]
- High-throughput screening for nitrosamine residues in drug products [10]
- Ethylene oxide analysis in cleaning validation samples [10]
Comparative studies demonstrate SIFT-MS provides an 11-fold increase in sample throughput with accuracy superior or comparable to GC-FID, significantly reducing time-to-results [10] [11].
Experimental Protocols
Platform Headspace GC Method for Multiple Residual Solvents
This protocol describes a high-throughput HS-GC-FID method for simultaneous determination of 27 Class 2 and Class 3 residual solvents, optimized for minimal solvent consumption and maximum efficiency [8].
Table 2: Platform HS-GC-FID Method Parameters
| Parameter | Specification |
|---|---|
| GC System | TRACE 1600 Series or equivalent [9] |
| Autosampler | TriPlus 500 HS Autosampler or equivalent [9] |
| Column | Fused silica capillary column (e.g., 30 m × 0.32 mm ID, 1.8 µm film thickness) [8] |
| Carrier Gas | Helium or Hydrogen |
| Injection | Split (40:1) [8] |
| Detection | Flame Ionization Detector (FID) |
| Headspace Oven Temp | 60–120°C (depending on diluent) [8] |
| Diluent | N-Methyl-2-pyrrolidone (NMP, headspace grade) [8] |
Sample Preparation:
- Weigh approximately 100 mg of pharmaceutical sample (drug substance or excipient) into a 20 mL headspace vial
- Add 1 mL of N-methyl-2-pyrrolidone (NMP) diluent and seal immediately with crimp caps
- For standard preparation, dilute 1 mL of custom stock standard containing target solvents with 9 mL of NMP [8]
Method Qualification: Validate according to ICH Q2(R1) guidelines for the following parameters [8]:
- Specificity: No interference from sample matrix at retention times of target solvents
- Linearity: Correlation coefficients ≥0.999 for all solvents across relevant concentration ranges
- Accuracy: Average recoveries between 93-107% for spiked samples
- Precision: Repeatability with RSD ≤2.1%
- LOQ: Demonstrated for all target solvents
- Solution Stability: Standards and samples stable for ≥10 days at room temperature in sealed vials
Multiple Headspace Extraction (MHE) for Challenging Matrices
For matrices where standard preparation is difficult (polymers, gels), MHE provides quantitative analysis through sequential headspace measurements. When coupled with SIFT-MS detection, this workflow becomes practical for routine use [11].
Procedure:
- Place sample in headspace vial and seal
- Incubate at optimized temperature (e.g., 140°C for polystyrene)
- Perform first headspace analysis via SIFT-MS injection (<2 minutes)
- Purge vial by removing seal briefly or using automated purge tool
- Re-equilibrate vial at incubation temperature
- Repeat steps 3-5 for 5-6 total extraction cycles [11]
Data Analysis: Plot natural logarithm of analyte peak area versus extraction number. The negative slope of this linear relationship represents the extraction constant, enabling calculation of total analyte mass through exponential extrapolation [11].
The Scientist's Toolkit
Table 3: Essential Research Reagents and Materials
| Item | Function | Application Notes |
|---|---|---|
| Headspace-Grade Solvents | Sample dissolution medium | Ultra-pure solvents (NMP, DMSO, water) tested specifically for volatile impurities [9] [8] |
| Custom Stock Standards | Method calibration | Pre-made mixtures of Class 2/3 solvents simplify workflow and reduce errors [8] |
| High-Boiling-Point Diluents | Sample matrix | NMP, DMSO, DMA enable analysis of poorly soluble pharmaceuticals [6] [8] |
| Static Headspace Autosampler | Automated sample introduction | TriPlus 500 HS or equivalent provides temperature control and vial agitation [9] |
| Capillary GC Columns | Compound separation | 30m x 0.32mm ID, 1.8µm film thickness suitable for diverse solvent mixtures [8] |
| SIFT-MS Instrument | Direct mass spectrometry | Syft Tracer or Voice200ultra for real-time, chromatography-free analysis [10] [11] |
Workflow Visualization
Stringent regulatory requirements for residual solvents and volatile impurities represent a critical quality attribute in pharmaceutical manufacturing. Compliance with ICH Q3C and USP <467> guidelines is non-negotiable for patient safety and product approval. Automated headspace sampling technologies, particularly static HS-GC and emerging SIFT-MS platforms, provide the analytical foundation for meeting these requirements through robust, sensitive, and high-throughput methodologies. The experimental protocols detailed herein enable pharmaceutical scientists to implement compliant residual solvent testing frameworks suitable for modern quality control laboratories.
Market Growth and Technological Adoption Trends in the Pharma Industry
The pharmaceutical industry's unwavering commitment to drug safety and efficacy has positioned advanced analytical technologies as a cornerstone of modern quality control. Within this landscape, automated headspace sampling has emerged as a critical tool for detecting and quantifying volatile impurities, directly supporting compliance with stringent global regulations [12]. This technique is integral to a broader industrial shift towards digitization and automation, which are revolutionizing quality control labs by enhancing productivity, reducing human error, and enabling faster release times [13]. This article details the market forces propelling the adoption of automated headspace sampling and provides detailed protocols for its application in pharmaceutical quality control, framing these within the industry's ongoing technological transformation.
The market for headspace sampling technology is experiencing robust growth, underpinned by rising demand across multiple industries. The global headspace samplers market was valued at approximately USD 1.2 billion in 2023 and is projected to reach USD 2.3 billion by 2032, growing at a Compound Annual Growth Rate (CAGR) of 7.6% [14]. The North American market, in particular, is a key hub for this growth. It is projected to grow at a CAGR of approximately 6-8% over the next five years, driven by a robust industrial base, stringent compliance requirements, and a strong focus on research and development [15].
Table 1: Global Headspace Samplers Market Overview and Forecast
| Attribute | Detail |
|---|---|
| Market Size (2023) | USD 1.2 Billion [14] |
| Projected Market Size (2032) | USD 2.3 Billion [14] |
| Forecast Period CAGR | 7.6% [14] |
| Key Growth Driver | Stringent regulatory requirements for volatile compound analysis [14] |
This growth is primarily fueled by several interconnected factors:
- Regulatory Compliance: Adherence to strict pharmacopeial methods such as USP <467> and ICH Q3C guidelines for residual solvent analysis is a non-negotiable requirement for pharmaceutical manufacturers, making robust analytical techniques like headspace-GC essential [12] [16].
- Demand for Efficiency: Automated headspace sampling significantly reduces manual sample preparation, leading to more reproducible results, higher instrument uptime, and greater laboratory throughput [16].
- Expanding Application Scope: The technique is indispensable across various critical areas, including residual solvent profiling in active pharmaceutical ingredients (APIs), raw material screening, packaging interaction studies (leachables), and cleaning validation [12].
Technological Fundamentals of Headspace Sampling
Headspace sampling is a technique for analyzing the volatile components in a sample by examining the gas layer (the "headspace") above a solid or liquid sample in a sealed vial [16]. This method is particularly advantageous for samples where the matrix is non-volatile, viscous, or complex, as it minimizes the introduction of non-volatile materials into the Gas Chromatography (GC) system, thereby protecting the instrumentation and simplifying the resulting chromatogram [16] [17].
The process relies on establishing an equilibrium between the sample (liquid/solid phase) and the headspace (gas phase) at a controlled temperature [16]. The concentration of an analyte in the headspace (C_G) is governed by its original concentration in the sample (C_0), the partition coefficient (K), and the phase ratio (β), as described by:
A ∝ CG = C0 / (K + β) [16].
Key parameters for optimizing this equilibrium to maximize detector response include:
- Sample Volume and Vial Size: Adjusting the phase ratio (
β) by using larger vials (e.g., 20-mL vs. 10-mL) or increasing the sample volume within the same vial can enhance sensitivity [16]. - Temperature Control: Increasing the equilibration temperature reduces the partition coefficient (
K), driving more volatile analytes into the headspace and increasing signal intensity. The optimal temperature is typically about 20 °C below the solvent's boiling point [16]. - Equilibration Time: Sufficient time must be allowed for the system to reach equilibrium, which is determined experimentally for each sample type [16].
Automated systems, such as valve-and-loop and pressure-balanced samplers, have largely replaced manual syringe injection. Pressure-balanced systems offer a key advantage by using precisely regulated carrier gas pressures to transfer the sample, minimizing variability and contamination sources found in other systems [17].
Detailed Experimental Protocols
Protocol 1: Residual Solvent Analysis per USP <467>
This protocol is designed for the quantitative determination of Class 1, 2, and 3 residual solvents in pharmaceutical drug substances and products, ensuring compliance with USP <467> and ICH Q3C guidelines [12].
Materials and Reagents
Table 2: Essential Research Reagent Solutions for Residual Solvent Analysis
| Item | Function/Description | Critical Parameters |
|---|---|---|
| Headspace Vials | Container for sample incubation and vapor generation [16]. | 10-mL or 20-mL capacity; must seal tightly with crimp caps to prevent volatile loss [16]. |
| GC Column | Stationary phase for chromatographic separation of volatile compounds. | Mid-polarity column (e.g., 6% cyanopropylphenyl / 94% dimethylpolysiloxane, 30 m x 0.32 mm ID, 1.8 µm film thickness). |
| Certified Reference Standards | Calibration and identification of target solvents (e.g., methanol, acetone, toluene) [12]. | Must cover all Class 1, 2, and 3 solvents of interest; prepared in appropriate solvent (e.g., DMF or water). |
| Internal Standard (e.g., Acetonitrile) | Corrects for injection volume variability and sample matrix effects [12]. | Chosen to not co-elute with any target analyte or sample components. |
| Suitable Solvent (Water/DMF) | Diluent for sample and standard preparation [12]. | Must be of high purity and free of interfering volatile impurities. |
Equipment and Instrumentation
- Automated Headspace Sampler (e.g., Agilent 7697A or equivalent pressure-balanced system)
- Gas Chromatograph equipped with a Flame Ionization Detector (FID)
- Analytical Balance (capable of weighing to 0.1 mg)
- Ultrasonic Bath (for sample dissolution)
Step-by-Step Procedure
- Sample Preparation:
- Weigh accurately 100-500 mg of the homogenized API or drug product into a 20-mL headspace vial [12].
- Add 1.0 mL of an appropriate solvent (e.g., water for water-soluble products, DMF for water-insoluble) containing the internal standard.
- Immediately crimp-seal the vial with a PTFE-faced septum to prevent loss of volatiles.
- Standard Preparation:
- Prepare a stock solution containing all target residual solvents at a known concentration.
- Serially dilute the stock solution to create a calibration curve, transferring 1.0 mL of each standard solution into separate headspace vials and sealing.
- Instrumental Parameters:
- Headspace Sampler:
- Oven Temperature: 80 °C [12]
- Loop Temperature: 90 °C
- Transfer Line Temperature: 95 °C
- Vial Equilibration Time: 45 minutes
- Pressurization Time: 1.0 minute
- Gas Chromatography:
- Inlet: Split (10:1 ratio), Temperature: 200 °C
- Carrier Gas: Helium, constant flow 1.5 mL/min
- Oven Program: 40 °C (hold 10 min), ramp to 240 °C at 20 °C/min (hold 5 min)
- Flame Ionization Detector (FID): Temperature: 250 °C
- Headspace Sampler:
- Analysis and Quantification:
- Inject samples and standards in sequence.
- Plot a calibration curve of peak area ratio (analyte/internal standard) versus concentration for each solvent.
- Use the linear regression equation from the calibration curve to calculate the concentration of residual solvents in the unknown samples.
Protocol 2: Multiple Headspace Extraction (MHE) for Complex Matrices
MHE is a quantitative technique used for challenging samples where the matrix interferes with standard headspace analysis, such as solids or samples for which matching calibration standards are difficult to prepare [18].
Principle
MHE involves performing a series of successive headspace extractions from the same sample vial. The analyte concentration decreases exponentially with each extraction. By measuring the peak areas from at least two consecutive extractions (A1, A2...), the total original amount of analyte in the sample can be calculated without being affected by the sample matrix [18].
Procedure
- Prepare the sample in a headspace vial as described in Protocol 1.
- Analyze the vial using standard headspace-GC conditions to obtain the first peak area (
A1). - Without replacing the vial's septum, immediately re-equilibrate the vial in the headspace oven for the same duration to establish a new equilibrium.
- Perform a second analysis from the same vial to obtain the second peak area (
A2). - Calculation: The total peak area corresponding to the original analyte concentration is calculated using the formula: ΣAn = A1² / (A1 - A2) [18]. This total area (ΣAn) is then used for quantification against a standard curve prepared using the same MHE procedure.
The Broader Context: Automation in Pharmaceutical Quality Control
The adoption of automated headspace sampling is a specific manifestation of a larger, industry-wide movement towards smart quality control. This transformation is characterized by three evolutionary horizons [13]:
- Horizon 1: Digitally Enabled Labs: This stage focuses on eliminating manual transcription and second-person verification through integration between equipment and Laboratory Information Management Systems (LIMS), leading to significant reductions in documentation work and deviations [13].
- Horizon 2: Automated Labs: This involves using robotics and advanced automation for repeatable tasks like sample preparation and delivery. Technologies like automated headspace samplers and automated QC platforms fit here, improving throughput, data integrity, and consistency [13].
- Horizon 3: Distributed Quality Control: The most advanced stage, where testing moves from centralized labs to the production line, enabling real-time release. This requires deep collaboration between R&D and operations from the earliest stages of product development [13].
The benefits of this automation journey are substantial, with well-performing labs achieving 50-100% productivity improvements and reducing overall deviations by over 65% [13]. Automated systems in cell therapy manufacturing, for example, enhance aseptic assurance and scalability by minimizing manual interventions and associated contamination risks [19]. Furthermore, regulatory trends are aligning with this shift, as seen with the FDA's upcoming Quality Management System Regulation (QMSR), which emphasizes a risk-based approach and requires more comprehensive upfront documentation of quality controls [20].
Automated headspace sampling represents a critical and growing technology at the intersection of analytical science and pharmaceutical manufacturing. Its value proposition—enabling precise, compliant, and efficient monitoring of volatile impurities—is firmly supported by strong market growth and its alignment with the industry's strategic push towards full laboratory automation and digitization. The detailed protocols provided for residual solvent analysis and multiple headspace extraction offer researchers and quality control professionals actionable methodologies to implement this powerful technique, thereby contributing to the overarching goal of ensuring the highest standards of drug safety and quality.
Headspace Gas Chromatography (HS-GC) is an indispensable automated sample introduction technique for analyzing volatile organic compounds (VOCs) in pharmaceutical materials. By sampling the gas layer (headspace) above a solid or liquid sample in a sealed vial, HS-GC effectively prevents non-volatile matrix components from entering the GC system, thereby simplifying sample preparation, reducing maintenance, and extending instrument uptime [21]. This technique is particularly vital for adhering to stringent regulatory requirements for residual solvent testing as mandated by International Council for Harmonisation (ICH) Q3C guidelines and United States Pharmacopeia (USP) methods such as <467> [8] [21]. Static and dynamic headspace sampling represent the two primary operational modes, each with distinct mechanisms, performance characteristics, and application niches within the quality control laboratory.
Core Principles and Theoretical Foundations
Static Headspace Sampling
Static headspace is an equilibrium-based technique. The sample is placed in a sealed vial and heated at a controlled temperature to facilitate the transfer of volatile analytes from the sample matrix into the headspace gas [22]. Once the system reaches equilibrium—a state where the rate of analyte evaporation from the condensed phase equals its rate of condensation—a portion of the headspace vapor is extracted and transferred to the GC for analysis [23] [24]. The underlying theory is governed by a form of Raoult's Law or, for low analyte concentrations, Henry's Law, which states that the vapor pressure of a compound above a solution is proportional to its mole fraction in that solution [25].
The fundamental relationship describing the concentration of an analyte in the gas phase ((CG)) is given by: [ CG = \frac{C0}{K + \beta} ] where (C0) is the original analyte concentration in the sample, (K) is the partition coefficient (analyte concentration in sample liquid divided by concentration in headspace gas, or (K = CS / CG)), and (\beta) is the phase ratio (volume of headspace gas divided by volume of sample liquid, or (\beta = VG / VL)) [25] [24] [21]. To maximize detector response, the sum (K + \beta) must be minimized, which is achieved by optimizing factors like temperature, sample volume, and matrix composition [21].
Figure 1: Static Headspace Workflow. The process relies on achieving equilibrium before sampling a defined aliquot of the headspace.
Dynamic Headspace Sampling
Dynamic headspace, in contrast, is an exhaustive extraction technique. Instead of allowing equilibrium to establish, an inert gas, such as helium or nitrogen, continuously purges the sample, sweeping volatile compounds out of the vial and onto a secondary device—typically an adsorptive trap [22] [24]. This process continues for a set time, effectively transferring and concentrating analytes from the sample onto the trap. Once the sampling is complete, the trap is rapidly heated to desorb the collected compounds into the GC carrier gas stream for analysis [22]. A final high-temperature bake step cleans the trap, preparing it for the next analysis [22]. Since it does not rely on an equilibrium state, dynamic headspace can achieve significantly higher preconcentration factors, leading to superior sensitivity for trace-level analytes compared to the static approach [26] [22].
Figure 2: Dynamic Headspace Workflow. The process uses a continuous gas flow to exhaustively transfer analytes onto a concentrating trap.
Comparative Technical and Performance Analysis
A systematic comparison of six automated headspace techniques revealed clear performance differences categorized by their fundamental mode of operation [26].
Table 1: Quantitative Performance Comparison of Headspace Sampling Techniques [26]
| Technique Class | Specific Technique | Typical Extraction Yield | Typical Method Detection Limit (MDL) | Key Characteristics |
|---|---|---|---|---|
| Static Sampling | Syringe or Loop | ~10-20% | ~100 ng/L (ppt) | Simplicity, good for major volatiles. |
| Static Enrichment | SPME, PAL SPME Arrow | Up to ~80% | Picogram/L (ppq) range | Higher sensitivity, susceptible to competitive adsorption [27]. |
| Dynamic Enrichment | ITEX, Trap Sampling | High (exhaustive) | Picogram/L (ppq) range | Highest sensitivity, requires trap management. |
The choice between static and dynamic sampling profoundly impacts quantitative performance. While basic static sampling (syringe/loop) provides robust and precise analysis (Relative Standard Deviations, RSDs, below 27%) for relatively high-concentration analytes, enrichment techniques (both static and dynamic) lower detection limits by orders of magnitude through analyte preconcentration [26]. It is crucial to note that techniques employing adsorptive phases (like Carboxen in SPME or trap materials) can be subject to competitive adsorption in multi-analyte mixtures, where compounds with higher affinity for the sorbent can displace those with lower affinity, potentially compromising quantitation if not properly managed [27].
Table 2: Operational Comparison of Static vs. Dynamic Headspace Sampling
| Parameter | Static Headspace | Dynamic Headspace |
|---|---|---|
| Fundamental Principle | Equilibrium | Exhaustive extraction |
| Sensitivity | Good for medium-high volatility | Excellent, superior for trace-level volatiles [22] |
| Linear Range | Wider in static mode for low-affinity analytes [27] | Can be narrower for low-affinity analytes due to competition [27] |
| Quantitative Nature | Quantitative for equilibrium state [23] | Quantitative with careful control of purge and trap conditions |
| Sample Throughput | Generally high | Can be lower due to longer purge/desorb/bake cycles |
| Regulatory Usage | USP <467> Residual Solvents [24] |
USEPA Method 524.2 for water analysis [24] |
| Complexity & Cost | Lower | Higher (requires trap and associated hardware) |
Detailed Experimental Protocols for Pharmaceutical Applications
Protocol 1: Static Headspace Analysis of Residual Solvents in a Drug Substance
This protocol is adapted from a platform method for the determination of 27 Class 2 and 3 residual solvents in pharmaceutical materials, which demonstrated significant improvements in sustainability by reducing diluent consumption from liters to milliliters per analysis [8].
4.1.1 Research Reagent Solutions Table 3: Essential Materials and Reagents
| Item | Function / Specification |
|---|---|
| Headspace Vials | 20 mL, sealed with PTFE-faced septa and aluminum crimp caps. |
| Diluent | N-Methyl-2-pyrrolidone (NMP, headspace grade). |
| Stock Standard | Custom-made standard containing target residual solvents at known concentrations in appropriate diluent. |
| GC Column | Fused-silica capillary column (e.g., 5%-phenyl polysiloxane equivalent). |
| Carrier Gas | High-purity Helium or Hydrogen. |
4.1.2 Procedure
- Standard Preparation: Dilute the stock standard quantitatively with NMP to prepare working standards covering the required calibration range (e.g., 1 mL stock into 9 mL diluent) [8].
- Sample Preparation: Precisely weigh an appropriate amount of the drug substance (e.g., ~100 mg) into a 20 mL headspace vial. Add 1.0 mL of NMP diluent, immediately cap the vial, and vortex to dissolve or suspend the sample uniformly [8].
- Headspace Instrument Conditions:
- Equilibration Temperature: 80-120 °C (optimize based on diluent and analytes).
- Equilibration Time: 15-30 minutes (with vial shaking if available).
- Loop/Transfer Line Temperature: >20 °C above equilibration temperature to prevent condensation.
- Carrier Gas Pressure & Flow: Optimized for the specific GC method.
- GC Analysis Conditions:
- Injection: Split (e.g., 40:1 split ratio) [8].
- Inlet Temperature: ~150 °C.
- Oven Program: Temperature ramp from low initial temperature (e.g., 40 °C) to a final high temperature (e.g., 240 °C) to separate all solvents.
- Detection: Flame Ionization Detector (FID) at ~250 °C.
- Quantitation: Use an external standard calibration curve generated from the working standards. Ensure sample and standard vials are of identical size and prepared with similar volumes to maintain a consistent phase ratio ((\beta)) [24].
Protocol 2: Multiple Headspace Extraction (MHE) for Challenging Matrices
MHE is a powerful technique for quantifying volatiles in matrices where creating a blank for matrix-matched calibration is difficult or impossible, such as polymers, gels, or solid drug products [11]. It involves performing a series of sequential static headspace extractions from the same vial until the analyte is completely removed, allowing for quantitation without a matching standard.
4.2.1 Procedure
- Sample Preparation: Place a accurately weighed solid sample (e.g., powdered tablet, polymer pellet) directly into a 20 mL headspace vial and seal.
- MHE Analysis:
- Incubate the vial at the optimized temperature to reach equilibrium.
- Perform the first headspace injection into the GC.
- The vial is automatically vented/purged after injection.
- The vial is allowed to re-equilibrate for the same fixed time.
- The process is repeated for a total of 5-7 extractions per vial [11].
- Data Analysis: The peak areas from the successive extractions form a exponential decay curve. The total amount of analyte in the sample is determined by mathematically extrapolating the sum of this decay series to infinity [11]. Modern approaches using Selected Ion Flow Tube Mass Spectrometry (SIFT-MS) can drastically accelerate this workflow, enabling analysis of up to 12 samples per hour [11].
Protocol 3: Dynamic Headspace (Purge and Trap) for Trace-Level Impurities
This protocol is indicated for the detection of volatile impurities, such as nitrosamines (e.g., N-Nitrosodimethylamine, NDMA) or genotoxic solvents, at ultra-trace levels (e.g., low ng/g) in drug products where static headspace lacks the required sensitivity [11].
4.3.1 Procedure
- Sample Preparation: Suspend or dissolve the sample in an appropriate high-purity aqueous or organic solvent in a dynamic headspace vessel (sparging vial).
- Purge Phase: The sample is purged with a continuous stream of inert gas (He or N₂) for a defined time (e.g., 10-20 minutes) at a controlled temperature. Volatile analytes are transferred from the sample to the gas stream.
- Trap Phase: The gas stream passes through a sorbent trap (e.g., Tenax, carbon-based sorbents) at ambient or slightly sub-ambient temperature, where the analytes are focused.
- Desorb Phase: Upon completion of the purge, the trap is rapidly heated (e.g., to 200-250 °C) while the carrier gas flow is directed through it, backflushing the trapped volatiles into the GC inlet.
- Bake Phase: After desorption, the trap is heated to a higher temperature and flushed with carrier gas to remove any residual compounds, preparing it for the next analysis.
- GC/MS Analysis: Analysis is typically performed using GC coupled with Mass Spectrometry (MS) for definitive identification and sensitive quantitation of the desorbed trace impurities.
Critical Method Optimization Parameters
The performance of any headspace method is highly dependent on several key parameters:
- Temperature: Increasing the equilibration temperature generally decreases the partition coefficient (K), forcing more analyte into the headspace and increasing sensitivity. This effect is most pronounced for analytes with high solubility in the sample matrix (high K) [24] [21]. Temperature must be controlled with high precision (±0.1 °C) for reproducible results with such analytes [25].
- Phase Ratio (β): Defined as the ratio of headspace volume to sample volume ((VG/VL)). Using a larger sample volume in a given vial size decreases β, which can increase the gas phase concentration of analytes with intermediate K values [25] [21]. A common practice is to use a 10 mL sample in a 20 mL vial (β = 1) [25].
- Equilibration Time: Sufficient time must be allowed for the system to reach equilibrium. This is dependent on analyte diffusivity, viscosity of the matrix, and temperature. Agitation (shaking) of the vial in the autosampler oven can significantly reduce the time required to reach equilibrium [21].
- Salting Out: Adding a high concentration of a salt like potassium chloride to an aqueous sample increases the ionic strength, reducing the solubility of polar organic analytes and driving them into the headspace, thereby improving sensitivity [25] [23].
- Sample Matrix: The composition of the sample matrix profoundly influences the partition coefficient K. Where possible, calibration standards should be prepared in a matrix that is identical to the sample ("matrix-matched") to ensure accurate quantitation [25].
Static and dynamic headspace sampling are both powerful, automated techniques that play a critical role in modern pharmaceutical quality control. Static headspace offers a robust, straightforward, and high-throughput solution for the analysis of volatile residuals and impurities, as enshrined in pharmacopeial methods. Its equilibrium nature makes it highly quantitative and reproducible when parameters are well-controlled. Dynamic headspace, with its exhaustive extraction and preconcentration capabilities, provides the superior sensitivity necessary for monitoring genotoxic impurities and other analytes at ultratrace levels, albeit with greater operational complexity.
The choice between these techniques is not one of superiority but of strategic application. The development of greener, more efficient static methods [8] and the integration of advanced detection techniques like SIFT-MS to streamline demanding protocols like MHE [11] underscore the ongoing innovation in this field. Ultimately, a thorough understanding of the core principles, performance characteristics, and optimization strategies for both static and dynamic headspace sampling empowers scientists to select and validate the most appropriate, reliable, and efficient method to ensure drug safety and quality.
In the highly regulated pharmaceutical industry, ensuring the safety and quality of drug products is paramount. The analysis of residual solvents in active pharmaceutical ingredients (APIs) and finished products is a critical quality control (QC) step, as these volatile organic compounds can be toxic [28]. Automated headspace gas chromatography (HS-GC) has emerged as a preferred technique for this analysis, offering a combination of sensitivity, reproducibility, and high-throughput capabilities that manual methods cannot match [29] [30]. The reliability of this technique, however, is fundamentally dependent on the selection and integration of its core physical components: the autosampler, vials, and septa.
This article details the essential considerations for these components, providing application notes and protocols framed within the context of pharmaceutical quality control research for scientists and drug development professionals. The global headspace autosampler market, a testament to the technique's adoption, is experiencing robust growth, projected to reach a significant market size and demonstrating a strong compound annual growth rate (CAGR), largely driven by stringent pharmaceutical QC requirements [29] [31].
Table 1: Global Market Outlook for Headspace Autosamplers
| Metric | Value | Source/Timeframe |
|---|---|---|
| Market Size in 2025 | $250 Million - $1.2 Billion | [29] [31] |
| Projected CAGR | 7.0% - 12.5% | 2025-2033 [29] [31] |
| Dominant Application Segment | Pharmaceuticals | [29] [31] |
| Dominant Type Segment | Fully Automatic Systems | [29] [31] |
The Scientist's Toolkit: Essential Components for Automated Headspace Analysis
The integrity of an automated headspace analysis is built upon a foundation of three core physical components. Proper selection is critical for method accuracy, precision, and compliance.
Table 2: Essential Materials for Automated Headspace Analysis
| Component | Function | Key Selection Criteria |
|---|---|---|
| Headspace Autosampler | Automates sample incubation, pressurization, and transfer of the vial's headspace vapor to the GC, ensuring high throughput and reproducibility [30]. | Level of automation (fully/semi-automatic), throughput, temperature control precision, and integration with data systems [29]. |
| Headspace Vials | Contain the sample and provide a sealed environment for the establishment of gas-liquid equilibrium [30]. | Vial volume (e.g., 10-mL, 20-mL), chemical inertness, and compliance with international standards. |
| Septa | Provide a gas-tight seal for the vial to prevent the loss of volatile analytes and ensure the integrity of the headspace [32] [33]. | Chemical resistance, resealing capability after needle puncture, temperature stability, and material (e.g., PTFE/Silicone) [32] [33]. |
Component Deep Dive: Septa Selection Guide
The septum, while small, is a critical failure point. An inappropriate choice can lead to sample loss, contamination, or poor analytical results.
Table 3: Septa Material Selection Guide for Pharmaceutical Headspace Analysis
| Material | Advantages | Disadvantages | Ideal Application in Pharma QC |
|---|---|---|---|
| PTFE/Silicone | Excellent chemical inertness from PTFE; superior resealing capability from silicone [33]. | Silicone may absorb certain very volatile compounds. | The first choice for most routine HS-GC analyses, especially for multiple punctures and sample storage [33]. |
| Pre-slit PTFE/Silicone | Reduces coring and needle damage; ensures consistent penetration force [33]. | Not suitable for highly volatile samples or multiple injections due to potential leak path [33]. | Automated systems with thin injection needles (e.g., Shimadzu, Hitachi) to protect the instrument [33]. |
| PTFE (Single Layer) | High chemical resistance and inertness [33]. | Poor resealing; not recommended for multiple punctures or sample storage [33]. | Limited to single-use applications where resealing is not required. |
| Silicone Rubber | High-temperature resistance [33]. | Poor sealing performance; not suitable for vacuum applications [33]. | High-temperature methods, but use with caution due to potential absorption. |
Experimental Protocol: Determination of Residual Solvents in an API
The following protocol, adapted from a published study on the antimalarial drug Arterolane Maleate, provides a validated method for the simultaneous determination of ten residual solvents, demonstrating the practical application of the discussed components [28].
Research Reagent Solutions
- API Sample: Arterolane maleate bulk drug substance [28].
- Standard Solutions: Prepared in N,N-dimethylformamide to contain known concentrations of the following residual solvents: Pentane, Ethanol, 2-Methylpentane, Dichloromethane, 3-Methylpentane, n-Hexane, Methylcyclopentane, Cyclohexane, Benzene, and n-Heptane [28].
- Salting-Out Agent: High-purity Sodium Chloride [28].
- Diluent: Milli-Q water and N,N-dimethylformamide [28].
Apparatus and Chromatographic Conditions
- Gas Chromatograph: Perkin Elmer Clarus 500, equipped with a Flame Ionization Detector (FID) and a TurboMatrix Headspace Autosampler [28].
- Column: RTx-624 capillary column (6% cyanopropyl phenyl, 94% dimethyl polysiloxane), 30 m × 0.32 mm, 1.8 μm film thickness [28].
- Carrier Gas: Nitrogen, constant flow mode at 0.5 mL/min [28].
- Oven Temperature Program:
- Initial: 40°C, held for 20 minutes
- Ramp: 15°C/min to 200°C
- Final Hold: 5 minutes [28]
- Headspace Sampler Conditions:
- Vial: 20-mL headspace vial
- Septum: PTFE/Silicone
- Oven Temperature: Optimized to 80-100°C (based on solvent boiling points)
- Needle Temperature: 110°C
- Transfer Line Temperature: 120°C
- Thermostating Time: 30-45 minutes
- Pressurization Time: 1.0 minute
Sample and Standard Preparation
- Standard Vial: Transfer 0.2 mL of the standard stock solution into a 20-mL headspace vial. Add 2 mL of Milli-Q water and 1 g of sodium chloride. Immediately cap the vial securely with a PTFE/Silicone septum [28].
- Sample Vial: Weigh approximately 100 mg of the API (Arterolane maleate) directly into a 20-mL headspace vial. Add 0.2 mL of N,N-dimethylformamide, 2 mL of Milli-Q water, and 1 g of sodium chloride. Immediately cap the vial securely [28].
The Analytical Workflow
The automated headspace process, from sample loading to quantitative result, involves a precisely orchestrated sequence of steps as visualized below.
Method Validation
The developed method was validated according to International Conference on Harmonisation (ICH) guidelines, with key results summarized below [28].
Table 4: Summary of Method Validation Parameters [28]
| Validation Parameter | Experimental Procedure | Acceptance Criterion/Outcome |
|---|---|---|
| Specificity | API sample spiked with individual solvents. No interference from the sample matrix observed. | Baseline resolution for all solvents, especially critical pair (2-methylpentane & DCM). |
| Precision (Repeatability) | Six replicate preparations of a single API batch. | Relative Standard Deviation (RSD) < 20% for all solvents. |
| Linearity | Injections of each solvent from LOQ to 200% of standard concentration. | Correlation coefficient (r²) > 0.995 for all solvents. |
| Accuracy (Recovery) | API samples spiked at three concentration levels in triplicate. | Recovery rates between 85% and 103% for all solvents. |
| Limit of Quantification (LOQ) | Determined based on signal-to-noise ratio (S/N ≈ 10). | LOQ below 0.050 μg/g for all solvents, meeting sensitivity requirements. |
The successful implementation of automated headspace GC for pharmaceutical quality control is a multifaceted process that extends beyond the gas chromatograph itself. The strategic selection of the autosampler, vials, and septa forms the foundation of a robust analytical method. As demonstrated in the protocol for Arterolane maleate, a deep understanding of how these components interact—from the phase ratio defined by the vial size to the integrity ensured by the PTFE/Silicone septum—is what enables researchers to achieve the high levels of precision, accuracy, and sensitivity demanded by global regulatory standards. By adhering to these application notes and protocols, scientists can ensure the reliability of their data, safeguarding the quality and safety of pharmaceutical products.
Advanced Methodologies for Residual Solvent and Impurity Analysis
Standard Operating Procedures for Automated Headspace Analysis
Automated headspace analysis is an indispensable technique in modern pharmaceutical quality control laboratories, enabling the precise, high-throughput analysis of volatile compounds. This Application Note provides detailed Standard Operating Procedures (SOPs) for the application of automated static headspace sampling coupled with gas chromatography (HS-GC) for pharmaceutical analysis. The protocol is specifically contextualized for critical quality control applications such as residual solvent testing according to United States Pharmacopeia (USP) method 467 and volatile impurity profiling in active pharmaceutical ingredients (APIs) and finished drug products [34].
The transition from manual to fully automated headspace sampling has been driven by the need for improved reproducibility, reduced human error, and higher analytical throughput. The global market for fully automatic headspace samplers is projected to grow from 10.7 billion in 2025 to 21.02 billion by 2033, reflecting a compound annual growth rate (CAGR) of 11.91% [35]. This growth is largely fueled by stringent regulatory requirements and the pharmaceutical industry's focus on product safety and efficacy. This document establishes a comprehensive framework for method development, instrument operation, and system suitability testing to ensure regulatory compliance and generate defensible analytical data.
Theoretical Principles of Headspace Analysis
Static headspace extraction (SHE) operates on the principle of analyzing the vapor phase in equilibrium with a solid or liquid sample in a sealed vial [36]. The fundamental relationship governing the concentration of an analyte in the headspace vapor is described by the equation:
A ∝ CG = C0 / (K + β)
Where A is the detector response peak area, CG is the concentration of the analyte in the gas phase, C0 is the initial concentration in the sample, K is the partition coefficient (defining the distribution of the analyte between the sample and gas phases), and β is the phase ratio (the ratio of vapor phase volume to sample phase volume in the vial) [34].
The partition coefficient (K) is temperature-dependent, with increased temperature typically driving more analyte into the headspace vapor until an equilibrium is established [36]. The phase ratio (β) can be optimized by adjusting the sample volume relative to the vial size. A best practice is to maintain at least 50% headspace in the vial to ensure sufficient vapor phase for reproducible sampling [34]. Modern automated headspace samplers utilize a valve-and-loop system that pressurizes the vial, then transfers an aliquot of the headspace vapor to the GC inlet via a heated transfer line, ensuring consistent injection volumes and minimal analyte loss [34].
Materials and Equipment
The Scientist's Toolkit: Essential Research Reagent Solutions
| Item | Specification/Function |
|---|---|
| Headspace Vials | Borosilicate glass; 10 mL, 20 mL, or 22 mL capacities; certified for minimal leachables and extractables. Must be compatible with autosampler. [37] [34] |
| Headspace Caps/Septa | Crimp or screw top with PTFE/silicone or butyl rubber septa; must provide a leak-proof seal and withstand repeated needle penetrations with minimal coring. [37] |
| Internal Standards | Deuterated or structurally similar volatile compounds not present in the sample; used for quantification and monitoring method performance. [38] |
| Salt Additives | Non-volatile salts such as Sodium Chloride (NaCl); added to aqueous samples to modify ionic strength and decrease analyte solubility (salting-out effect), thereby increasing headspace concentration. [38] |
| Calibration Standards | High-purity reference standards of target analytes prepared in appropriate matrix-mimicking solvent. [38] |
| SPME Fibers (Optional) | For enrichment techniques; DVB/CAR/PDMS (50/30 μm) is common for a wide volatility range. [26] [38] |
Instrumentation Configuration
A typical automated headspace system consists of the following key components [34]:
- Temperature-controlled oven: For incubating sample vials at a constant temperature before analysis.
- Automated sampling probe: Pierces the vial septum for pressurization and sample transfer.
- Heated sampling loop: Contains a fixed volume for repeatable injections (typically in the milliliter range).
- Heated sampling valve and transfer line: Creates a thermally controlled path to the GC inlet.
Experimental Protocol: Residual Solvent Analysis in an API
Sample Preparation
- Weighing: Accurately weigh 500 mg of the API (or a volume appropriate for the expected analyte concentration) into a 20 mL headspace vial.
- Reconstitution: Dilute the sample with an appropriate solvent (e.g., high-purity water or dimethylformamide) to a final volume of 2.0 mL. The solvent should dissolve the API but not co-elute with target volatiles.
- Internal Standard: Add a known amount of a suitable internal standard (e.g., 20 µL of a d3-β-phenethyl acetate solution at 20.12 µg/L) [38].
- Salting-Out (Optional): For aqueous matrices, add 3.0 g of NaCl to decrease the partition coefficient (K) and enhance volatile transfer to the headspace [38].
- Sealing: Immediately cap the vial securely using a crimper to ensure a hermetic seal.
Instrument Operating Conditions
Table 1: Example Headspace Sampler and GC/MS Conditions for Residual Solvent Analysis
| Parameter | Setting | Rationale |
|---|---|---|
| Headspace Sampler | ||
| Incubation Temperature | 80 °C | Maximizes volatile transfer while staying 20 °C below solvent boiling point [34]. |
| Incubation Time | 30 min | Ensures equilibrium is reached between sample and vapor phase. |
| Loop Temperature | 110 °C | Prevents analyte condensation in the transfer path. |
| Transfer Line Temp | 120 °C | Ensures complete transfer to GC inlet. |
| Vial Pressurization | 15 psi | Facilitates filling of the sample loop. |
| Gas Chromatograph | ||
| Inlet | Split (10:1) | Prevents column overloading. |
| Inlet Temperature | 150 °C | |
| Column | 30 m × 0.32 mm ID, 1.8 µm film thickness, 6% cyanopropyl phenyl polysiloxane stationary phase | Standard for volatile separations. |
| Oven Program | 40 °C (hold 5 min), ramp 10 °C/min to 150 °C (hold 2 min) | |
| Carrier Gas | Helium, constant flow 1.5 mL/min | |
| Detector (MS) | ||
| Ionization Mode | Electron Impact (EI) | |
| Transfer Line Temp | 250 °C | |
| Acquisition Mode | Selected Ion Monitoring (SIM) | Enhances sensitivity and selectivity for target analytes. |
System Suitability and Quality Control
- Linearity: Prepare a minimum of five standard solutions across the expected concentration range (e.g., 5% to 150% of the specification limit). A correlation coefficient (R²) of >0.995 is typically required [38].
- Precision: Six replicate injections of a standard at 100% concentration should yield a relative standard deviation (RSD) of <5.0% for peak areas.
- Detection and Quantitation Limits: Establish LOD and LOQ, typically defined as signal-to-noise ratios of 3:1 and 10:1, respectively.
- Carryover: Analyze a blank solvent sample immediately after the highest calibration standard. The response in the blank should be <20% of the LOD for any analyte.
Method Development and Optimization
The following workflow outlines the critical steps for developing and validating a robust automated headspace method.
Diagram 1: Method Development Workflow
Key optimization parameters include:
- Incubation Temperature: Systematically investigate temperatures between 60-120°C, noting that higher temperatures increase headspace concentration but risk sample degradation or excessive solvent vapor pressure. The optimal temperature minimizes K (the partition coefficient) [36].
- Equilibration Time: Determine the minimum time required to reach equilibrium by analyzing replicate samples at increasing time intervals. The optimal time is the point where detector response plateaus [34].
- Sample Volume and Phase Ratio (β): For analytes with low K values (high volatility), the sample volume must be carefully controlled as small variations significantly impact the peak area. For analytes with high K values, the phase ratio has less impact [36]. Using a 20 mL vial instead of a 10 mL vial with the same sample volume decreases β and can enhance sensitivity [34].
- Matrix Modification: The addition of salts like NaCl can significantly improve extraction efficiency for polar volatiles in aqueous matrices by reducing their solubility (salting-out effect) [38].
Data Analysis, Interpretation, and Troubleshooting
Quantitative Analysis
Quantification is typically performed using an internal standard method or external standard calibration. For complex or variable matrices, Multiple Headspace Extraction (MHE) may be employed to eliminate matrix effects for accurate quantification [34].
Table 2: Troubleshooting Common Issues in Automated Headspace Analysis
| Problem | Potential Cause | Corrective Action |
|---|---|---|
| Poor Peak Area Reproducibility (High RSD) | • Incomplete equilibrium• Leaky vial seals• Variable sample volume• Carryover | • Increase incubation time.• Check crimping tool and septa quality.• Use automated liquid handlers.• Increase purge time/clean loop. |
| Low Sensitivity | • Partition coefficient (K) too high• Phase ratio (β) too high• Low incubation temperature• Analytes adsorbed to matrix | • Increase temperature; use salting-out.• Increase sample volume.• Optimize temperature (see Section 5).• Dilute sample; modify matrix. |
| Carryover/ Ghost Peaks | • Contaminated sampling needle or loop• Incomplete venting between runs | • Perform rigorous system cleaning.• Increase needle purge time and pressure. |
| Split Peaks | • Incorrect vial pressure | • Check and adjust vial pressurization parameters. |
Regulatory Considerations in Pharmaceutical QC
Methods must be developed and validated per International Council for Harmonisation (ICH) Q2(R1) guidelines. Key considerations for computerized systems in a GMP environment include [39]:
- Data Integrity: Ensuring all electronic data is attributable, legible, contemporaneous, original, and accurate (ALCOA+ principles).
- Computer System Validation (CSV): Formal assurance that the automated headspace system does what it purports to do in a reproducible manner.
- Change Control: Strict management of any changes to hardware, software, or analytical methods.
- Audit Trails: Secure, computer-generated records that track method creation and data modification.
Adherence to this SOP ensures that automated headspace analysis generates reliable, high-quality data suitable for regulatory submissions and routine quality control, supporting the safety and efficacy of pharmaceutical products.
In the stringent world of pharmaceutical quality control, the accurate quantification of volatile impurities, such as residual solvents, is paramount for ensuring drug safety and efficacy. Automated headspace gas chromatography (HS-GC) has emerged as a cornerstone technique for this analysis, prized for its ability to cleanly and efficiently separate volatile analytes from complex, non-volatile sample matrices. The reliability of this technique, however, is heavily dependent on the meticulous optimization of critical method parameters. This application note, framed within a broader thesis on automated headspace sampling, provides a detailed protocol for optimizing temperature, equilibration time, and sample preparation to achieve robust, sensitive, and reproducible results for pharmaceutical analysis. The principles outlined are aligned with the requirements of regulatory guidelines such as USP 〈467〉, ensuring that the developed methods are not only scientifically sound but also compliant.
Theoretical Foundations of Headspace Optimization
The fundamental principle of static headspace analysis is based on the equilibrium distribution of an analyte between the sample (liquid or solid) phase and the gas phase (headspace) in a sealed vial. The detector response (A) is proportional to the concentration of the analyte in the gas phase (CG), which is governed by the equation [40]: A ∝ CG = C0 / (K + β) In this equation, C0 is the original concentration of the analyte in the sample, K is the partition coefficient (analyte concentration in sample phase / analyte concentration in gas phase), and β is the phase ratio (volume of gas phase / volume of sample phase) [40]. The goal of method optimization is to maximize C_G by manipulating experimental conditions that affect K and β.
- Partition Coefficient (K): This is a temperature-dependent parameter. A high K value indicates the analyte has a greater affinity for the sample matrix, thus remaining in the solution. Increasing the incubation temperature provides energy for analytes to escape the matrix, thereby decreasing K and increasing their concentration in the headspace [40]. The extent of this effect is compound-specific.
- Phase Ratio (β): This is a physical parameter determined by the vial size and the sample volume. A smaller β value, achieved by using a larger sample volume in a given vial size, increases the concentration of the analyte in the headspace and enhances detector sensitivity [40]. A best practice is to leave at least 50% of the vial volume as headspace to allow for proper equilibration and sampling [40].
Key Parameters for Optimization
Quantitative Optimization Data
The following table synthesizes experimental data from recent studies, illustrating the impact and optimal ranges for critical parameters in headspace analysis.
Table 1: Summary of Key Optimization Parameters and Their Effects
| Parameter | Optimal Range / Value | Impact on Analysis | Experimental Support |
|---|---|---|---|
| Incubation Temperature | 60–80 °C (or ~20 °C below solvent boiling point) | Significantly increases volatile concentration in headspace by decreasing partition coefficient (K); higher temperatures yield higher detector response until plateau [40]. | A study showed a K value for ethanol in water decreased from ~1350 at 40 °C to ~330 at 80 °C, drastically improving signal [40]. |
| Equilibration Time | 15–20 minutes | Time required for the system to reach equilibrium between the sample and headspace; insufficient time leads to poor reproducibility [41] [42]. | A method for analyzing volatile hydrocarbons used a 15-minute equilibration time validated by a central composite design [42]. |
| Sample Volume & Vial Size | 2–4 mL in a 20 mL vial (≥50% headspace) | A larger sample volume in a fixed vial size decreases the phase ratio (β), concentrating analytes in the headspace and improving sensitivity [40]. | Chromatographic overlays demonstrate a 4 mL sample in a 20 mL vial provides a significantly higher response than the same volume in a 10 mL vial [40]. |
| Salting-Out Effect | Addition of NaCl (e.g., 1.8 g) | Reduces solubility of volatile organic compounds in the aqueous phase, driving them into the headspace and improving recovery [42]. | Used in the analysis of volatile petroleum hydrocarbons (C5–C10) in water to enhance partitioning into the headspace [42]. |
Interaction of Parameters and Design of Experiments (DoE)
Traditional one-variable-at-a-time (OVAT) optimization is inefficient and can miss significant interaction effects between parameters. A multivariate approach using Design of Experiments (DoE) is highly recommended for robust method development. A central composite face-centered (CCF) design was successfully used to optimize HS-GC conditions for volatile hydrocarbons, simultaneously evaluating sample volume, temperature, and equilibration time [42]. The analysis of variance (ANOVA) confirmed the global significance of the model, revealing significant main, quadratic, and interaction effects. For instance, while sample volume had a strong negative impact on the phase ratio (β), its interaction with temperature demonstrated synergistic behavior, which would be difficult to discover with OVAT [42].
Detailed Experimental Protocol
Reagents and Materials
Table 2: Research Reagent Solutions and Essential Materials
| Item | Function / Application |
|---|---|
| DB-624 Capillary Column (30 m × 0.53 mm, 3 μm) | A mid-polarity GC column ideal for the separation of volatile organic compounds, including residual solvents [43]. |
| Sodium Chloride (NaCl), Analytical Grade | A "salting-out" agent used to decrease the solubility of volatile analytes in aqueous samples, enhancing their partitioning into the headspace [42]. |
| 20 mL Headspace Vials with PTFE/Silicone Septa | Standard vials that provide sufficient headspace volume for equilibrium and allow for a favorable phase ratio with typical 2-4 mL sample volumes [40] [42]. |
| Gas Chromatograph with FID/MS Detector | FID is universal for hydrocarbons, while MS provides compound identification. An inlet temperature of 220–250 °C and detector temperature of 280–300 °C are common [43] [42]. |
| Automated Static Headspace Sampler | Automates vial incubation, pressurization, and sample transfer, ensuring high reproducibility and throughput (e.g., Agilent 7697A) [40] [42]. |
| Certified Reference Standards | Necessary for preparing calibration solutions and ensuring accurate quantification of target analytes. |
Workflow for Method Optimization
The following diagram outlines the systematic workflow for developing and optimizing an automated headspace-GC method.
Step-by-Step Procedure
Step 1: Sample Preparation
- Weigh an appropriate amount of the pharmaceutical sample (e.g., API or finished product) into a 20 mL headspace vial. For liquid samples, pipette 2–4 mL directly.
- Add Internal Standard/Spike: If performing quantitative analysis, add a known concentration of internal standard or spike with target analyte standards.
- Apply Salting-Out: For aqueous samples, add approximately 1.8 g of sodium chloride (NaCl) to enhance the partitioning of volatiles into the headspace [42].
- Immediately Seal the vial with a crimp cap equipped with a PTFE/silicone septum to prevent any loss of volatiles.
Step 2: Instrumental Configuration
- Load the prepared vials into the autosampler tray of the automated headspace sampler (e.g., Agilent 7697A).
- Set GC Parameters: Use a DB-624 capillary column (30 m × 0.53 mm, 3 μm) or equivalent. Program the oven temperature as needed for separation. Set the injector temperature to 220–250 °C and the FID detector to 280–300 °C [43] [42].
- Configure Headspace Sampler: The automated system will follow a valve-and-loop process: incubating the vial, pressurizing it with carrier gas, transferring the headspace vapor into a sample loop, and then injecting the contents into the GC inlet [40].
Step 3: Optimization and Analysis
- Develop a DoE Matrix: Create an experimental design (e.g., Central Composite Design) that varies incubation temperature (e.g., 40–80 °C), equilibration time (e.g., 10–30 min), and sample volume (e.g., 1–4 mL) [42].
- Run Experiments: Execute the randomized runs defined by the DoE matrix.
- Analyze Data: Use the chromatographic peak area as the response variable. Perform ANOVA on the data to identify significant factors and interaction effects.
- Establish Optimal Conditions: Based on the statistical model, define the parameter set that provides maximum sensitivity and reproducibility. For example, a study might find that 2 mL of sample, incubated at 80 °C for 20 minutes, yields optimal results.
Application in Pharmaceutical Quality Control
The rigorous application of this optimized protocol is exemplified in the synthesis and quality control of modern pharmaceuticals like Suvorexant. A recent study developed an HS-GC method for determining eight residual solvents, including n-heptane, in the active pharmaceutical ingredient (API) [43]. The method, utilizing a DB-624 column and optimized headspace conditions, demonstrated excellent resolution (R > 1.5), linearity (r > 0.990), and precision (RSD < 5.0%), leading to a final API purity of 99.92% [43]. This underscores how a meticulously developed headspace method is integral to controlling the quality of a drug substance, ensuring compliance with regulatory standards, and safeguarding patient health. The technique's applicability extends to monitoring volatile organic compounds (VOCs) in drug products and packaging materials, solidifying its role as a versatile tool in the pharmaceutical analyst's toolkit.
The Scientist's Toolkit
Table 3: Essential Research Reagent Solutions for Headspace-GC Method Development
| Item | Function / Application |
|---|---|
| DB-624 Capillary Column (30 m × 0.53 mm, 3 μm) | A mid-polarity GC column ideal for the separation of volatile organic compounds, including residual solvents [43]. |
| Sodium Chloride (NaCl), Analytical Grade | A "salting-out" agent used to decrease the solubility of volatile analytes in aqueous samples, enhancing their partitioning into the headspace [42]. |
| 20 mL Headspace Vials with PTFE/Silicone Septa | Standard vials that provide sufficient headspace volume for equilibrium and allow for a favorable phase ratio with typical 2-4 mL sample volumes [40] [42]. |
| Gas Chromatograph with FID/MS Detector | FID is universal for hydrocarbons, while MS provides compound identification. An inlet temperature of 220–250 °C and detector temperature of 280–300 °C are common [43] [42]. |
| Automated Static Headspace Sampler | Automates vial incubation, pressurization, and sample transfer, ensuring high reproducibility and throughput (e.g., Agilent 7697A) [40] [42]. |
| Certified Reference Standards | Necessary for preparing calibration solutions and ensuring accurate quantification of target analytes. |
Residual solvents in pharmaceuticals are volatile organic chemicals used or produced during the manufacture of drug substances, excipients, or drug products [44]. Since these solvents are not completely removed by practical manufacturing techniques, their levels must be controlled to ensure patient safety [44] [45]. Regulatory frameworks worldwide, including the International Council for Harmonisation (ICH) Q3C guideline and the United States Pharmacopeia (USP) General Chapter <467>, establish permitted daily exposure (PDE) limits for these solvents based on their toxicity profiles [44] [46]. This application note details the implementation of automated headspace gas chromatography (HS-GC) for residual solvent analysis, providing methodologies aligned with current regulatory expectations and the principles of Analytical Quality by Design (AQbD).
Regulatory Framework and Solvent Classification
Regulatory requirements mandate that manufacturers ensure pharmaceuticals are free from toxicologically significant levels of residual solvents, with USP <467> applying to all drug products and substances covered by USP monographs, whether new or existing [44] [45]. The ICH Q3C guideline classifies residual solvents into three categories based on their risk:
- Class 1: Solvents to be avoided (known human carcinogens, strongly suspected human carcinogens, and environmental hazards)
- Class 2: Solvents to be limited (non-genotoxic animal carcinogens or solvents causing other irreversible toxicities)
- Class 3: Solvents with low toxic potential (PDEs of 50 mg or more per day) [44]
Table 1: Classification and Limits of Common Residual Solvents (Selected List)
| Solvent | ICH Class | PDE (mg/day) | Concentration Limit (ppm) |
|---|---|---|---|
| Benzene | 1 | - | 2 |
| Carbon Tetrachloride | 1 | - | 4 |
| Acetonitrile | 2 | 4.1 | 410 |
| Chloroform | 2 | 0.6 | 60 |
| Dichloromethane | 2 | 6.0 | 600 |
| N,N-Dimethylformamide | 2 | 8.8 | 880 |
| Methanol | 2 | 30.0 | 3000 |
| Toluene | 2 | 8.9 | 890 |
| Acetone | 3 | - | 5000 |
| Ethanol | 3 | - | 5000 |
| Isopropyl Alcohol | 3 | - | 5000 |
Note: This table is adapted from information provided by Thermo Fisher Scientific [44]. The USP General Chapter <467> was recently revised to include two new Class 2 solvents (Cyclopentyl methyl ether and tertiary butyl alcohol) and one new Class 3 solvent (2-Methyltetrahydrofuran), with these changes official as of August 1, 2025 [46].
Experimental Design and Workflow
Principle of Operation
Static headspace gas chromatography operates on the principle of sampling the vapor phase in equilibrium with a solid or liquid sample in a sealed vial [47] [14]. This technique is particularly suitable for volatile organic compounds like residual solvents, as it transfers the analytes of interest into the chromatographic system while leaving non-volatile matrix components behind, thereby reducing instrument maintenance and improving data quality [47].
Analytical Workflow
The following diagram illustrates the complete workflow for residual solvent analysis using automated headspace sampling:
Materials and Equipment
The Scientist's Toolkit: Essential Research Reagent Solutions
Table 2: Key Materials and Equipment for Residual Solvent Analysis
| Item | Function/Purpose | Specification Notes |
|---|---|---|
| Headspace Autosampler | Automated sample introduction for improved reproducibility and throughput | Fully automatic systems preferred for high-volume laboratories; valve-and-loop technology for precise injections [48] [29] |
| Gas Chromatograph | Separation of volatile compounds | Equipped with Flame Ionization Detector (FID) and/or Mass Spectrometer (MS) [44] |
| Analytical Column | Chromatographic separation of analytes | Fused silica column with stationary phase such as 6% cyanopropylphenyl/94% dimethyl polysiloxane (e.g., DB-624) [47] [49] |
| Headspace Vials | Containment of samples during incubation | Chemically inert, sealed with PTFE/silicone septa to maintain integrity [50] |
| Headspace Grade Solvents | Dissolution of drug substances | High purity water, DMF, DMSO, or DMAC depending on drug solubility; minimal volatile impurities [44] |
| Reference Standards | System qualification and quantitation | Certified reference materials for target solvents at required concentrations [47] |
Detailed Experimental Protocol
Sample Preparation
- Solution Preparation: Precisely weigh the drug substance or product and transfer to a headspace vial. Dilute with an appropriate solvent, typically high-purity water or N,N-dimethylformamide (DMF), depending on the solubility characteristics of the drug substance [47] [44]. The choice of diluent is critical, with water being preferred for water-soluble compounds and DMF for water-insoluble compounds [47].
- Standard Preparation: Prepare standard solutions containing the target residual solvents at concentrations appropriate for establishing calibration curves, typically spanning 50% to 150% of the target concentration limits [47].
Instrumental Parameters
The following parameters are derived from validated methods and AQbD approaches published in recent literature [47] [49]:
Table 3: Optimized GC-MS/MS Parameters for Residual Solvent Analysis
| Parameter | Setting | Alternative/Procedures A & B |
|---|---|---|
| GC Column | Fused silica column (e.g., DB-624, 30 m × 0.32 mm × 1.8 μm) | 6% cyanopropylphenyl/94% dimethyl polysiloxane [47] |
| Carrier Gas | Helium, constant flow | Nitrogen may also be used |
| Oven Program | Initial 40°C (hold 4 min), ramp to 240°C at 20-30°C/min | Alternative: 60°C for 20 min (compendial) [47] |
| Inlet Temperature | 150-250°C | 150°C [47] |
| Split Ratio | 1:20-1:25 (optimized range) | 1:1 to 1:5 (compendial methods) [49] |
| Headspace Agitator Temp | 90-97°C | 70-130°C (method dependent) [49] |
| Equilibration Time | 15-30 min | 30-60 min (longer for complex matrices) |
| Ion Source Temp | 265-285°C | N/A for GC-FID |
Quality Control Measures
- System Suitability: Prior to analysis, ensure the chromatographic system meets predefined suitability criteria, including resolution (≥2.0) between critical solvent pairs, tailing factor (≤2.0), and theoretical plate count (>14,000) [49].
- Quantitation Approach: Employ standard addition for quantification when matrix effects are significant, particularly for drug products with complex formulations. External standard quantification may be used for drug substances with minimal matrix interference [47].
Method Validation Requirements
According to USP General Chapter <1467>, verification is required for compendial procedures, while full validation is necessary for alternative methods [46]. Key validation parameters include:
- Specificity: Demonstrate no interference from the sample matrix at the retention times of target solvents [47].
- Linearity: Establish a calibration curve with correlation coefficient (R²) > 0.990 over the specified concentration range [49].
- Precision: Repeatability should demonstrate ≤15% relative standard deviation for precision [47].
- Quantitation Limit (QL): The method should reliably detect and quantify solvents at or below the concentration limits specified in ICH Q3C, typically in the lower ppm range [47].
Recent Advances and Future Perspectives
The field of residual solvent analysis continues to evolve with several notable trends:
- Analytical Quality by Design (AQbD): Implementation of AQbD principles for robust method development, utilizing risk assessment to identify Critical Method Variables (CMVs) such as split ratio, agitator temperature, and ion source temperature, and establishing a Method Operable Design Region (MODR) [49].
- Automation and Throughput: Increasing adoption of fully automatic headspace samplers to enhance laboratory efficiency, reduce manual errors, and improve reproducibility [48] [29]. The global headspace autosampler market is projected to grow at a CAGR of 7%, reaching an estimated $250 million by 2025 [29].
- Method Acceleration: Development of faster chromatographic methods compared to traditional compendial procedures through optimized temperature programming and reduced equilibration times without compromising separation efficiency [47].
- Emerging Detection Technologies: Advancement in detection capabilities, particularly through the use of GC-MS/MS, which provides enhanced sensitivity and selectivity for complex pharmaceutical matrices [49].
Residual solvent analysis remains a critical component of pharmaceutical quality control, ensuring patient safety by limiting exposure to potentially harmful volatile impurities. The headspace GC methodology outlined in this application note, when properly implemented and validated, provides a robust framework for compliance with global regulatory standards. The integration of modern approaches such as AQbD and automated sampling technologies positions pharmaceutical manufacturers to efficiently meet both current and future analytical challenges in this domain.
Volatile impurity profiling constitutes a critical component of pharmaceutical quality control, ensuring drug safety by detecting and quantifying potentially harmful volatile organic compounds (VOCs) that may originate from synthesis, degradation, or packaging processes [51]. These impurities, even at trace levels, can compromise therapeutic efficacy and patient safety, making their accurate detection and control a regulatory requirement [52]. Static headspace gas chromatography (HS-GC) has emerged as a premier analytical technique for this application, offering significant advantages over traditional liquid injection methods for volatile compounds [53].
The integration of automated headspace samplers represents a transformative advancement in pharmaceutical quality control laboratories. These systems enhance analytical precision while dramatically increasing throughput and operational efficiency [3]. By eliminating tedious sample preparation and minimizing contamination risks, automated headspace sampling provides the reproducibility required for regulatory compliance while accommodating the high-volume testing needs of modern pharmaceutical manufacturing [3]. This application note details the implementation of automated headspace sampling for volatile impurity profiling within the framework of a comprehensive pharmaceutical quality control strategy.
Principles and Regulatory Framework
Fundamentals of Static Headspace Analysis
Static headspace analysis operates on the principle of sampling the gas phase (headspace) above a sample contained within a sealed vial after volatile compounds have reached equilibrium between the sample and gas phases [53]. This technique is particularly suited for analyzing volatile organic compounds in complex matrices because it introduces cleaner samples into the GC system, reducing inlet maintenance and instrument downtime [53].
The theoretical foundation of headspace analysis is described by the equation relating detector response to analyte concentration:
A ∝ CG = C0/(K + β) [53]
Where:
- A = Detector response (peak area)
- C0 = Original analyte concentration in the sample
- CG = Analyte concentration in the gas phase (headspace)
- K = Partition coefficient (analyte distribution between sample and gas phases)
- β = Phase ratio (VG/VL, the ratio of gas volume to sample volume in the vial) [53]
The partition coefficient (K) is temperature-dependent and represents the ratio of the analyte's concentration in the sample phase (CS) to its concentration in the gas phase (CG) [53]. Understanding these relationships is essential for method development and optimization.
Regulatory Requirements for Volatile Impurities
Pharmaceutical volatile impurity profiling is governed by stringent regulatory standards worldwide. The International Council for Harmonisation (ICH) guidelines Q3A (Impurities in New Drug Substances) and Q3B (Impurities in New Drug Products) establish thresholds for reporting, identifying, and qualifying impurities based on maximum daily dose and toxicity concerns [51].
United States Pharmacopeia (USP) General Chapter <467> provides the definitive methodology for residual solvents testing, classifying volatile impurities into three classes based on risk [3] [53]:
- Class 1: Solvents to be avoided (known human carcinogens, strongly suspected carcinogens, or environmental hazards)
- Class 2: Solvents to be limited (nongenotoxic animal carcinogens or other irreversible toxicity)
- Class 3: Solvents with low toxic potential
The following table summarizes the ICH classification and limits for residual solvents:
Table 1: ICH Classification of Residual Solvents with Examples and Limits [52]
| Class | Risk Description | Examples | Permitted Daily Exposure (PDE) |
|---|---|---|---|
| Class 1 | Solvents known to cause unacceptable toxicities (human carcinogens, strongly suspected carcinogens, environmental hazards) | Benzene, Carbon tetrachloride, 1,1-Dichloroethene | Should be avoided (e.g., Benzene: 2 ppm) |
| Class 2 | Solvents associated with nongenotoxic carcinogenicity, neurotoxicity, or teratogenicity | Acetonitrile, Chloroform, Methanol, Hexane | Limited to 0.1-1.9% (e.g., Methanol: 3000 ppm) |
| Class 3 | Solvents with low toxic potential | Acetic acid, Ethanol, Acetone, Ethyl acetate | Limited to 0.5-1.9% (e.g., Ethanol: 5000 ppm) |
Modern automated headspace systems like the SCION Versa Automated Headspace Sampler are specifically designed to meet all USP <467> guidelines, providing the precision, accuracy, and reproducibility required for regulatory compliance [3].
Experimental Design and Workflow
The following diagram illustrates the complete end-to-end workflow for automated headspace analysis of volatile impurities in pharmaceuticals:
The Scientist's Toolkit: Essential Materials and Reagents
Successful volatile impurity profiling requires specific materials and instrumentation designed for headspace analysis. The following table details the essential components:
Table 2: Essential Research Reagent Solutions for Headspace Analysis of Volatile Impurities
| Item | Function/Application | Specification Considerations |
|---|---|---|
| Headspace Vials | Contain sample and maintain sealed environment during equilibration | 10-22 mL capacity; borosilicate glass; certified for headspace analysis [53] |
| Septa/Closures | Maintain vial integrity and prevent volatile loss | PTFE/silicone or other high-temperature materials; must provide leak-free seal [53] |
| Internal Standards | Quantitation accuracy and method validation | Deuterated analogs of target analytes or similar volatility compounds [54] |
| Matrix-Matched Standards | Calibration standard preparation | Prepared in same matrix as sample to account for partitioning effects [55] [54] |
| Salting-Out Agents | Modify partition coefficient to improve volatility | High-purity salts (e.g., potassium chloride, sodium sulfate) [55] |
| Automated Headspace Sampler | Sample incubation, pressurization, and injection | Temperature control to ±0.1°C; inert flow path; pressure control [3] [53] |
| GC-MS System | Separation, detection, and identification of volatile impurities | Appropriate column selectivity; mass spectrometric detection for confirmation [51] |
Detailed Experimental Protocol
Sample Preparation
Weighing: Accurately weigh 0.5-1.0 g of drug substance or product into a headspace vial. For quantitative analysis, ensure sample amount provides adequate representation of the batch.
Solution Preparation: Add appropriate diluent (typically water or dimethylformamide for USP <467> methods) to achieve sample concentrations within the linear range of the method. Maintain consistent dilution factors across all samples and standards.
Matrix Modification: For polar analytes in aqueous matrices, add salting-out agents such as potassium chloride or sodium sulfate to saturation (approximately 3-4 g for 10 mL aqueous samples) to decrease the partition coefficient and improve volatile transfer to the headspace [55].
Internal Standard Addition: Add appropriate internal standard (if used) at consistent concentration across all samples and calibrators to correct for injection volume variability and sample matrix effects.
Sealing: Immediately cap vials with appropriate septa and seals to prevent volatile loss. Apply crimp caps uniformly using a torque-controlled crimper to ensure consistent seal integrity.
Instrument Configuration and Method Parameters
Headspace Sampler Conditions [3] [53] [55]:
- Oven Temperature: 80-120°C for most applications, or 20°C below solvent boiling point
- Equilibration Time: 15-60 minutes (determine experimentally for each matrix)
- Needle Temperature: 5-10°C above oven temperature
- Transfer Line Temperature: 5-10°C above oven temperature
- Carrier Gas Pressure: Adjust to achieve proper vial pressurization
- Agitation: Medium to high if available to reduce equilibration time
- Injection Volume: 1 mL from headspace (loop size dependent)
- Pressurization Time: 0.5-2.0 minutes
GC Conditions [55]:
- Column Selection: 30-60 m × 0.32-0.53 mm ID fused silica capillary column with 1-5 μm film thickness; stationary phases include 6% cyanopropylphenyl/94% dimethylpolysiloxane or equivalent for USP <467>
- Inlet Temperature: 150-250°C (maintain at least 20°C above headspace transfer line temperature)
- Inlet Mode: Split (10:1 to 20:1) or splitless depending on sensitivity requirements
- Carrier Gas: Helium or nitrogen at constant flow (1-3 mL/min)
- Oven Program: 40°C (hold 5-10 min) ramp at 10-20°C/min to 200-240°C (hold 5-10 min)
- Detection: Flame ionization detector (FID) at 250-300°C, or mass spectrometric detector in scan or SIM mode for identification and confirmation
Quantitation Approaches
External Standard Calibration: Prepare calibration standards in the same matrix as the sample to account for matrix-induced partitioning effects. A minimum of five concentration levels should be used to establish the calibration curve [53].
Internal Standard Calibration: Preferred approach for improved precision. Select an internal standard with similar chemical properties and volatility to the target analytes but not present in the sample [54].
Standard Addition Method: For complex matrices where matrix-matched standards are challenging to prepare, use the method of standard additions (MOSA) by spiking known concentrations of analytes into aliquots of the sample [54].
Multiple Headspace Extraction (MHE): For samples where the matrix affects headspace concentration, MHE can be employed. This technique involves repeated analysis of the same vial with mathematical extrapolation to total content [53].
Method Optimization Strategies
Critical Parameter Optimization
Successful headspace analysis requires systematic optimization of key parameters to maximize sensitivity and reproducibility. The following table summarizes optimization strategies for critical method parameters:
Table 3: Optimization Strategies for Critical Headspace Parameters [53] [55]
| Parameter | Effect on Analysis | Optimization Strategy | Impact on K and β |
|---|---|---|---|
| Equilibration Temperature | Increases vapor pressure of analytes | Increase temperature to improve sensitivity; balance with potential degradation | Decreases K (increases CG) for most analytes |
| Equilibration Time | Ensures equilibrium between phases | Determine experimentally; use agitation to reduce time | Must reach equilibrium for consistent K |
| Sample Volume | Affects phase ratio (β) | Use 10 mL in 20 mL vial (β=1) for simplified calculations | Decreases β, increases CG for analytes with low K |
| Salting-Out | Decreases solubility of polar analytes | Add salt to saturation for aqueous samples | Decreases K, increases CG for polar analytes |
| Solution pH | Affects ionization and volatility | Adjust to suppress ionization for acidic/basic analytes | Can significantly change K for ionizable compounds |
| Agitation | Reduces equilibration time | Use medium-high shaking if available | No direct effect on K at equilibrium |
Troubleshooting Common Issues
Poor Sensitivity:
- Increase equilibration temperature (within stability limits)
- Optimize sample volume to decrease phase ratio (β)
- Implement salting-out for aqueous matrices
- Increase sample loop volume (if available)
Carryover Between Injections:
- Increase needle and transfer line temperatures
- Implement additional purge cycles
- Ensure proper seal integrity
- Verify cleanliness of needle exterior
Poor Precision:
- Improve temperature stability (±0.1°C required for high K analytes)
- Ensure consistent sample homogenization
- Verify consistent vial sealing torque
- Use internal standard calibration
Applications in Pharmaceutical Quality Control
Automated headspace sampling for volatile impurity profiling supports multiple critical applications in pharmaceutical quality control:
Residual Solvent Analysis
The primary application of HS-GC in pharmaceuticals is residual solvent analysis per USP <467> [3] [53]. This methodology detects and quantifies volatile organic solvents used in the manufacturing process that may remain in the final drug substance or product. Automated systems enable high-throughput analysis of multiple solvent classes in a single method, with detection limits meeting stringent regulatory requirements.
Degradation Product Monitoring
Volatile degradation products can form during storage or processing of drug substances and products. HS-GC provides an effective tool for monitoring these compounds, often at trace levels. For example, oxidative degradation products can be monitored in susceptible compounds like hydrocortisone, adinazolam, and conjugated dienes [52].
Leachables and Extractables Studies
Volatile compounds that migrate from packaging materials, container-closure systems, or manufacturing components into the drug product can be profiled using HS-GC [51]. These leachables and extractables studies are critical for product safety assessment, particularly for parenteral and ophthalmic products where direct patient contact occurs.
Stability Studies
Headspace analysis supports stability testing by monitoring volatile compound formation or changes over time under various storage conditions [3]. This data helps establish appropriate shelf life and storage conditions for pharmaceutical products, ensuring product quality throughout the intended lifespan.
Automated headspace sampling provides a robust, sensitive, and reproducible platform for volatile impurity profiling in pharmaceutical drug substances and products. By implementing the methodologies and optimization strategies detailed in this application note, quality control laboratories can establish compliant analytical methods that meet regulatory requirements for residual solvents and other volatile impurities. The integration of automated systems enhances laboratory efficiency while providing the precision and accuracy required for pharmaceutical quality control in a regulated environment. As regulatory standards continue to evolve toward lower detection limits and expanded impurity profiling, automated headspace methodologies will remain essential tools for ensuring drug safety and quality.
Multiple Headspace Extraction (MHE) represents a significant advancement in static headspace gas chromatography (GC) and gas chromatography-mass spectrometry (GC/MS) for analyzing volatile and semi-volatile compounds in complex, condensed-phase matrices. This automated technique is specifically designed for samples where conventional matrix-matched calibration is impossible or impractical, such as with insoluble pharmaceuticals, polymers, gels, and medical devices [56] [11]. Unlike standard headspace analysis which performs a single extraction from a sample vial, MHE involves a series of sequential headspace purge-and-regeneration cycles from the same vial, with the pressure vented to atmospheric pressure after each injection [56]. This process mathematically extrapolates to exhaustive extraction, enabling full quantitation of target analytes without physical exhaustive extraction of the sample.
The fundamental principle of MHE relies on the progressive decline in peak area observed with each successive extraction cycle. A plot of the logarithm of the peak area versus the injection number produces a linear relationship, which can be extrapolated to zero to determine the total amount of analyte present in the original sample [56]. This approach is particularly valuable in pharmaceutical quality control for quantifying residual solvents, process impurities, and sterilization residuals like ethylene oxide in drug products, packaging materials, and permanent implantable medical devices [57] [56]. By transforming a traditionally challenging analytical problem into an automated, reproducible workflow, MHE enhances accuracy while reducing the time and labor associated with exhaustive extraction methods such as liquid extraction or dynamic headspace.
Theoretical Foundation and MHE Principles
Fundamental Equation of Static Headspace
The theoretical foundation of MHE builds upon the basic principles of static headspace analysis. In standard headspace, the detector response (peak area, A) is proportional to the concentration of the analyte in the gas phase of the vial (C_G). This relationship is defined by the equation:
A ∝ CG = C0/(K + β) [57]
Where:
- C_0 represents the original concentration of the analyte in the sample
- K is the partition coefficient (temperature-dependent distribution of analyte between sample and gas phase)
- β is the phase ratio (ratio of gas volume to sample volume in the vial) [57]
The partition coefficient K expresses the equilibrium distribution of an analyte between the sample matrix and the headspace gas phase (K = CS/CG, where CS is the concentration in the sample phase). The phase ratio β is determined by the vial size and sample volume (β = VG/V_S) [57]. To maximize detector response, conditions should be optimized to minimize the sum (K + β), thereby increasing the proportion of volatile targets in the headspace.
Mathematical Basis of MHE
MHE extends these principles by performing multiple sequential extractions from the same vial. With each cycle, the headspace is partially depleted of analyte, leading to a characteristic exponential decline in peak areas. The total amount of analyte is determined by extrapolating this decline to complete exhaustion. The mathematical relationship is described by:
log An = log A1 - (n-1) log β [56]
Where:
- A_1 is the peak area from the first extraction
- A_n is the peak area from the nth extraction
- β is the decline factor characteristic of the system
A linear plot of log An versus extraction number (n) indicates a valid MHE analysis. The total area (Atotal) representing complete extraction is obtained by summing the geometric series:
Atotal = A1 / (1 - β) [56]
In practice, complete exhaustion of the sample is not required. Typically, 3-4 extraction cycles suffice to establish the linear regression accurately, from which the total area can be calculated [56] [11]. This mathematical extrapolation forms the core of MHE's quantitative capability for complex matrices.
Applications in Pharmaceutical Quality Control
MHE has proven particularly valuable in pharmaceutical quality control for analyzing challenging sample types where traditional calibration methods fail. The technique provides robust quantitative data for regulatory compliance and product safety assessments across multiple applications.
Table 1: Pharmaceutical Applications of MHE
| Application Area | Analyte(s) | Sample Matrix | Significance |
|---|---|---|---|
| Residual Solvents | Various Class 1-3 solvents | Insoluble pharmaceutical materials | USP/ICH compliance for product safety [56] |
| Sterilization Residuals | Ethylene Oxide | Surgical sutures, permanent contact medical devices | ISO 10993-7 compliance [56] |
| Packaging Leachables | Styrene Monomer | Polystyrene packaging, plastic films | Prevent product contamination [11] |
| Drug Product Impurities | N-Nitrosodimethylamine (NDMA) | Ranitidine tablet powder | Control of genotoxic impurities [11] |
| Excipient Analysis | Formaldehyde | Gelucire 44/14 excipient | Safety assessment of formulation components [11] |
One particularly impactful application is the analysis of ethylene oxide sterilization residuals from permanent contact medical devices. Before MHE, compliance with ISO 10993-7 required time-consuming and expensive cycles of liquid extractions followed by analysis. MHE reduces this to a single sample preparation that is fully automated apart from adding the sample or standard into a headspace vial, delivering results in hours rather than days [56]. Similarly, for residual solvents in insoluble pharmaceuticals, MHE eliminates the need for difficult or impossible matrix-matched standard preparation, instead using a totally vaporized external standard for quantitation [56].
The analysis of N-nitrosodimethylamine (NDMA) in ranitidine products demonstrates MHE's capability for trace-level determination of potent mutagenic impurities. This application achieved limits of quantitation (LOQs) in the very low nanogram range, enabling direct analysis of powdered tablets without dissolution. Despite the presence of Class 3 residual solvents (isopropyl alcohol and ethanol), highly repeatable MHE calibrations were obtained without derivatization, achieving throughput of approximately 12 samples per hour [11].
Comparative Analysis of MHE Techniques
The implementation of MHE with different detection systems significantly impacts method performance characteristics, particularly analysis time and throughput.
Table 2: Comparison of MHE with GC and SIFT-MS Detection
| Parameter | MHE-GC/MS | MHE-SIFT-MS |
|---|---|---|
| Analysis Time | Relatively long (chromatographic separation) | <2 minutes per sample (chromatography-free) [11] |
| Throughput | Lower due to sequential analysis | Higher due to parallel sample processing [11] |
| Detection Method | Mass spectrometric detection after GC separation | Direct injection mass spectrometry with soft chemical ionization [11] |
| Sample Scheduling | One sample analyzed at a time | One sample analyzed while headspace generated in up to 11 other samples [11] |
| Throughput Enhancement | Baseline | 8-fold enhancement demonstrated for polystyrene analysis [11] |
| Calibration Stability | Requires frequent recalibration | Stable for several weeks (4+ weeks demonstrated) [11] |
The integration of Selected Ion Flow Tube Mass Spectrometry (SIFT-MS) with MHE represents a particularly significant advancement. This technique utilizes rapidly switchable reagent ions (H₃O⁺, NO⁺, and O₂⁺•) for gas-phase soft chemical ionization of trace volatile organic compounds without chromatographic separation [11]. The direct analysis capability of SIFT-MS transforms MHE from a specialized technique into a practical, high-throughput approach for routine analysis. The remarkable stability of SIFT-MS instrumentation—capable of analyzing diverse volatiles back-to-back without configuration changes—enables calibrations to remain valid for weeks, further enhancing operational efficiency [11].
Detailed Experimental Protocols
General MHE Method Development Protocol
The following protocol provides a systematic approach to MHE method development applicable to various sample types and detection systems:
Sample Preparation Optimization
- Select appropriate vial size (typically 10-20 mL) based on sample volume requirements [57]
- Determine optimal sample weight/size (typically 0.1-2 g) through preliminary testing
- For solid samples, consider particle size reduction (grinding/cutting) to increase surface area
- Evaluate the need for solvent addition (typically 10-20 µL) for surface modification to aid analyte release from solid matrices [56]
Equilibration Conditions
- Determine optimal incubation temperature through gradient experiments (typically 20°C below solvent boiling point) [57]
- Establish minimum equilibration time required for analyte partitioning to reach steady state
- For MHE-SIFT-MS, utilize continuous headspace analysis (CHA) mode to directly monitor headspace generation and optimize purge times [11]
MHE Parameter Establishment
- Perform preliminary runs with 5-6 extraction cycles to verify linearity of log(area) vs. injection number plot [56]
- Confirm that 3-4 cycles are sufficient for accurate extrapolation in routine analysis
- Establish consistent venting procedures between cycles to ensure atmospheric pressure reset
Calibration Approach
Specific Protocol: Residual Monomers in Polymers
This application note describes the determination of methylmethacrylic acid methyl ester (MMA) in polymers for corrective eyeglass lenses [58]:
Materials and Reagents:
- Polymer sample (eyeglass lens material)
- Methylmethacrylic acid methyl ester (MMA) standard
- High-purity solvent (appropriate for standard preparation)
- 20-mL headspace vials with PTFE/silicone septa and aluminum crimp caps [57]
Instrumentation Parameters:
- Headspace Sampler: Agilent 7697A or equivalent MHE-capable system
- Incubation: 120°C for 30 minutes
- Loop Temperature: 130°C
- Transfer Line: 140°C
- GC System: equipped with mass spectrometric detector
- Column: DB-624 or equivalent (30 m × 0.32 mm ID, 1.8 µm film)
- Oven Program: 40°C (hold 5 min), ramp 15°C/min to 240°C (hold 5 min)
- Carrier Gas: Helium, constant flow 1.5 mL/min
- MS Detection: Electron impact ionization, selective ion monitoring for MMA [58]
Quantitation:
- Prepare external calibration standards in solvent at concentrations spanning expected range
- Add identical solvent volume to samples and standards (typically 10-20 µL)
- Perform 4-6 extraction cycles for both standards and samples
- Construct MHE plots (log area vs. injection number) for each
- Calculate total area for each via extrapolation and determine sample concentration [56]
Specific Protocol: NDMA in Ranitidine Tablets
This protocol adapts the approach described by Perkins and Langford (2022) for MHE-SIFT-MS analysis [11]:
Materials and Reagents:
- Ranitidine tablets (representative sampling from batch)
- NDMA reference standard
- 20-mL headspace vials with appropriate septa
Instrumentation Parameters:
- Headspace Autosampler: Gerstel MPS Robotic Pro with purge tool or equivalent
- Incubation: 140°C for 20 minutes
- Headspace Injection: 2.5-mL headspace syringe, injection rate 50 µL/s
- SIFT-MS Instrument: Voice200ultra or Syft Tracer
- Reagent Ions: H₃O⁺, NO⁺, and O₂⁺• for intact NDMA ionization
- Analysis Time: Approximately 2 minutes per injection
- Multiple Extractions: 6 cycles for full method, single injection once calibrated [11]
Quantitation Approach:
- Develop full MHE calibration with 6 extraction cycles initially
- Establish correlation between first injection area and full MHE result
- For routine analysis, utilize single injection with weekly or monthly MHE verification
- Achieve throughput of approximately 12 samples per hour [11]
Essential Materials and Research Reagents
Table 3: Essential Research Reagent Solutions for MHE Analysis
| Category | Specific Items | Function/Purpose | Technical Specifications |
|---|---|---|---|
| Consumables | 10-mL, 20-mL headspace vials | Sample containment during incubation/injection | Larger vials allow larger sample volume and headspace [57] |
| PTFE/silicone septa, aluminum caps | Form pressure-tight seal to prevent volatile loss | Critical for reproducible results [57] | |
| Reference Standards | Target analyte standards (monomers, solvents) | Quantitative calibration | High purity, prepared in appropriate solvent [56] |
| Internal standards (if applicable) | Correction for injection variability | Deuterated analogs for MS detection | |
| Solvents & Reagents | High-purity solvents | Standard preparation and sample modification | Low volatile background, appropriate for analytes [56] |
| Non-volatile salts | Modify partition coefficient in aqueous samples | Increase volatility of analytes [57] | |
| Sample Modification | High-boiling solvents | Surface modification for solid samples | Form thin liquid film to aid analyte extraction [56] |
| Instrumentation | MHE-capable headspace sampler | Automated sample incubation and injection | Valve-and-loop design (e.g., Agilent 7697A) [57] |
| GC/MS or SIFT-MS system | Separation and detection of volatile compounds | GC/MS for separation, SIFT-MS for direct analysis [11] |
Critical Parameters for Success
Successful implementation of MHE for pharmaceutical quality control requires careful optimization of several key parameters:
Equilibration Temperature Optimization
- Temperature significantly affects the partition coefficient (K)
- Higher temperatures generally decrease K values, increasing volatile transfer to headspace [57]
- Maximum temperature typically 20°C below solvent boiling point
- Example: Ethanol in water shows K value decrease from ~1350 at 40°C to ~330 at 80°C [57]
Phase Ratio (β) Considerations
Equilibration Time
- Must be sufficient for equilibrium establishment between sample and headspace
- Sample-dependent; determined experimentally
- Insufficient time leads to non-linear MHE plots and inaccurate quantitation [56]
Matrix Considerations
Method Validation
Multiple Headspace Extraction represents a powerful solution for quantitative analysis of volatile impurities in challenging pharmaceutical matrices where traditional calibration approaches fail. By combining the automation benefits of static headspace with mathematical exhaustive extraction, MHE enables robust quantitation of residual solvents, monomers, process impurities, and sterilization residuals in insoluble drugs, packaging materials, and medical devices. The integration of modern detection technologies like SIFT-MS further enhances MHE's utility by dramatically reducing analysis times and improving throughput while maintaining the precision required for pharmaceutical quality control. As the demands for comprehensive impurity profiling continue to grow in drug development and manufacturing, MHE stands as an innovative technique that transforms analytically challenging problems into routine, automated solutions.
The In-Tube Extraction Dynamic Headspace (ITEX-DHS) technique represents a significant advancement in automated, green analytical methodologies for pharmaceutical quality control. As a solventless alternative to traditional sample preparation, ITEX-DHS aligns with the 12 principles of green chemistry by eliminating hazardous solvent waste, reducing energy consumption, and minimizing chemical exposure risks [59]. This technique provides a robust, sensitive, and fully automated solution for the analysis of volatile organic compounds (VOCs), making it particularly valuable for regulatory compliance and quality assurance in drug development and manufacturing [60] [61].
Within the pharmaceutical industry, ITEX-DHS addresses the critical need for reliable residual solvent analysis and impurity profiling. Residual solvents, classified as I, II, or III based on their risk potential, must be monitored to ensure final product safety, as mandated by regulatory bodies such as the FDA and European Pharmacopoeia [62]. The automation of ITEX-DHS not only enhances throughput and reproducibility but also positions pharmaceutical laboratories for sustainable operations by significantly reducing their environmental footprint [61] [59].
Key Characteristics and Performance Data
ITEX-DHS operates on the principle of dynamic headspace enrichment, where volatile analytes are repeatedly aspirated and expelled from the headspace of a sample vial through a packed adsorbent trap. This process concentrates the analytes prior to thermal desorption into the GC inlet, yielding significantly improved sensitivity compared to static techniques [60] [63].
Quantitative Performance Comparison
The following tables summarize key performance metrics for ITEX-DHS and related techniques, demonstrating its advantages for sensitive analysis.
Table 1: Comparison of Headspace Technique Performance Characteristics
| Technique | Typical Limit of Detection (LOD) Range | Repeatability (RSD%) | Extraction Yield (%) | Key Characteristics |
|---|---|---|---|---|
| ITEX-DHS | 0.1 - 68.6 µg kg⁻¹ [60] | < 11% [60] | Up to 80% [26] | Solventless, fully automated, high sensitivity [60] [61] |
| Headspace SPME | ~0.005 - 0.1 µg·g⁻¹ [64] | < 6.8% [64] | Varies with phase | Solventless, fiber-dependent, potential for carryover [63] |
| Static Headspace | ~7 µg·g⁻¹ [64] | < 27% [26] | ~10-20% [26] | Simple, low sensitivity, no enrichment [64] |
| DHS-VTT | Significantly lower than SPME/ITEX [63] | Data not provided | Up to 450x more intense signal vs. SPME [63] | Vacuum-assisted, high extraction efficiency, automated [63] |
Table 2: Application-Based Performance of ITEX-DHS
| Analyte Class | Sample Matrix | Key Performance Metrics | Reference |
|---|---|---|---|
| Volatile Organic Compounds (VOCs) | Olive Oil | LOD: 0.1 - 68.6 µg kg⁻¹; Recovery: 84-118%; Repeatability: 1-9% RSD for most analytes | [60] |
| Plastic Additives (47 compounds) | Plastic Polymers | Quantitation limits < 0.1 µg g⁻¹ for most compounds; Recovery: 70-128%; Precision: <20% RSD | [61] |
The data show that ITEX-DHS provides a compelling combination of high sensitivity, excellent repeatability, and robust performance across diverse sample types. Its ability to achieve detection limits in the low µg kg⁻¹ range makes it suitable for trace-level analysis of impurities and residual solvents in pharmaceutical products [60].
Detailed Experimental Protocol: Residual Solvent Analysis in a Drug Substance
This protocol describes a detailed methodology for quantifying Class 1 and Class 2 residual solvents in an Active Pharmaceutical Ingredient (API) using fully automated ITEX-DHS-GC-MS.
Materials and Reagents
- API Sample: Powdered drug substance.
- Standards: Certified reference materials of target solvents (e.g., benzene, toluene, chloroform, hexane, methanol).
- Internal Standard: Deuterated solvent (e.g., toluene-d8) or other suitable compound not present in the sample.
- Water: Ultra-high purity (UHP) water, solvent grade.
- Headspace Vials: 20 mL glass vials with PTFE/silicone septa and crimp caps.
ITEX-DHS Instrument Configuration and Conditions
- ITEX Device: Configured with a Tenax TA adsorbent trap.
- Autosampler: Capable of agitator heating and ITEX operations (e.g., Gerstel MultiPurpose Sampler, CTC Analytics PAL).
- GC-MS System: Gas Chromatograph coupled with a Mass Spectrometer.
Table 3: Standardized ITEX-DHS and GC-MS Operating Conditions
| Parameter | Setting | Notes / Rationale |
|---|---|---|
| Sample Preparation | Weigh 0.5 g API into 20 mL HS vial. Add 1 mL UHP water and internal standard. | Aqueous suspension enhances VOC release. Use matrix-matched calibration. |
| ITEX-DHS Incubation | Temperature: 80 °C; Time: 10 min; Agitation: 500 rpm | Optimizes transfer of volatiles to headspace. |
| ITEX-DHS Extraction | Aspirated Volume: 1000 µL; Number of Extraction Strokes: 50; Stroke Speed: 100 µL/s | Repeatedly draws and injects headspace vapor through the trap for analyte enrichment. |
| ITEX-DHS Desorption | Desorption Temperature: 250 °C; Time: 1 min; Injector Split Ratio: 1:10 | Rapidly transfers trapped analytes to the GC column. |
| GC Oven Program | Initial: 40 °C (hold 5 min), Ramp: 10 °C/min to 240 °C (hold 5 min) | Separates solvent mixtures effectively. |
| Carrier Gas | Helium, constant flow: 1.0 mL/min | |
| MS Detection | Ionization: EI (70 eV); Acquisition: SIM mode for target ions | Selected Ion Monitoring (SIM) enhances sensitivity. |
Procedure
- Preparation of Calibration Standards: Prepare a series of standard solutions in blank matrix (e.g., placebo or UHP water) spanning the expected concentration range, including the internal standard.
- Sample Preparation: Precisely weigh 0.5 g ± 0.001 of the API into a 20 mL headspace vial. Add 1 mL of UHP water and a fixed volume of internal standard solution. Seal the vial immediately.
- Automated Analysis: Load the prepared vials into the autosampler tray. The automated sequence performs the following steps without intervention:
- Incubation: Heats and agitates the vial to reach equilibrium between the sample and headspace.
- Extraction: The ITEX needle pierces the septum, and the syringe repeatedly aspirates and dispenses headspace volume through the adsorbent trap, concentrating the analytes.
- Desorption: The trap is moved to the GC injector, heated to 250°C, and the analytes are flushed onto the GC column with the carrier gas.
- GC-MS Analysis: Separated analytes are detected by the mass spectrometer operating in SIM mode.
- Quantitation: Construct a calibration curve by plotting the ratio of the analyte peak area to the internal standard peak area against the known analyte concentration. Use this curve to calculate the concentration of residual solvents in the unknown API sample.
The Scientist's Toolkit: Essential Research Reagent Solutions
Table 4: Key Materials and Reagents for ITEX-DHS Methods
| Item | Function / Description | Application Example |
|---|---|---|
| ITEX Trap (Tenax TA) | Porous polymer adsorbent for trapping a wide range of VOCs. | General-purpose residual solvent analysis in APIs [60]. |
| ITEX Trap (Carbon) | Graphitized carbon black for trapping very volatile compounds. | Analysis of gases or low molecular weight solvents (e.g., methane, ethane) [26]. |
| Deuterated Internal Standards | Chemically similar, non-interfering compounds for internal calibration. Corrects for sample loss and instrument variability. | Quantification of toluene using toluene-d8 [61]. |
| Matrix-Matched Standards | Calibration standards prepared in a blank sample matrix. | Essential for compensating for matrix effects in complex samples like APIs [61]. |
| Ultra-High Purity Water | A solvent for creating sample suspensions, free of volatile contaminants. | Aqueous suspension of solid API samples to enhance VOC release [64]. |
Workflow and Logical Pathway Visualization
The following diagram illustrates the logical workflow of method development and application for ITEX-DHS in a pharmaceutical quality control context.
ITEX-DHS Pharmaceutical QC Workflow
The workflow outlines the critical phases, from initial method development and optimization to the fully automated analysis of samples and final data reporting for regulatory compliance.
ITEX-DHS Automated Analysis Process
This sequence details the core automated steps of the ITEX-DHS technique, from sample incubation to the generation of the final analytical result.
Solving Common Challenges in Automated Headspace Operations
In the context of pharmaceutical quality control, the repeatability of automated headspace gas chromatography (HS-GC) is paramount for regulatory compliance and patient safety. Analyses such as residual solvent testing per USP <467> and ICH Q3C guidelines demand robust methods that produce consistent results across instruments, operators, and time [12]. Poor repeatability can lead to costly batch failures, regulatory non-compliance, and potential patient risks. Three fundamental factors significantly impact method variability: the establishment of equilibrium, precise temperature control, and vial sealing integrity [65] [66]. This application note details the underlying causes of poor repeatability and provides optimized, actionable protocols to address these challenges within a pharmaceutical development framework.
Theoretical Foundations of Repeatability
The Headspace Equilibrium System
In a static headspace system, the sample is heated in a sealed vial until the volatile analytes partition between the sample matrix (liquid/solid) and the gas phase (headspace). At equilibrium, the relationship is described by the partition coefficient (K) and the phase ratio (β) [65]:
- Partition Coefficient (K): ( K = CS / CG ), where ( CS ) is the analyte concentration in the sample phase and ( CG ) is the concentration in the gas phase.
- Phase Ratio (β): ( β = VG / VS ), where ( VG ) is the volume of the gas phase and ( VS ) is the volume of the sample phase.
The gas-phase concentration measured by the GC is a function of the original sample concentration (( C0 )) and these parameters [65]: [ CG = \frac{C_0}{K + β} ]
The sensitivity of the analysis is maximized when the sum of K and β is minimized. For analytes with high solubility in the sample matrix (a large K), even minor, uncontrolled variations in temperature or sample volume can lead to significant changes in the measured gas-phase concentration, directly impacting repeatability [65].
Impact of Analyte Properties
The effect of operational parameters on repeatability is highly dependent on the physicochemical properties of the analyte, particularly its solubility in the sample matrix.
Table 1: Impact of Temperature on Analytes with Different Distribution Coefficients (K)
| Analyte Property | Example | Impact of Temperature on Peak Area | Effect on Repeatability |
|---|---|---|---|
| High Solubility (K >> β) | Ethanol in Water | Large increase with temperature (6.3-fold from 40°C to 80°C) [65] | Highly sensitive to minor temperature fluctuations; poor repeatability if temperature is not tightly controlled. |
| Low Solubility (K << β) | n-Hexane in Water | Minimal change with temperature [65] | Less sensitive to temperature variation; generally better inherent repeatability. |
A systematic approach is required to diagnose the root cause of poor repeatability. The following workflow outlines a logical troubleshooting path, focusing on the three core issues.
Figure 1: A logical workflow for troubleshooting poor repeatability in automated headspace sampling, focusing on equilibrium, temperature, and sealing.
Protocol: Establishing Optimal Equilibration Time
Objective: To determine the minimum equilibration time required to reach a stable headspace concentration for reliable quantitative analysis [66].
- Preparation: Prepare a single, homogeneous batch of a standard solution containing target analytes (e.g., a residual solvent mix per USP <467>) in the appropriate matrix.
- Sample Loading: Transfer identical sample volumes into at least 10 headspace vials. Seal all vials using the same lot of crimp caps and septa.
- Time-Series Analysis: Place all vials in the autosampler. Program the method to inject vials at progressively longer equilibration times (e.g., 5, 10, 20, 30, 40, 50, 60, 75, 90, 120 minutes).
- Data Collection and Analysis: Run the sequence and record the peak areas for each analyte at each time point.
- Plot the mean peak area (n=3 recommended if autosampler capacity allows) versus equilibration time for each critical analyte.
- Determine the point where the peak area stabilizes (e.g., <2% RSD for consecutive time points). The optimal equilibration time is 110-120% of this stabilization time to ensure robustness.
Protocol: Quantifying Temperature Sensitivity
Objective: To assess the impact of incubation temperature variability on analytical results and identify thermally labile compounds [65] [66].
- Preparation: Prepare a homogeneous batch of standard solution as in Protocol 3.1.
- Temperature Gradient: Program the autosampler method to incubate sets of vials (n=3-5) at different temperatures, spanning the intended method temperature (e.g., 60°C, 65°C, 70°C, 75°C, 80°C). Keep all other parameters constant, including an equilibration time verified to be sufficient from Protocol 3.1.
- Data Collection and Analysis: Run the sequence and record the peak areas.
- Calculate the mean and relative standard deviation (RSD) of the peak areas at each temperature.
- Plot the mean peak area versus temperature for each analyte. A steep slope indicates high temperature sensitivity, necessitating exceptionally tight temperature control.
Protocol: Verifying Vial Sealing Integrity
Objective: To confirm that the vial sealing system (septa and crimp caps) prevents analyte loss over the typical incubation period [66].
- Preparation: Prepare a homogeneous batch of standard solution. Seal all vials meticulously using a calibrated crimper.
- Stress Test: Incubate a set of vials (n=5) in the autosampler at the method temperature. Program the system to inject the same set of vials multiple times over an extended period (e.g., injections at 0, 30, 60, 90, 120 minutes of incubation time).
- Data Collection and Analysis: For each vial, plot the peak area of each analyte against the cumulative incubation time.
- A significant negative trend (e.g., >5% decrease per hour) indicates a leak, likely due to poor septa quality, improper crimping, or septa failure from repeated needle punctures.
Optimized Protocols for Enhanced Repeatability
Based on the investigation, the following protocols provide optimized conditions for robust pharmaceutical analysis.
Optimized Equilibration using DoE
A one-variable-at-a-time (OVAT) approach is inefficient for understanding parameter interactions. Using Design of Experiments (DoE) is a superior strategy [42].
Table 2: Central Composite Face-Centered (CCF) Experimental Design for Optimizing Headspace Extraction
| Factor | Low Level (-1) | Center Point (0) | High Level (+1) | Observed Effect |
|---|---|---|---|---|
| Equilibration Time (min) | 20 | 40 | 60 | Positive, often shows interaction with temperature [42]. |
| Equilibration Temperature (°C) | 60 | 70 | 80 | Strong positive main effect; significant interaction with time [42]. |
| Sample Volume (mL) | 1 | 5.5 | 10 | Strong negative impact; larger volumes reduce headspace (V_G), decreasing sensitivity [42]. |
| Salting-Out (NaCl concentration) | 0% w/v | 10% w/v | 20% w/v | Increases ionic strength, improving partitioning of polar analytes into the headspace [42]. |
Protocol:
- Experimental Design: Use software to generate a CCF design with the factors in Table 2. The response variable is the chromatographic peak area per microgram of analyte.
- Execution: Prepare and analyze samples according to the randomized run order provided by the design.
- Analysis: Use analysis of variance (ANOVA) to identify significant factors and interaction effects. The model will predict the parameter set that maximizes the response (peak area) and robustness.
Protocol for Tight Temperature Control
Objective: To minimize the impact of temperature fluctuations on analytical repeatability, especially for solvents with high K values [65] [66].
- Instrument Qualification: Verify the calibration of the autosampler's incubation oven temperature using a traceable, NIST-certified thermometer.
- Method Setup: Always include a pre-heating position in the autosampler method. This allows samples to begin warming outside the oven, reducing thermal shock and temperature recovery time when they are moved into the incubation oven.
- Standardized Handling: Ensure all samples and standards are at room temperature before placement in the autosampler to minimize intra-sequence temperature variation.
- Pre-equilibration: For highly temperature-sensitive methods, pre-equilibrate the entire autosampler tray to the method temperature before starting the run.
Protocol for Reliable Vial Sealing
Objective: To ensure a consistent, leak-free seal for every vial in a sequence [66].
- Component Selection: Use high-quality headspace vials and certified caps/septa from reputable suppliers. Select septa with low levels of leachables and extractables, and ensure they are compatible with the specified incubation temperature and solvent mixture [67] [50].
- Crimping: Use a properly calibrated crimping tool. Apply consistent torque to achieve a uniform crimp. Inspect the crimp for symmetry and ensure the septa is not overly compressed.
- Puncture Strategy: If using an autosampler that allows it, program the needle to puncture the septa at different locations for subsequent injections from the same vial to prevent creating a leak path.
The Scientist's Toolkit: Essential Research Reagents & Supplies
Table 3: Key Materials for Robust Automated Headspace Analysis
| Item | Function & Importance | Recommendation for Repeatability |
|---|---|---|
| Headspace Vials | Primary sample container. | Use borosilicate glass vials with uniform dimensions to ensure consistent heating and fit in the autosampler [67]. |
| Septa | Creates a gas-tight seal. | Use PTFE/silicone septa. Certified for low leachables/absorbables. Visually inspect and discard if damaged. Use a fresh septa for each vial in validation studies [67]. |
| Crimp Caps | Secures the septa to the vial. | Use aluminum caps with a specified torque. Ensure the crimper is calibrated to apply consistent force [67]. |
| Internal Standards | Corrects for injection volume variability and minor sample preparation errors. | Use a deuterated or structurally similar analog to the analyte that is not present in the sample. It must behave similarly during headspace partitioning [68]. |
| Matrix-Matching Calibrants | Compensates for the matrix effect, where the sample composition alters the partitioning behavior of the analyte. | Prepare calibration standards in the same solvent or blank matrix as the sample (e.g., placebo formulation) to ensure accurate quantification [68]. |
| Salting-Out Agents | Modifies the partition coefficient (K). | Use high-purity salts (e.g., NaCl, Na₂SO₄). Adding salt increases ionic strength, reducing the solubility of volatile analytes in the aqueous phase and driving them into the headspace, which boosts sensitivity [42]. |
Achieving excellent repeatability in automated headspace sampling for pharmaceutical quality control is a systematic process. By understanding the theoretical principles of equilibrium and proactively investigating the three pillars of repeatability—equilibration time, temperature control, and sealing integrity—researchers can develop robust, reliable, and regulatory-compliant methods. The application of modern optimization techniques like DoE, coupled with the use of high-quality consumables detailed in the "Scientist's Toolkit," provides a clear pathway to overcoming the challenge of poor repeatability, ensuring the safety and quality of pharmaceutical products.
In the context of pharmaceutical quality control, the accurate detection and quantification of volatile organic compounds—such as residual solvents in active pharmaceutical ingredients (APIs)—are critical for ensuring drug safety and efficacy. Automated headspace sampling coupled with gas chromatography (HS-GC) is a widely adopted technique for this purpose. However, analysts frequently encounter challenges related to low analytical sensitivity and unsatisfactory chromatographic peak area, which can compromise data reliability and regulatory compliance. This Application Note delineates a systematic, evidence-based protocol for optimizing headspace analysis by focusing on the manipulation of key physical parameters and the strategic application of the salting-out effect to enhance method performance significantly.
Key Parameters Affecting Sensitivity and Peak Area
The sensitivity of a headspace-GC method and the resulting analyte peak area are governed by the partition coefficient (K), defined as the ratio of an analyte's concentration in the sample phase to its concentration in the gas phase at equilibrium. A lower K value signifies a greater proportion of the analyte in the headspace, leading to enhanced transfer to the GC column and improved detection. Several critical parameters directly influence this equilibrium and, consequently, the method's sensitivity [69].
Table 1: Key Headspace Parameters for Optimization
| Parameter | Effect on Analysis | Optimization Guidance | Primary Impact |
|---|---|---|---|
| Incubation Temperature | ↑ Temperature decreases K for most analytes, driving them into the headspace. | Set oven temperature to 20°C below the boiling point of the sample matrix solvent. Avoid temperatures causing analyte degradation [69]. | Increases volatile concentration in headspace. |
| Equilibration Time | Time required for the system to reach equilibrium partitioning. | Application-dependent; must be determined during method development. Sample pre-heating can minimize the time delay for the first sample [69]. | Ensures analytical reproducibility. |
| Sample Volume | Has a strong negative impact on extraction efficiency; smaller volumes can improve sensitivity. | A CCF experimental design identified sample volume as a parameter with a strong negative impact on the response variable (Area per μg) [70]. | Improves analyte transfer efficiency. |
| Vial & Septa Selection | Ensures system integrity and influences equilibration. | At least 50% of the vial volume should be headspace. Septa must withstand incubation temperatures without degrading [69]. | Maintains system integrity and prevents leaks. |
| Sample Transfer & Liner | Affects peak shape and band broadening. | Use a narrow bore liner (e.g., 1.2mm ID) to prevent band broadening and produce sharper peaks [69]. | Improves chromatographic resolution. |
| Split Ratio | Controls the amount of sample vapor entering the column. | A higher split ratio results in sharper peaks. For low-concentration analytes, a high split ratio may lead to loss of sensitivity [69]. | Sharpens peaks but can reduce sensitivity. |
The Salting-Out Effect: Mechanism and Application
The "salting-out" effect is a powerful technique for enhancing the extraction of volatile analytes from aqueous samples. The underlying mechanism involves the reduction of a solute's solubility in an aqueous solution of high ionic strength, thereby driving the analyte into the headspace gas phase [71].
Mechanism of Action
At a molecular level, the addition of salt increases the ionic strength of the solution. The ions from the salt become heavily hydrated, competing for and effectively "tying up" water molecules through dipole-dipole interactions and hydrogen bonding. This leaves fewer free water molecules available to solvate other polar analyte molecules, reducing their solubility and increasing their activity coefficient. For volatile organic compounds, this results in a lower partition coefficient (K) and a higher concentration in the headspace, leading to a larger peak area [71]. This process is quantitatively described for dilute solutions by the Setschenow equation [71].
Salt Selection and the Hofmeister Series
The effectiveness of a salt in inducing salting-out is not universal. Empirical observations have been systematized into the Hofmeister series, which ranks ions based on their ability to precipitate proteins and, by extension, their salting-out efficacy [71].
- Anions generally have a more pronounced effect than cations.
- Kosmotropic ions (e.g., SO₄²⁻, HPO₄²⁻, CO₃²⁻, CH₃COO⁻, Cl⁻) are order-making and promote salting-out.
- Chaotropic ions (e.g., SCN⁻, I⁻, NO₃⁻, Br⁻, ClO₄⁻) are chaos-forming and are more likely to cause "salting-in," which increases solubility.
For most analytical applications, small, multiply charged (kosmotropic) salts are most effective. Sodium chloride (NaCl) is commonly used due to its high solubility, low cost, and minimal interference. However, other salts like magnesium sulfate (MgSO₄) or sodium sulfate (Na₂SO₄) may be more effective for specific applications [69] [71].
Application and Limitations
The salting-out effect is particularly beneficial for polar analytes in aqueous matrices. A study optimizing volatile hydrocarbon extraction from water demonstrated that a statistically validated model confirmed the significant synergistic effects of temperature and interaction terms on extraction efficiency [70]. Furthermore, research on bronchoalveolar lavage fluid (BALF) samples showed that increasing the salt concentration (NaCl) to 40% (w/v) resulted in an 80% increase in the total number of detected peaks and a 340% increase in total peak area compared to no salt addition [72].
However, the effect is application-dependent. Analytes with already low K values may show little improvement, and the addition of salt could inadvertently drive unwanted matrix components into the headspace [69]. The technique is a cornerstone of the "QuEChERS" method for pesticide analysis in produce, which typically uses a mixture of MgSO₄ and NaCl to drive polar pesticides into the organic acetonitrile phase [71].
Experimental Protocol: Optimization for Pharmaceutical Residual Solvents
This protocol outlines the development and optimization of a headspace-GC-FID method for determining residual solvents in an API, such as Losartan Potassium, based on published studies [4].
Materials and Reagents
- API Sample: e.g., Losartan Potassium.
- Standard Solutions: Target residual solvents (e.g., Methanol, Isopropyl Alcohol, Toluene, Chloroform) in appropriate purity grades.
- Diluent: Dimethylsulfoxide (DMSO), GC grade. Using a high-boiling point solvent like DMSO minimizes interference and can improve sensitivity for certain analytes compared to water [4].
- Salting-Out Reagent: Sodium Chloride (NaCl), analytical grade, or another salt selected from the Hofmeister series.
- Equipment: Automated Headspace Sampler, Gas Chromatograph with FID, DB-624 capillary column (or equivalent), 20 mL headspace vials, septa, and crimper.
Instrumental Conditions
- GC Column: Agilent DB-624 (30 m × 0.53 mm × 3.0 µm).
- Oven Program: 40°C (hold 5 min), ramp to 160°C at 10°C/min, then to 240°C at 30°C/min (hold 8 min).
- Carrier Gas: Helium, constant flow (e.g., 4.7 mL/min).
- Injector/Split: 190°C, split ratio 1:5.
- FID Detector: 260°C.
- Headspace Conditions: Incubation temperature: 100°C; Equilibration time: 30 min; Transfer line temperature: 110°C; Pressurization time: 1 min [4].
Step-by-Step Optimization Procedure
- Sample Preparation: Prepare standard and sample solutions in DMSO. For the salting-out experiment, weigh an appropriate amount of salt (e.g., 200 mg for 40% w/v in a 0.5 mL sample) directly into the headspace vial before adding the sample solution. Crimp the vial immediately to ensure integrity.
- Initial Screening (One-Factor-at-a-Time):
- Vary the incubation temperature (e.g., 80, 90, 100°C) while keeping other factors constant.
- Vary the equilibration time (e.g., 20, 30, 40 min) at the optimal temperature.
- Assess the impact of salt addition (0%, 20%, 40% w/v NaCl) on peak areas of the target analytes.
- Systematic Optimization (Experimental Design): For a robust method, employ a Central Composite Design (CCF). The model should include factors like sample volume, temperature, and equilibration time, with the response variable defined as the total chromatographic peak area per microgram of analyte. Analyze the data using Analysis of Variance (ANOVA) to determine the significance of each factor and their interactions [70].
- Method Validation: Once optimized, validate the method according to ICH or other relevant guidelines (e.g., ANVISA RDC 166/2017) for parameters including selectivity, linearity, precision (RSD ≤ 10.0%), accuracy (recovery 95-110%), and limits of quantification (LOQ) [4].
Workflow and Material Toolkit
Optimization Workflow Diagram
The following diagram illustrates the logical sequence for optimizing a headspace method, integrating both parameter adjustment and the salting-out strategy.
Research Reagent Solutions
Table 2: Essential Materials for Headspace-GC Optimization
| Item | Function / Rationale | Example / Specification |
|---|---|---|
| Headspace Vials | Container for sample equilibration; must be sealed and inert. | 10-20 mL glass vials with PTFE/silicone septa. 10 mL vials can concentrate headspace more effectively [72]. |
| Salting-Out Reagents | Increases ionic strength to drive volatile analytes into the headspace. | Sodium Chloride (NaCl), Magnesium Sulfate (MgSO₄). Selection guided by Hofmeister series [71]. |
| High-Boiling Point Diluent | Dissolves sample without contributing to volatile background. | Dimethylsulfoxide (DMSO). Preferred over water for some APIs due to higher boiling point and better solubility [4]. |
| Narrow Bore Liner | Improves transfer efficiency and peak shape by reducing band broadening. | Liner with 1.2mm internal diameter [69]. |
| Certified Reference Standards | For instrument calibration and method validation. | Individual or mixed solvent standards in GC-grade purity. |
| Automated HS Sampler | Provides reproducibility in sample incubation, pressurization, and transfer. | Model such as Agilent 7697A, capable of precise temperature and pressure control [4]. |
Optimizing sensitivity and peak area in automated headspace analysis is a multifaceted endeavor crucial for pharmaceutical quality control. A systematic approach that meticulously controls incubation temperature, equilibration time, and sample volume forms the foundation of a robust method. The strategic application of the salting-out effect, leveraging salts like sodium chloride based on the Hofmeister series, provides a powerful means to significantly enhance analyte response, sometimes by several hundred percent. By adhering to the detailed protocols and optimization workflows outlined in this application note, scientists and drug development professionals can develop highly sensitive, reliable, and validated headspace-GC methods that ensure the safety and quality of pharmaceutical products.
Identifying and Eliminating High Background and Ghost Peaks
In the context of pharmaceutical quality control, ensuring the accuracy and reliability of analytical data is paramount. Automated headspace gas chromatography (HS-GC) is a widely adopted technique for the analysis of volatile components, such as residual solvents in active pharmaceutical ingredients (APIs) and drug products [8]. However, the presence of high background signals and ghost peaks—unexpected, extraneous peaks that do not originate from the sample—can compromise data integrity, lead to false out-of-specification (OOS) results, and necessitate costly and time-consuming investigations [73] [74]. Ghost peaks are particularly problematic in gradient elution methods and when detecting low-concentration impurities [75]. This application note details systematic protocols for identifying and eliminating these artifacts within the framework of automated headspace sampling for pharmaceutical quality control.
Understanding Ghost Peaks and High Background
Ghost peaks, also termed artifact or system peaks, are chromatographic signals observed during the analysis of presumably clean solvents or blank samples [75]. They can arise from numerous sources within the analytical system, including contaminated mobile phases, system components, or sample preparation materials [73]. High background refers to an elevated or unstable baseline, which can obscure target peaks and reduce the sensitivity and accuracy of quantification. In regulated environments, unexplained chromatographic peaks can trigger OOS investigations and cast doubt on the validity of release testing data [76] [74].
The following diagram illustrates the logical relationship between primary sources of ghost peaks and their respective sub-causes, providing a structured overview for troubleshooting.
Identification and Diagnostic Protocols
Preliminary Examination of Chromatograms
The initial identification of ghost peaks involves a careful examination of the chromatogram [73].
- Analyze Retention Times: Compare retention times of suspected ghost peaks with those of known analytes. Peaks at times not corresponding to any target analyte are suspect [73].
- Assess Peak Shape: Ghost peaks often exhibit irregular shapes—broader, more diffuse, or with greater tailing compared to sharp, well-defined analyte peaks [73].
- Evaluate Baseline Stability: Monitor for sudden baseline deviations, rises, or "bumps" that may indicate ghost peaks or high background [74].
- Utilize UV Spectral Data: If a photodiode array (PDA) or similar detector is available, analyze the UV spectrum of the suspect peak. A spectrum that does not match any known compound in the sample is indicative of a ghost peak [75].
Systematic Diagnostic Experiments
A step-by-step diagnostic approach is required to isolate the source of contamination.
Protocol 1: Blank Gradient Run
Objective: To determine if the ghost peaks originate from the chromatographic system or the mobile phases [75] [74].
- Preparation: Connect the GC system with the headspace sampler and install the analytical column.
- Method Setup: Use the same temperature program and gas flows as the analytical method. For liquid injection systems, perform a blank injection with pure solvent [74].
- Execution: In an automated headspace system, run a method sequence with a sealed, empty vial or a vial containing only the sample diluent (e.g., N-Methyl-2-pyrrolidone for residual solvents analysis) [8].
- Analysis: Observe the resulting chromatogram. Any peaks present are system-related ghost peaks.
Protocol 2: System Isolation Test
Objective: To isolate the source of ghost peaks to specific hardware components [75].
- Preparation: Remove the analytical column from the system and replace it with a zero-dead-volume union connector.
- Method Setup: Use a simplified isocratic or temperature program.
- Execution: For headspace systems, run a method with a clean, empty vial. For LC systems, inject a pure solvent blank [75] [73].
- Analysis: Peaks observed in this configuration indicate contamination within the system itself, such as the headspace transfer line, GC inlet, injector, or detector flow cell [75].
Protocol 3: Mobile Phase and Reagent Qualification
Objective: To identify impurities originating from solvents, water, or buffer components [74].
- Preparation: Prepare fresh mobile phases or diluents using different lots or high-purity grades of each reagent (water, organic solvents, salts, acids/bases).
- Experimental Design: Employ a "one-variable-at-a-time" approach. For example, compare blanks prepared with different brands of acetic acid or ammonium hydroxide while keeping all other factors constant [74].
- Execution: Run the blank gradient method for each new preparation.
- Analysis: Compare the chromatograms to identify which reagent is the source of specific ghost peaks. An example of this approach is shown in Table 1.
Table 1: Example Identification of Ghost Peak Sources from Reagents
| Ghost Peak Retention Time (min) | Source Identified | Experimental Evidence |
|---|---|---|
| 11 | Ammonium Hydroxide | Peak present only with Brand A ammonium hydroxide [74] |
| 15, 23, 25, 30 | Acetic Acid | Peaks present only with Brand 1 acetic acid [74] |
| 24 | Acetonitrile | Peak present only with Brand X acetonitrile [74] |
Protocol 4: Sample Preparation Component Testing
Objective: To determine if ghost peaks originate from vials, septa, or other consumables.
- Preparation: Obtain high-quality, contaminant-free headspace vials and caps. Rinse vials multiple times with a high-purity solvent if necessary [75].
- Execution: Run a blank with a pristine, sealed vial. Compare this to a blank run using the standard vials and septa.
- Analysis: The appearance of additional peaks with the standard consumables indicates leachables or contaminants from these sources [75].
Elimination and Prevention Strategies
Mobile Phase and Reagent Management
The quality of solvents and reagents is a frequent source of ghost peaks.
- Use High-Purity Reagents: Select HPLC-grade or headspace-grade solvents and high-purity water (e.g., 18.2 MΩ-cm from a Milli-Q system) [75] [8].
- Implement Solvent Testing: Establish a quality control protocol for new lots of critical reagents by running a blank analysis before use in production methods [74].
- Ensure Proper Degassing: Degas mobile phases thoroughly using helium sparging, sonication, or vacuum degassing to prevent bubble formation that can cause baseline disturbances [75] [73].
- Prepare Fresh Solutions: Regularly prepare fresh mobile phases and buffer solutions to avoid the accumulation of organic substances or microbial growth [75].
System Maintenance and Hardware Care
Routine and preventive maintenance is crucial for minimizing system-derived artifacts.
- Prevent Carryover: Implement and optimize needle wash procedures and use in-line filters to trap particulates [75].
- Maintain Autosampler Components: Regularly replace worn injector seals, septa, and liners. For headspace systems, ensure the sampling needle and transfer line are clean [75] [77].
- Replace Degraded Parts: Proactively replace pump seals and check for leaks in the flow path [75] [73].
- Clean Detector Flow Cells: Follow manufacturer guidelines for periodic cleaning of the detector flow cell to remove accumulated contaminants [74].
Sample Preparation and Handling
- Use Certified Consumables: Use high-quality, contaminant-free vials and caps designed for headspace analysis to ensure a tight seal and minimize leachables [75] [78].
- Employ Sample Clean-up: For complex matrices, implement sample preparation procedures such as filtration or solid-phase extraction to remove interfering compounds [75].
Advanced Troubleshooting Techniques
For persistent issues, consider these advanced solutions:
- Ghost Traps and Guards: Install mobile phase cleaning columns (e.g., Ghost Trap) upstream of the system. These cartridges tightly bind impurities, preventing them from eluting onto the analytical column [75].
- Multiple Headspace Extraction (MHE): For challenging solid or complex matrices, MHE can improve quantitation accuracy by performing multiple sampling cycles from the same vial to fully extract volatile compounds [78].
The Scientist's Toolkit: Essential Research Reagents and Materials
The following table details key materials and reagents essential for performing reliable automated headspace analysis and troubleshooting ghost peaks in a pharmaceutical quality control setting.
Table 2: Key Research Reagent Solutions for Automated Headspace-GC
| Item | Function & Importance | Recommended Specifications |
|---|---|---|
| Headspace-Grade Diluent | To dissolve samples without introducing volatile impurities. Critical for preparing standards and samples. [8] | High-purity solvent (e.g., N-Methyl-2-pyrrolidone, DMF); low in volatile impurities. |
| Certified Residual Solvent Standards | For instrument calibration and method qualification to ensure accuracy and compliance with ICH Q3C guidelines. [8] | Custom-made stock solutions with certified concentrations of Class 2 and Class 3 solvents. |
| High-Purity Water | For preparation of aqueous standards and mobile phases. A common source of ghost peaks if impure. [75] [74] | HPLC-grade or Type I water (18.2 MΩ-cm resistivity) from a validated purification system. |
| Inert Headspace Vials & Caps | To contain samples and form a pressure-tight seal, preventing loss of volatiles and introduction of leachables. [75] [78] | 10-mL or 20-mL vials with PTFE/silicone septa; certified for low background contamination. |
| Ghost Trap/Guard Column | An in-line cartridge placed before the analytical column to remove trace contaminants from the mobile phase gas stream. [75] | Commercial mobile phase cleaning columns (e.g., Ghost Trap DS). |
| Certified Gases | To serve as the carrier gas and as the pressurization gas for the headspace sampler. | Ultra-high-purity helium, nitrogen, or hydrogen with built-in gas purifiers. |
The integrity of pharmaceutical quality control data generated via automated headspace gas chromatography is highly dependent on the analyst's ability to identify and eliminate high background and ghost peaks. A systematic, step-by-step investigative approach is far more effective than random checks. This involves methodically isolating potential sources—from the chromatographic system and mobile phases to reagents and sample preparation components. By implementing rigorous preventive measures, including the use of high-purity materials, consistent system maintenance, and robust standard operating procedures, laboratories can significantly reduce the occurrence of these artifacts. A well-controlled system ensures reliable, accurate, and defensible data, which is fundamental to patient safety and regulatory compliance in the pharmaceutical industry.
Managing Retention Time Drift and Peak Overlap
In the context of pharmaceutical quality control, ensuring the reliability of analytical data is paramount. Automated headspace gas chromatography (GC) is a cornerstone technique for analyzing volatile compounds, prominently featured in methods such as the United States Pharmacopeia (USP) <467> for residual solvents and the analysis of volatile impurities in active pharmaceutical ingredients (APIs) and finished drug products [79]. However, two persistent challenges that can compromise data integrity are retention time drift and peak overlap. Retention time drift refers to the gradual shift in an analyte's elution time over a series of injections, while peak overlap occurs when two or more analytes co-elute, preventing accurate quantification [80] [81] [82]. Within a quality control framework, these issues can lead to misidentification, inaccurate quantitation, and ultimately, regulatory compliance risks. This application note provides detailed protocols and strategies for diagnosing, troubleshooting, and resolving these challenges in an automated headspace GC environment, ensuring robust and reliable analytical methods for pharmaceutical research and development.
Theoretical Foundations of Headspace GC
Static headspace sampling for GC is a two-step process. First, a sample is incubated in a sealed vial at a controlled temperature until the volatile analytes partition between the sample matrix (liquid or solid) and the gas phase (headspace) above it, reaching a state of equilibrium [79]. Second, a portion of this headspace gas is automatically transferred to the GC inlet for separation and analysis.
The detector response in headspace analysis is governed by the fundamental equation [79]: A ∝ CG = C0 / (K + β)
Where:
- A is the chromatographic peak area.
- CG is the concentration of the analyte in the gas phase (headspace).
- C0 is the original concentration of the analyte in the sample.
- K is the partition coefficient, representing the equilibrium distribution of the analyte between the sample phase and the gas phase (K = CS / CG).
- β is the phase ratio, defined as the ratio of the headspace volume (VG) to the sample volume (VS) in the vial (β = VG / VS) [79].
To maximize detector response, the sum of K and β must be minimized. This is practically achieved by optimizing incubation temperature (which reduces K) and the sample volume or vial size (which reduces β) [79]. Understanding this relationship is crucial for method development and for troubleshooting issues related to sensitivity and reproducibility, which can be linked to retention time stability and peak shape.
Understanding and Managing Retention Time Drift
Retention time drift is a progressive change in elution time over an analytical campaign. It is critical to distinguish whether the drift affects both the analyte retention time (tr) and the unretained marker time (t0) equally, or if the t0 remains constant while tr changes. A uniform shift in both tr and t0 typically indicates a hardware-related flow rate issue, whereas a change in the retention factor (k = (tr - t0)/t0) points to a chemical change in the separation system [80] [83].
Table 1: Troubleshooting Retention Time Drift in Automated Headspace-GC
| Symptom & Root Cause | Diagnostic Experiments | Corrective Protocol |
|---|---|---|
| Drift in tr and t0 (Flow Rate Issues) | ||
| Small leak in the flow path [80] [83] | Check for microscopic leaks using a folded piece of laboratory absorbent paper (e.g., blue roll) at all unions, the injection port, and column connections. Look for a dark blue wet spot [80]. | Tighten connections or replace faulty parts (ferrules, seals). For automated headspace samplers, inspect the needle seal and transfer line connections [81]. |
| Unstable carrier gas pressure/flow [81] | Monitor pressure and flow readings on the GC for instability. Verify flow rate accuracy with a calibrated flow meter or by measuring eluent volume over time [80] [83]. | Service the electronic pressure control (EPC) module or replace the carrier gas regulator. Ensure gas supply is sufficient. |
| Drift in Retention Factor (Chemical Issues) | ||
| Unstable incubation oven temperature [81] | Log the headspace sampler's oven temperature over time and compare to setpoint. | Calibrate the temperature sensor and controller. Ensure the vial carousel is not obstructing airflow. |
| Changing mobile phase composition (GC not applicable) | Not a root cause for GC, but critical for HPLC methods often used in parallel in QC labs. [80] [83] | For HPLC: Use tightly capped eluent reservoirs, avoid pre-mixed mobile phases, and use on-line degassers. |
| Column degradation [83] | Observe a steady shortening of tr over the column's lifetime, often accompanied by peak broadening. | Replace the analytical column. For prolonged life, use a guard column and avoid pH extremes and high temperatures beyond the column's specification. |
| Incomplete equilibrium in headspace vial [81] | Perform a time-study experiment: analyze replicates with increasing incubation times. Plot peak area vs. time; equilibrium is reached when the area becomes constant. | Extend the incubation time (typically 15-30 minutes). For automated systems, ensure vial shaking is enabled if available [79] [81]. |
The following workflow provides a systematic approach for diagnosing retention time drift:
Resolving Peak Overlap and Improving Resolution
Peak overlap, or insufficient resolution, occurs when two analytes have too similar retention under the given chromatographic conditions. The resolution (Rs) between two peaks is mathematically described by the equation [84]: Rs = [√N / 4] * [(α - 1) / α] * [k / (1 + k)]
Where:
- N is the column efficiency (plate number).
- α is the selectivity factor (ratio of capacity factors of the two peaks).
- k is the capacity factor (retention factor).
The most powerful approach to resolving severely overlapping peaks is to alter the selectivity (α), as it has the greatest multiplicative effect on resolution [84].
Table 2: Strategies for Resolving Peak Overlap in Headspace-GC
| Strategy & Principle | Experimental Parameters to Optimize | Detailed Protocol |
|---|---|---|
| Optimize Selectivity (α) | ||
| Temperature Program [84] [81] | Initial temperature, ramp rate, final temperature, and hold times. | Start with a moderate initial temperature, then apply a ramp (e.g., 5-15 °C/min). Use a higher final temperature and hold to elute strongly retained compounds. Perform iterative runs to find the optimal program that maximizes the valley between critical peak pairs. |
| Change Stationary Phase [84] | Column chemistry (e.g., polarity, functionality). | If a standard mid-polarity column (e.g., 35% phenyl) fails to separate critical pairs, switch to a column with different selectivity, such as a wax column for polar compounds or a more non-polar column for hydrocarbons. |
| Optimize Headspace Conditions [79] | Incubation temperature, sample volume, and use of salt. | Increase incubation temperature to drive more analyte into the headspace, which can affect relative concentrations. Adjust sample volume to change the phase ratio (β). Use salting-out (e.g., with NaCl) to improve volatility of polar analytes and potentially change elution order. |
| Maximize Efficiency (N) | ||
| Optimize Carrier Gas Flow [84] | Linear velocity of the carrier gas. | Generate a van Deemter plot by running a test mixture at different flow rates and measuring plate height. Set the method flow rate to the linear velocity that provides the highest efficiency (minimum plate height). |
| Column Dimensions [84] | Column length, internal diameter, and particle size of packing. | Use a longer column to increase N, but this increases analysis time and pressure. A column with a smaller internal diameter or a narrower bore increases efficiency. For GC, columns with smaller inner diameters (e.g., 0.18-0.25 mm) provide higher resolution than wider ones (e.g., 0.32 mm). |
The decision-making process for improving peak resolution can be visualized as follows:
Advanced Applications: Multiple Headspace Extraction (MHE)
For complex sample matrices where the sample itself can interfere with the partitioning of analytes (e.g., in polymeric drug delivery systems or viscous liquid formulations), standard headspace quantification can be inaccurate. Multiple Headspace Extraction (MHE) is a technique designed to overcome this [79].
MHE involves performing a series of consecutive headspace extractions from the same vial. After the first equilibrium and sampling, the vial is vented, and a new equilibrium is established. This process is repeated 3-5 times. The total area of the analyte is theoretically the sum of a geometric progression. By plotting the natural logarithm of the peak area versus the extraction number, the total area can be extrapolated from the linear regression. This method is particularly useful for solid samples or samples where the matrix has a high affinity for the analyte, making it difficult to create a matching calibration standard [79].
The Scientist's Toolkit: Essential Reagents and Materials
Table 3: Key Research Reagent Solutions for Automated Headspace-GC
| Item | Function & Application in Pharmaceutical HS-GC |
|---|---|
| Headspace Vials | Sealed containers for sample incubation. Use 10-mL or 20-mL vials certified for headspace to ensure consistent volume and sealing integrity. Larger vials allow for a larger sample volume, reducing the phase ratio (β) and increasing sensitivity [79]. |
| SeptaLaminated Caps | Provide a gas-tight seal. Critical for maintaining vial pressure and preventing loss of volatiles. Must be compatible with the high incubation temperatures and resistant to coring by the sampling needle [79] [81]. |
| Non-Volatile Salts (e.g., NaCl, Na₂SO₄) | Used for "salting-out." Adding salt to an aqueous sample decreases the solubility of volatile analytes, driving them into the headspace gas phase and significantly increasing method sensitivity [79] [81]. |
| Chemical Standards | High-purity reference materials for system qualification (e.g., for USP <467>) and calibration. Essential for confirming retention time stability and for quantitative methods [79]. |
| Headspace GC System | An automated system (e.g., Agilent 7697A/8697) with a temperature-controlled oven, a pressurized sampling needle, a sample loop, and a heated transfer line. Automation is key for reproducibility in a quality control setting [79]. |
| Guard Column | A short column segment packed with the same stationary phase as the analytical column, placed before it. Protects the expensive analytical column from non-volatile residue and matrix contaminants, extending its lifetime and preserving retention time stability [80]. |
Managing retention time drift and peak overlap is fundamental to developing robust and reliable automated headspace GC methods for pharmaceutical quality control. A systematic approach—combining a theoretical understanding of headspace principles with structured diagnostic workflows—enables scientists to efficiently identify root causes and implement effective solutions. By meticulously controlling instrument parameters, optimizing chromatographic conditions, and employing advanced techniques like MHE when necessary, researchers can ensure the generation of accurate, precise, and defensible data. This upholds the highest standards of product quality and safety, directly supporting the core objectives of pharmaceutical development and manufacturing.
System Suitability and Preventive Maintenance Best Practices
Automated headspace-gas chromatography (HS-GC) is a critical technique in pharmaceutical quality control for the precise analysis of volatile and semi-volatile organic compounds in drug substances and products [23]. Its applications range from residual solvent testing to the analysis of volatile impurities and degradation products. Ensuring data integrity and compliance with stringent regulatory standards (e.g., GMP, GLP) requires a robust framework for system suitability testing and preventive maintenance [85]. This document establishes detailed application notes and protocols for maintaining automated headspace sampling systems within a pharmaceutical research context, ensuring they consistently produce reliable, accurate, and reproducible results.
System Suitability Testing for Automated Headspace Systems
System Suitability Testing (SST) verifies that the entire analytical system—comprising the autosampler, chromatograph, and detector—is performing adequately for its intended use on a given day. SST should be performed at the start of each sequence and after any significant maintenance or configuration changes.
Key System Suitability Parameters
SST for automated headspace systems in pharmaceutical analysis should, at a minimum, evaluate the parameters summarized in the table below.
Table 1: Key System Suitability Parameters and Acceptance Criteria
| Parameter | Description | Typical Acceptance Criteria | Experimental Protocol |
|---|---|---|---|
| Precision (Repeatability) | Measure of the agreement between multiple injections of a standard preparation. | RSD ≤ 5.0% for peak areas and retention times of target analytes (n=5 or 6) [86]. | Prepare a system suitability standard containing all target analytes at a relevant concentration. Inject this standard 5-6 times sequentially using the automated sampler. Calculate the Relative Standard Deviation (RSD) for peak areas and retention times. |
| Linearity | Ability of the method to elicit test results that are directly proportional to analyte concentration. | Correlation coefficient (r) ≥ 0.995 over a specified range. | Prepare a calibration curve with at least 5 concentration levels across the defined range. Inject each level in duplicate. Plot peak area versus concentration and perform linear regression analysis. |
| Sensitivity (Detection & Quantitation Limits) | Confirms the system can detect and quantify analytes at the required levels. | Signal-to-Noise Ratio: S/N ≥ 10 for LOQ; S/N ≥ 3 for LOD. | Inject a diluted standard near the expected limit. Measure the signal-to-noise ratio directly from the chromatographic data system. |
| Carryover | Measure of analyte transfer from a high-concentration sample to a subsequent blank. | Peak area in blank ≤ 20% of the LOQ peak area. | Inject a high-concentration standard followed by a blank solvent sample. Analyze the blank for the presence of any target analyte peaks. |
| Theoretical Plates | Indicator of chromatographic column efficiency. | As per validated method specifications; typically, > 2000 plates per meter for a well-performing column. | Inject a non-retained compound and a retained, well-behaved analyte from the suitability standard. Use the chromatographic data system to calculate the number of theoretical plates. |
| Tailing Factor | Measure of peak symmetry. | Tailing Factor ≤ 2.0 for the analyte peak. | The system calculates this from the chromatogram of the suitability standard. |
System Suitability Test Solution Preparation
A typical system suitability test solution for residual solvent analysis might include a mixture of Class 1, 2, or 3 solvents (as per ICH guidelines) at concentrations representing 100% of the specification limit. The solution should be prepared in an appropriate matrix, such as dimethylformamide (DMF) or water.
Preventive Maintenance Protocols
A proactive preventive maintenance (PM) schedule is essential to minimize instrument downtime and ensure data quality. The following protocols outline key maintenance tasks.
Daily Maintenance
- Visual Inspection: Check for any visible leaks, damaged syringes, or loose fittings in the headspace sampler.
- GC System Check: Monitor system pressures and baseline stability.
- Solvent and Gas Supply: Verify adequate levels of carrier gas, liquid nitrogen (if used for cryofocusing), and other consumables.
Weekly Maintenance
- Syringe Cleaning: Manually remove the syringe and flush it extensively with a suitable solvent (e.g., methanol, acetone), followed by air drying.
- Needle Wipe Inspection: Check the condition of the needle wipe and replace it if soiled or damaged to prevent cross-contamination.
- Septum Replacement: Replace the septum on the GC inlet if necessary.
Monthly Maintenance
- Needle and Transfer Line Cleaning: Soak the needle and, if accessible, the transfer line in an appropriate solvent.
- O-ring and Seal Replacement: Replace O-rings on vial caps and within the sampler turret to maintain a gas-tight seal.
- Performance Verification: Run a system suitability test and compare results to historical data to detect performance drift.
Quarterly Maintenance
- Inlet Liner Replacement: Replace the GC inlet liner and clean the inlet.
- Column Maintenance: Trim the analytical column inlet by 10-20 cm or replace it if performance degrades.
- Full Autosampler Calibration: Verify and calibrate the autosampler's temperature, pressure, and injection volume accuracy as per the manufacturer's specifications.
The Scientist's Toolkit: Essential Research Reagent Solutions
The following table details key materials and reagents essential for experiments utilizing automated headspace sampling in pharmaceutical quality control.
Table 2: Essential Materials and Reagents for Automated Headspace Sampling
| Item | Function/Application |
|---|---|
| Certified Reference Standards | High-purity compounds used for qualitative and quantitative calibration. Essential for preparing system suitability tests and calibration curves. |
| Appropriate Solvent (Matrix) | A solvent, such as DMF, water, or a surrogate matrix, in which the sample and standards are dissolved. It must have minimal volatile interference. |
| Internal Standard Solution | A compound added in a constant amount to all samples, blanks, and calibration standards. It is used to correct for injection volume variability and sample matrix effects. |
| Headspace Vials | Specially designed glass vials of precise volume (e.g., 10 mL, 20 mL) capable of withstanding pressure and ensuring a gas-tight seal. |
| Crimp Caps with Septa | Aluminum caps with PTFE/silicone septa used to hermetically seal headspace vials, preventing loss of volatiles and contamination. |
| Syringe Wash Solvents | High-purity solvents (e.g., methanol, acetonitrile) used by the autosampler to rinse the syringe needle externally and internally between injections to prevent carryover. |
| System Suitability Test Mix | A ready-to-use or custom-prepared mixture of target analytes at defined concentrations for verifying system performance prior to sample analysis. |
Method Validation, Compliance, and Emerging Technologies
This application note provides a detailed framework for the validation of static headspace gas chromatography (HS-GC) methods in accordance with ICH Q2(R1) guidelines. Within the broader context of automated headspace sampling for pharmaceutical quality control, we present specific experimental protocols and acceptance criteria for determining residual solvents and volatile impurities. The methodologies outlined herein are designed to ensure regulatory compliance, robustness, and reliability for drug development professionals.
Static headspace gas chromatography is a mainstay technique for analyzing volatile organic compounds (VOCs) in pharmaceutical materials because it allows for the direct analysis of volatiles without interference from the non-volatile sample matrix [87] [88]. This is particularly critical for adhering to regulatory monographs such as USP 〈467〉 for residual solvents [12] [8]. The ICH Q2(R1) guideline provides the formal foundation for demonstrating that an analytical procedure is suitable for its intended use [89] [90]. This document translates these principles into actionable validation protocols for headspace methods, encompassing parameters such as specificity, accuracy, precision, linearity, range, and limits of detection and quantitation.
Core Validation Parameters & Experimental Protocols
The following section details the validation characteristics as per ICH Q2(R1), with tailored experimental approaches for headspace methods. The quantitative data is derived from validated methods for analyzing residual solvents and specific impurities like formaldehyde [87] [8].
Table 1: Summary of Core Validation Parameters and Acceptance Criteria
| Validation Parameter | Experimental Approach | Acceptance Criteria | Exemplary Data from Literature |
|---|---|---|---|
| Specificity | Analyze blank matrix and spiked sample; resolve all peaks of interest. | No interference from blank at the retention time of the analyte [90]. | Baseline resolution (Rs ≥ 2) for 27 residual solvents [8]. |
| Accuracy/Recovery | Spike analyte into placebo at multiple levels (e.g., 50%, 100%, 150% of target). | Mean recovery of 95–105% [90]. | Formaldehyde in excipients: Recovery within 95–105% [87]. |
| Precision | 1. Repeatability: Six replicates at 100% level.2. Intermediate Precision: Duplicate by different analyst/instrument/day. | RSD ≤ 3% for assay [90]. | Benzyl chloride method: RSD < 5% [90]. Platform solvent method: RSD < 5% for all solvents [8]. |
| Linearity | Analyze a minimum of 5 concentrations. | Correlation coefficient (R) > 0.998 [90]. | Formaldehyde: R = 0.9998 [87]. Benzyl chloride: R > 0.9998 [90]. |
| Range | Established from linearity data. | From LOQ to 150-200% of target concentration. | LOQ to 200% for 27 solvents [8]. |
| LOD/LOQ | Signal-to-noise ratio of 3:1 for LOD and 10:1 for LOQ. | LOD/LOQ should meet sensitivity needs. | Formaldehyde: LOD 2.44 µg/g, LOQ 8.12 µg/g [87]. Benzyl chloride: LOQ 0.1 µg/g [90]. |
| Robustness | Deliberate variations in parameters (e.g., oven temp ±1°C, flow rate ±0.1 mL/min). | Method performance remains within acceptance criteria. | Platform method robust to small changes in carrier gas flow and oven temperature [8]. |
Detailed Experimental Protocol: Accuracy & Precision
This protocol is adapted from a validated method for determining formaldehyde in pharmaceutical excipients using HS-GC-FID [87].
- Materials: Placebo formulation, analyte reference standard, derivatization reagent (e.g., 1% p-toluenesulfonic acid in ethanol for formaldehyde).
- Standard Preparation: Prepare a stock standard solution of the analyte and serially dilute to create a series of standard solutions. Transfer 5 mL of each to a headspace vial [87].
- Sample Preparation (Spiked Placebo):
- Weigh 250 mg of placebo matrix into a 20-mL amber headspace vial.
- Spike with analyte stock solution to achieve concentrations at 50%, 100%, and 150% of the target level.
- Add 5 mL of an appropriate solvent or derivatization solution (e.g., acidified ethanol).
- Immediately seal the vial with a magnetic screw cap lined with a PTFE/silicone septum and shake until the contents are completely dissolved or homogenous [87].
- Headspace GC Conditions:
- Incubation: 70°C for 15-25 min (matrix-dependent), with agitation at 500 rpm.
- Syringe: 75°C, injection volume 800 µL.
- GC Inlet: 170°C, split ratio 1:25.
- Column: ZB-WAX (30 m × 0.25 mm i.d., 0.25 µm film thickness) or equivalent.
- Oven Program: 35°C (hold 5 min), ramp at 40°C/min to 220°C (hold 1 min).
- Carrier Gas: Helium, constant flow 0.9 mL/min.
- Detection: FID at 280°C [87].
- Calculation: Plot a calibration curve from the standard injections. Calculate the concentration of the analyte in each spiked sample and determine the mean recovery (%) and relative standard deviation (RSD%).
The Scientist's Toolkit: Essential Materials for Headspace Analysis
Table 2: Key Research Reagent Solutions and Materials
| Item | Function / Rationale | Exemplary Specification / Composition |
|---|---|---|
| Headspace Vials | To contain the sample and maintain a sealed, pressurized environment for volatile partitioning. | 20-mL amber glass vials with crimp caps lined with PTFE/silicone septa [87] [90]. |
| Derivatization Reagent | To convert a low-volatility or poorly detectable analyte into a volatile, detectable derivative. | 1% (w/w) p-toluenesulfonic acid in absolute ethanol for converting formaldehyde to diethoxymethane [87]. |
| Custom Stock Standard | A premixed solution of multiple residual solvents to streamline standard preparation and improve reproducibility. | Commercially prepared stock standard containing 27 common Class 2 and 3 solvents at specified concentrations [8]. |
| Internal Standard | To correct for sample-to-sample variability in headspace generation and injection. | Benzyl chloride-d7 for the analysis of benzyl chloride [90]. |
| Headspace Diluent | The solvent used to dissolve the sample matrix. Must be carefully selected to minimize the partition coefficient (K). | N-Methyl-2-pyrrolidone (NMP), headspace grade [8]. |
Workflow and Relationship Diagrams
ICH Q2(R1) Validation Workflow
Static Headspace GC Process
In the field of pharmaceutical quality control, the demonstration of analytical method validity is a fundamental requirement for regulatory compliance and patient safety. This is particularly critical for automated headspace sampling techniques, such as Headspace Gas Chromatography (HS-GC), which are extensively employed for the analysis of volatile impurities like residual solvents and leachables in drug substances and products [12]. The Figures of Merit—Limit of Detection (LOD), Limit of Quantitation (LOQ), Precision, and Accuracy—form the cornerstone of this validation, providing objective evidence that an analytical method is suitable for its intended purpose [91]. Within the framework of a broader thesis on automated headspace sampling, this application note details the experimental protocols and acceptance criteria for establishing these key parameters, ensuring reliable and defensible data in pharmaceutical research and development.
The Scientist's Toolkit: Essential Research Reagents and Materials
The following table catalogues the essential materials and reagents commonly required for developing and validating automated headspace-GC methods for residual solvent analysis in pharmaceuticals.
Table 1: Key Research Reagent Solutions for Automated Headspace-GC Analysis
| Item | Function & Importance |
|---|---|
| High-Purity Residual Solvent Standards (e.g., Methanol, Acetone, Dichloromethane, Ethyl Alcohol) | Used to prepare calibration standards and Quality Control (QC) samples. High purity is critical for accurate quantification and avoiding contamination [92] [4]. |
| Appropriate Sample Diluent (e.g., Dimethylsulfoxide (DMSO), Water) | Dissolves the sample matrix without interfering with the analysis. Selection depends on the drug substance's solubility and the solvents being analyzed; DMSO is often preferred for its high boiling point and low volatility [4]. |
| Internal Standard (IS) (e.g., tert-Butanol) | Added in a constant amount to all samples, calibrators, and QCs. The IS corrects for variability in sample preparation and instrument response, improving precision and accuracy [92]. |
| Matrix Modifiers (e.g., Sodium Fluoride, Thiourea) | Added to the sample to stabilize volatile analytes, such as by inhibiting the enzymatic degradation of acetaldehyde in blood plasma [92]. |
| Certified Headspace Vials and Seals | Provide an inert, sealed environment for sample equilibration. Critical for maintaining sample integrity, preventing loss of volatiles, and ensuring reproducible vial pressure [12]. |
| Certified Reference Materials & Placebos | Drug substance or product samples known to be free of the target analytes. Used to demonstrate the selectivity of the method and to prepare spiked samples for accuracy and recovery studies [4]. |
Establishing the Figures of Merit: Protocols and Acceptance Criteria
Limit of Detection (LOD) and Limit of Quantitation (LOQ)
Objective: To establish the lowest levels at which an analyte can be reliably detected (LOD) and quantified (LOQ) by the method [91].
Experimental Protocol:
- Sample Preparation: Prepare a series of samples (e.g., drug substance spiked in diluent or placebo) with decreasing concentrations of the target analyte(s).
- Analysis: Analyze each sample in replicate (typically n=3-5) using the validated headspace-GC method.
- Signal-to-Noise (S/N) Calculation: The S/N ratio is calculated by the instrument software by comparing the measured signal from the analyte to the background noise level.
- LOD Determination: The LOD is defined as the lowest concentration at which the analyte can be reliably detected, typically with a Signal-to-Noise ratio of 3:1 [91].
- LOQ Determination: The LOQ is defined as the lowest concentration that can be quantitatively determined with suitable precision and accuracy, typically with a Signal-to-Noise ratio of 10:1 [91] [4]. At the LOQ, the method should demonstrate an accuracy of 80-120% and a precision (RSD) of ≤20% [92].
Application Example: In a study developing an HS-GC-MS/MS method for ethyl alcohol and acetaldehyde in human plasma, the LLOQ (Lower LOQ) was established at 20 µg/mL and 0.2 µg/mL, respectively. These levels were confirmed to have a precision and accuracy within ±20%, proving the method's suitability for trace analysis [92].
Precision
Objective: To demonstrate the degree of scatter or agreement between a series of measurements obtained from multiple sampling of the same homogeneous sample under the prescribed conditions.
Experimental Protocol: Precision is evaluated at three levels:
- Repeatability (Intra-day Precision):
- Prepare six independent samples at the same concentration (e.g., 100% of the test concentration).
- Analyze all six samples in a single sequence by the same analyst, using the same instrument, on the same day.
- Calculate the % Relative Standard Deviation (%RSD) of the measured concentrations.
- Intermediate Precision (Inter-day Precision & Ruggedness):
- To assess inter-day precision, repeat the repeatability experiment on a different day (at least two days in total).
- To incorporate inter-analyst and inter-instrument variability, have a second analyst perform the analysis on a different instrument on the second day.
- The combined data from all analyses is used to calculate the overall %RSD.
- Reproducibility: This is typically assessed through inter-laboratory studies, which may be beyond the scope of a single thesis project.
Acceptance Criteria:
- For drug assay and impurity tests, the RSD for repeatability should typically be ≤ 5.0% for the drug substance and ≤ 10.0% for impurities [4]. For bioanalytical methods, as in the plasma alcohol study, criteria may be relaxed to ±15% (20% at LLOQ) [92].
Accuracy
Objective: To establish the closeness of agreement between the value found by the method and the value accepted as either a conventional true value or an accepted reference value. It is typically demonstrated through a recovery experiment [4].
Experimental Protocol:
- Sample Preparation: Prepare a placebo sample or a known drug substance batch. Spike this matrix with known quantities of the target analyte(s) at a minimum of three concentration levels (e.g., low, medium, and high, corresponding to 50%, 100%, and 150% of the specification limit or expected concentration), each in triplicate.
- Analysis: Analyze the spiked samples using the validated method.
- Calculation: For each spiked sample, calculate the percentage recovery using the formula:
- Recovery (%) = (Measured Concentration / Spiked Concentration) × 100
Acceptance Criteria:
- The mean recovery at each concentration level should be within 90.0% - 110.0% for drug substance assays [4]. For trace-level impurities, a wider range such as 80-120% is often applied, especially at the LOQ [92].
Table 2: Summary of Figures of Merit, Protocols, and Acceptance Criteria
| Figure of Merit | Experimental Protocol Summary | Typical Acceptance Criteria |
|---|---|---|
| Limit of Detection (LOD) | Analysis of samples with decreasing analyte concentration. | Signal-to-Noise Ratio ≥ 3:1 [91]. |
| Limit of Quantitation (LOQ) | Analysis of samples with decreasing analyte concentration, with precision and accuracy assessment at the proposed LOQ. | Signal-to-Noise Ratio ≥ 10:1 [91] [4]. Precision (RSD) ≤ 20% and Accuracy within 80-120% [92]. |
| Precision (Repeatability) | Analysis of six independent samples at 100% concentration in one sequence. | RSD ≤ 5.0% for assay, RSD ≤ 10.0% for impurities [4]. |
| Accuracy | Recovery study using spiked placebo at 3 concentration levels (e.g., 50%, 100%, 150%) in triplicate. | Mean Recovery per level: 90.0% - 110.0% [4]. |
Integrated Workflow for Method Validation
The process of establishing figures of merit follows a logical, sequential workflow to ensure each parameter is properly defined before proceeding to the next.
The rigorous establishment of LOD, LOQ, precision, and accuracy is non-negotiable for implementing any automated headspace-GC method within a pharmaceutical quality control environment. The protocols outlined herein, aligned with principles of Analytical Quality by Design (AQbD) and regulatory guidelines such as ICH Q2(R1) and USP <467>, provide a clear roadmap for researchers and scientists [49] [12]. By systematically demonstrating these Figures of Merit, one ensures that the analytical method is capable of producing reliable, high-quality data that safeguards product quality, ensures patient safety, and meets the stringent demands of global regulatory bodies.
Static Headspace Analysis is a widely established technique for sampling the gas phase of a sample for both qualitative and quantitative analysis by gas chromatography (GC). Its popularity stems from its versatility in analyzing volatile organic compounds (VOCs) in complex matrices, which eliminates tedious sample preparation steps and prevents common contamination issues [3]. In the pharmaceutical industry, ensuring product quality and safety is paramount, and the analysis of volatile impurities, such as residual solvents, is a critical component of quality control. This application note provides a comparative analysis of three analytical techniques—HS-GC, HS-GC/MS, and the direct mass spectrometry technique SIFT-MS—within the context of pharmaceutical quality control research. The focus is on their operational principles, performance metrics, and applicability to regulated methods like USP <467> [3].
HS-GC and HS-GC/MS
Static Headspace Gas Chromatography (HS-GC) and Headspace Gas Chromatography-Mass Spectrometry (HS-GC/MS) are two of the most prevalent techniques for VOC analysis. The fundamental process involves incubating a sample in a sealed vial, allowing volatile compounds to partition between the sample matrix and the headspace gas above it until equilibrium is established [93]. The headspace vapor is then introduced into the GC system. In HS-GC, a non-selective detector (such as an FID) is used, whereas HS-GC/MS employs a mass spectrometer as the detector, providing compound identification capabilities through spectral matching [94].
Modern automated headspace samplers, such as the SCION Instruments Versa, perform three fundamental steps for sample injection [95]:
- Equilibration: The sealed vial is heated in a temperature-controlled oven to accelerate the partitioning of volatiles into the headspace.
- Pressurization: The vial is pressurized with an inert carrier gas to a predetermined pressure.
- Sample Transfer: The pressurized headspace is transferred into the GC inlet, either directly ("balanced pressure" system) or via a fixed-volume sample loop ("valve-and-loop" system) [95] [93].
Selected Ion Flow Tube-Mass Spectrometry (SIFT-MS)
SIFT-MS is a direct-injection mass spectrometric technique that eliminates the chromatographic separation step, enabling real-time, quantitative analysis of VOCs [96] [97]. It utilizes soft chemical ionization with multiple precursor ions (typically H₃O⁺, NO⁺, and O₂⁺) which are selected one at a time by a mass filter [97]. These reagent ions react with VOC molecules in a flow tube, and the product ions are analyzed by a second mass filter. The use of multiple reagent ions and known reaction kinetics allows SIFT-MS to discriminate between isobaric compounds and many isomers, and provides absolute quantification without the need for calibration curves for many compounds [97].
Table 1: Comparative Technical Overview of HS-GC, HS-GC/MS, and SIFT-MS
| Feature | HS-GC | HS-GC/MS | SIFT-MS |
|---|---|---|---|
| Core Principle | Headspace sampling with GC separation | Headspace sampling with GC separation and MS identification | Direct MS analysis using gas-phase ion chemistry |
| Detection Method | Flame Ionization Detector (FID) or similar | Mass Spectrometer (MS) | Mass Spectrometer (MS) |
| Analysis Speed | Minutes to tens of minutes | Minutes to tens of minutes | Seconds (real-time) [97] |
| Sample Throughput | Moderate | Moderate | High (e.g., 70 samples in 6 hours vs. 24 hours for GC/MS) [96] |
| Selectivity | Based on retention time | High; based on retention time and mass spectrum | High; based on multiple reagent ion chemistry [97] |
| Sensitivity | Good | Excellent (ppt range) [94] | Excellent (ppt range) [97] |
| Isomer Differentiation | Yes (chromatographic resolution) | Yes (chromatographic resolution) | Limited to many, but not all [97] |
| Quantification | Relative, requires calibration | Relative, requires calibration | Absolute, possible without calibration [97] |
Experimental Protocols
Detailed Protocol: Residual Solvent Analysis per USP <467> using HS-GC/MS
This protocol is adapted for use with an automated headspace sampler, such as the SCION Instruments Versa, coupled to a GC/MS system [3].
3.1.1 Research Reagent Solutions and Materials
Table 2: Key Research Reagent Solutions and Materials for HS-GC/MS
| Item | Function | Example/Specification |
|---|---|---|
| Headspace Vials | Sample container capable of being sealed | 20-mL or 22-mL vials [3] [93] |
| Septa & Caps | Ensures a hermetic seal to prevent volatile loss | PTFE/silicone septa, crimp or screw caps [95] |
| Internal Standards | Corrects for analytical variability in sample preparation and injection | e.g., Heptadecanoic acid, Norleucine [94] or other suitable volatiles |
| Derivatization Reagent | Protects and volatilizes certain functional groups (e.g., for metabolomics) | MSTFA with 1% TMCS [94] |
| Methoxyamine Solution | Protects carbonyl groups during derivatization (e.g., for metabolomics) | 20 mg/mL in pyridine [94] |
| Saline Solution | Aqueous matrix for preparing calibration standards | 0.1 M Sodium Chloride [96] |
| Certified Reference Standards | For accurate calibration and quantification | Certified residual solvent mixtures (Class 1, 2A, 2B, 3) |
3.1.2 Sample Preparation
- Standard Preparation: Prepare a series of calibration standards by spiking appropriate volumes of residual solvent stock solutions into a mixture of drug product placebo and/or 0.1 M saline solution [96].
- Sample Preparation: Precisely weigh the pharmaceutical test sample (e.g., bulk drug substance or finished product) into a headspace vial. Add a suitable solvent (e.g., water, DMF) containing the internal standard, if used. Immediately seal the vial tightly with a septum and cap to prevent loss of volatiles [3].
3.1.3 Instrumental Analysis
- HS Sampler Conditions:
- Equilibration Temperature: Optimized, typically 80-120°C [95]
- Equilibration Time: 20-60 minutes (ensure equilibrium is reached) [93]
- Needle Temperature: >Sample heating to 200°C to prevent condensation [3]
- Transfer Line Temperature: >150°C [93]
- Pressurization Gas & Pressure: High-purity helium or nitrogen, pressure optimized [95]
- Injection Volume: Controlled via sample loop (e.g., 1 mL) or injection time [93]
- GC Conditions:
- Column: Mid-polarity stationary phase (e.g., (5%-phenyl)-methylpolysiloxane, 60 m x 0.25 mm i.d. x 0.25 µm film) [94]
- Carrier Gas: Helium, constant flow (e.g., 1.0 mL/min) [94]
- Oven Program: Initial 40-60°C, ramp to 200-250°C at 5-15°C/min [3]
- Inlet: Split or splitless mode, temperature 150-250°C [94]
- MS Conditions:
3.1.4 Data Analysis
- Generate a calibration curve by plotting the relative response (analyte peak area / internal standard area) against the concentration of each residual solvent.
- Identify solvents in the sample by matching their retention times and mass spectra with those of the standards.
- Quantify the concentration of each residual solvent in the test sample using the established calibration curve.
Workflow Diagram: HS-GC/MS vs. SIFT-MS
The following diagram illustrates the core procedural differences between the HS-GC/MS and SIFT-MS workflows, highlighting the simplified sample pathway of the direct MS technique.
Performance Data and Application Notes
Quantitative Performance Comparison
A direct comparison of SIFT-MS and HS-GC/MS for the analysis of cyclohexanone and cyclohexanol in porcine plasma demonstrated the strengths of both techniques [96].
Table 3: Quantitative Performance Comparison for Plasma Analysis [96]
| Parameter | HS-GC/MS | SIFT-MS |
|---|---|---|
| Calibration Linearität (r²) | Cyclohexanone: 0.9998, Cyclohexanol: 0.9999 | Cyclohexanone: 0.9999, Cyclohexanol: 0.9999 |
| Analysis Time for 70 Samples | ~24 hours | ~6 hours |
| Relative Throughput | 1x | 4x |
| Carryover | Observed after high concentration samples | Half as significant as GC/MS |
| Key Advantage | High chromatographic selectivity; gold standard | Speed and high throughput; real-time data |
Application Note 1: High-Throughput Residual Solvent Screening
Challenge: A quality control laboratory needs to screen a large number of incoming raw material samples for a wide range of potential residual solvents quickly.
Solution: Implement SIFT-MS for initial high-throughput screening. The direct analysis capability of SIFT-MS allows for a cycle time of seconds per sample, dramatically increasing throughput [96] [97]. Its ability to quantify absolutely using multiple reagent ions provides high confidence in results. Samples flagged as potentially non-compliant can be routed for confirmatory analysis using the official, validated HS-GC/MS method.
Benefit: Significant reduction in analysis backlog and faster release of raw materials, while maintaining data integrity and compliance.
Application Note 2: Stability Testing and Degradation Product Monitoring
Challenge: Monitoring the formation of volatile degradation products (e.g., formaldehyde, formic acid) in an oxygen-sensitive drug product during stability studies [98].
Solution: Utilize HS-GC/MS for its superior separation power and identification capabilities. The chromatographic step is crucial for separating complex mixtures of degradation products and confidently identifying them via mass spectral libraries. The automated headspace sampler prevents further degradation by providing an inert pathway and controlled heating [3] [95].
Benefit: Provides definitive identification and quantification of trace-level volatile degradation products, supporting root-cause analysis and shelf-life determination.
Application Note 3: Container Closure Integrity Testing (CCIT)
Challenge: Non-destructively verifying the integrity of parenteral packaging to ensure sterility and product stability.
Solution: Employ laser-based headspace analysis, as offered by LIGHTHOUSE instruments, to measure headspace oxygen and moisture levels [99]. This technique is complementary to chromatographic methods and is specifically designed for rapid, non-destructive measurement of headspace gases directly through the container closure, making it ideal for 100% inspection.
Benefit: High-speed, non-destructive testing that can be implemented in-line for manufacturing quality control, ensuring package integrity and patient safety.
The choice between HS-GC, HS-GC/MS, and SIFT-MS for pharmaceutical quality control is application-dependent. HS-GC/MS remains the gold standard for definitive identification and quantification of volatile impurities, particularly when following compendial methods like USP <467>, due to its powerful combination of chromatographic separation and mass spectrometric detection [3] [94]. SIFT-MS offers a compelling advantage for high-throughput screening and method development due to its speed and simplicity, providing a fourfold increase in sample throughput as demonstrated in comparative studies [96]. HS-GC remains a robust and cost-effective workhorse for targeted analyses where mass spectral identification is not required. A strategic approach involves leveraging the strengths of each technique—using SIFT-MS for rapid screening and HS-GC/MS for definitive, regulatory-compliant analysis—to optimize efficiency and ensure the highest standards of pharmaceutical product quality and safety.
Leveraging Automation for High-Throughput Analysis and Data Integrity
Automated headspace gas chromatography (HS-GC) is a premier technique for the qualitative and quantitative analysis of volatile organic compounds (VOCs) in pharmaceutical products. This technique provides significant advantages for quality control (QC) laboratories, including minimal sample preparation, high reproducibility, and protection of the GC system from non-volatile sample components that could cause degradation or damage [100]. The analysis of residual solvents, a critical requirement for drug safety, is a primary application governed by standards such as the United States Pharmacopeia (USP) Method <467> [3] [100]. The integration of full automation in headspace sampling is transformative, enabling high-throughput analysis while simultaneously enhancing data integrity—a non-negotiable requirement in regulated pharmaceutical environments.
Automation mitigates key sources of error associated with manual sample handling, such as transcription mistakes, inconsistent vial capping, and variable sample incubation [101]. Modern automated headspace systems, such as the SCION Instruments Versa, are engineered with features that support data integrity principles. These include built-in pressure control for consistent injection volumes, automatic leak checks for system suitability, and software that provides comprehensive audit trails [3]. By creating a seamless, digitized workflow from sample preparation to data reporting, automated headspace systems form a cornerstone of the modern, compliant analytical laboratory.
Key Applications and Quantitative Performance
Automated headspace analysis is routinely applied to several critical areas within pharmaceutical quality control and drug development. The following table summarizes the primary applications and the quantitative performance achievable with modern automated systems.
Table 1: Key Applications of Automated Headspace Analysis in Pharmaceuticals
| Application Area | Analytes of Interest | Typical Matrix | Reported Performance (Precision RSD) | Governing Standards |
|---|---|---|---|---|
| Residual Solvent Analysis | Class 1, 2, and 3 solvents (e.g., Benzene, Toluene) | Bulk APIs, Finished Drug Products | < 2.5% RSD [11] | USP <467> [3] [100] |
| Leachables & Extractables | Plasticizers, Degradation products (e.g., Formaldehyde) | Polymer Packaging, Excipients (e.g., Gelucire) | Calibration stable for ≥4 weeks [11] | USP <1664> |
| Nitrosamine Impurities | N-Nitrosodimethylamine (NDMA) | Ranitidine API, Drug Products | LOQ in low nanogram range [11] | FDA Guidelines |
| Drug Product Testing | Volatile impurities, Residual monomers | Tablets, Capsules, Liquids | High repeatability for direct analysis of powders [11] | ICH Q3C, Q3D |
The data in Table 1 demonstrates that automated HS-GC methods are capable of achieving a high degree of precision and sensitivity. For instance, a study on the determination of formaldehyde in a gelucire excipient demonstrated that the Multiple Headspace Extraction (MHE) calibration remained stable for a period of four weeks, enabling quantitative analysis from a single headspace injection during that time [11]. This significantly enhances throughput for routine analysis. Furthermore, methods for analyzing NDMA in powdered ranitidine tablets achieved limits of quantitation (LOQ) in the low nanogram per gram range, allowing for direct analysis of powdered tablets without dissolution at a throughput of approximately 12 samples per hour [11].
Detailed Experimental Protocols
Protocol 1: Residual Solvent Analysis per USP <467>
This protocol outlines the procedure for the identification and quantification of residual solvents in a pharmaceutical drug substance using an automated headspace sampler coupled to a gas chromatograph with a flame ionization detector (GC-FID).
3.1.1 Research Reagent Solutions & Materials
Table 2: Essential Materials and Reagents for USP <467> Analysis
| Item | Function/Description | Critical Quality Attribute |
|---|---|---|
| 22 mL Headspace Vials | Container for sample/standard incubation | Certified clear glass, pressure-resistant; must seal properly with crimp caps. |
| Crimp Caps with PTFE/Silicone Septa | Ensures a hermetic seal for the headspace vial. | Pre-slit PTFE/silicone septa recommended for automated sampler needle integrity. |
| Dimethyl sulfoxide (DMSO) or Water | Sample diluent, chosen for its ability to dissolve the analyte and matrix. | Appropriate GC grade, low in volatile impurities. |
| USP <467> Class 1 & 2 Residual Solvent Mixtures | Certified reference standards for calibration and identification. | Traceable to a national standard, with documented purity and concentration. |
| Internal Standard (e.g., n-Propanol) | Added to all standards and samples to correct for injection volume variability and matrix effects. | Must be well-resolved from all analytes and not present in the sample. |
3.1.2 Methodology
- Sample Preparation: Accurately weigh approximately 250 mg of the drug substance into a 22 mL headspace vial. Add 5.0 mL of suitable diluent (e.g., DMSO) and immediately cap the vial securely.
- Standard Preparation: Prepare a series of standard solutions containing the target residual solvents at concentrations spanning the required range (e.g., from the limit of quantitation to 150% of the specification limit). Include the internal standard at a fixed concentration in all standard and sample vials.
- Instrumental Conditions:
- Headspace Sampler: Equilibration temperature: 80-120°C (optimize based on analytes); Equilibration time: 30-60 minutes; Needle temperature: 5-10°C above oven temperature; Transfer line temperature: 5-10°C above oven temperature; Pressurization time: 1-2 minutes; Injection volume: 1 mL.
- GC Conditions: Column: 6%-cyanopropylphenyl-94%-dimethylpolysiloxane capillary column (e.g., 30 m x 0.32 mm ID, 1.8 µm film thickness). Carrier Gas: Helium or Nitrogen, constant flow (e.g., 2.0 mL/min). Oven Program: Initial temperature 40°C (hold 5 min), ramp to 240°C at 15-20°C/min. FID Temperature: 260°C.
- Data Analysis: Use the internal standard method for quantification. Plot the ratio of the analyte peak area to the internal standard peak area versus the analyte concentration to generate a calibration curve. The concentration of residual solvents in the unknown sample is calculated from this curve.
Protocol 2: Multiple Headspace Extraction (MHE) for Complex Matrices
MHE is a quantitative technique used for samples where preparing matrix-matched calibration standards is difficult or impossible, such as polymers, gels, or solid dosage forms.
3.2.1 Methodology
- Sample Preparation: Weigh a representative sample (e.g., 100 mg of a polymer or powdered tablet) directly into a 20 mL headspace vial. The sample mass should be small enough to allow for near-complete extraction of the analyte through multiple cycles. Seal the vial.
- MHE Analysis: Place the single sample vial in the autosampler. The automated sequence will perform a series of headspace extractions (typically 3-6) from the same vial.
- Each cycle consists of: (a) equilibration at a set temperature, (b) pressurization, (c) injection of a headspace aliquot into the GC, and (d) a high-flow purge of the vial headspace to remove the remaining volatiles.
- Data Analysis: The peak area of the analyte decreases exponentially with each successive extraction. Plot the natural logarithm of the peak area (ln A) versus the extraction number (n). The total area (A~total~) is calculated by extrapolating this linear plot back to n=0 and integrating the exponential decay curve. This total area is proportional to the absolute amount of the analyte in the sample and can be compared directly to the total area from a standard prepared in a simple matrix (e.g., water or solvent) to determine the concentration in the complex sample [11].
Ensuring Data Integrity in Automated Workflows
The transition to automated analysis necessitates a strategic approach to data integrity. A phased, 5-year roadmap is recommended for comprehensive lab digitalization, integrating technology, process, and personnel [101].
Phase 1 (Years 1-2): Foundational Data Architecture. The initial focus must be on establishing a secure, standardized data foundation. This involves implementing an Electronic Lab Notebook (ELN) and a Scientific Data Management System (SDMS). The SDMS automatically ingests, indexes, and secures raw data files directly from the analytical instrumentation, eliminating manual data transcription errors and creating a single source of truth [101]. This aligns with the ALCOA+ principles (Attributable, Legible, Contemporaneous, Original, and Accurate) required for regulatory compliance.
Phase 2 (Years 2-3): Workflow Harmonization and Automation. With the data foundation in place, the focus shifts to optimizing processes by integrating the data foundation with operational management tools. Implementing a Laboratory Information Management System (LIMS) is central to this phase. A LIMS provides centralized management for samples, testing schedules, and results reporting. Integration of the LIMS with the ELN/SDMS creates seamless, end-to-end digital workflows, from sample receipt to the final certificate of analysis (CoA) [101].
Phase 3 (Years 3-4): Intelligent Automation and Systems Interoperability. This phase leverages the digital foundation to maximize throughput and efficiency. Deploying a technology-agnostic middleware layer is vital for achieving true systems interoperability. This middleware acts as a central hub, normalizing communication protocols between diverse instruments (like the automated headspace sampler and GC/MS) and enterprise systems, enabling bidirectional real-time communication [101].
Phase 4 (Years 4-5): Advanced Analytics and Predictive QC. The final phase capitalizes on the accumulated high-quality data. Machine Learning (ML) algorithms can be deployed for Predictive Quality Control, analyzing real-time instrument data and historical parameters to predict out-of-specification (OOS) results before an analytical run is complete, allowing for proactive intervention [101].
The Scientist's Toolkit: Key Research Reagent Solutions
Table 3: Essential Reagents and Materials for Automated Headspace Analysis
| Item | Function | Application Notes |
|---|---|---|
| Certified HS Vials & Seals | Provides an inert, pressurized vessel for sample equilibration. | Use certified vials to ensure consistent dimensions and glass quality. Crimp caps with PTFE/silicone septa are standard for automation. |
| High-Purity Internal Standards | Corrects for analytical variability; essential for robust quantification. | n-Propanol is commonly used for ethanol analysis [102]. Must be absent from samples and not co-elute with any analyte. |
| Traceable Reference Standards | Provides the basis for accurate identification and quantification. | Use certified reference materials (CRMs) with documentation of purity and traceability for regulatory compliance. |
| Matrix-Mimicking Solvents | Diluent for standards and samples. | DMSO, N,N-Dimethylacetamide, and water are common. Must be high-purity (e.g., LC-MS grade) to minimize background interference. |
| System Suitability Test Mix | Verifies instrument performance prior to sample analysis. | A mixture of key analytes at specification levels (e.g., for USP <467>) used to check sensitivity, resolution, and retention time stability. |
The detection of N-Nitrosodimethylamine (NDMA), a genotoxic impurity, in ranitidine products led to one of the most significant pharmaceutical recalls in recent history. NDMA, classified as a probable human carcinogen (Class 2A) according to ICH M7 guidelines, was found to form in ranitidine drug substances and products under various storage conditions [103] [104]. This case study examines the application of advanced chromatographic techniques for the quantitative analysis of NDMA in ranitidine, framed within the broader context of automated headspace sampling for pharmaceutical quality control. The findings highlight the critical importance of robust analytical methods in ensuring drug safety and navigating regulatory challenges.
Background and Regulatory Context
Ranitidine, a histamine H2-receptor antagonist, was widely used for treating gastric and duodenal ulcers and gastroesophageal reflux disease (GERD) before the NDMA issue emerged [103]. The U.S. Food and Drug Administration (FDA) established an acceptable daily intake for NDMA at 0.096 µg per day (equivalent to 0.32 parts per million for ranitidine) [105] [104]. Regulatory testing revealed that some ranitidine products contained NDMA levels exceeding this limit by up to nine-fold when taken as prescribed [104], prompting global regulatory actions including market suspension and product recalls.
The formation of NDMA in ranitidine is primarily driven by solid-state reactive species introduced during pharmaceutical manufacturing processes such as crystallization, milling, and grinding [104]. Recent research demonstrates that ranitidine hydrochloride with more crystal defects degrades at rates up to two orders of magnitude higher than unprocessed samples under accelerated storage conditions [104].
Analytical Methodologies
Method Selection Considerations
The analysis of volatile nitrosamines like NDMA presents specific analytical challenges. While several chromatographic techniques are available, method selection must consider the thermolabile nature of ranitidine, which can form additional NDMA under heating in certain analytical systems [103].
- Gas Chromatography (GC) and GC-MS: Traditionally used for volatile compounds but less suitable for ranitidine due to the potential for artifact NDMA formation under heated inlet conditions [103].
- Static Headspace-GC: Ideal for volatile analytes in complex matrices with minimal sample preparation, leveraging the high volatility of NDMA relative to the sample matrix [106].
- Liquid Chromatography-Mass Spectrometry (LC-MS/MS): Provides excellent sensitivity and specificity without heating the sample extensively, avoiding potential degradation of ranitidine to NDMA during analysis [103].
LC-MS/MS with Valve Switching Technology
A practical high-performance liquid chromatography-mass spectrometry method was developed specifically for NDMA analysis in ranitidine, addressing the limitations of alternative techniques [103].
- Instrumentation: Shimadzu HPLC system with binary gradient pump, autosampler, column oven, and SCIEX API 4000 triple quadrupole mass spectrometer.
- Key Innovation: A ten-way switching valve between the HPLC and mass spectrometer allowed NDMA to enter the mass spectrometry while cutting out the ranitidine matrix, preventing instrument contamination and shortening service life [103].
- Chromatographic Conditions: Analytes were separated using appropriate mobile phases and columns, though specific details were not provided in the available literature.
- Sample Preparation: Ranitidine samples underwent simple extraction with methanol. All solutions were stored at 4°C before analysis, and the supernatant was filtered through a 0.22 µm nylon syringe filtration before injection [103].
Method Validation
The bioanalytical method for quantifying NDMA in biological matrices was validated as per FDA's Bioanalytical Method Validation guidance, demonstrating exceptional sensitivity with a linear range from 15.6 pg/mL to 2000 pg/mL [107]. This method utilized low sample volumes (2 mL for urine and 1 mL for plasma), making it suitable for clinical study samples to evaluate the influence of ranitidine administration on NDMA excretion [107].
Experimental Protocol: NDMA Analysis in Ranitidine Products
Sample Preparation
- Weighing: Accurately weigh approximately 100 mg of homogenized ranitidine sample into a suitable container.
- Extraction: Add 10 mL of methanol as extraction solvent.
- Mixing: Vortex the mixture for 2 minutes to ensure complete extraction.
- Centrifugation: Centrifuge at 10,000 rpm for 10 minutes to separate particulate matter.
- Filtration: Carefully transfer the supernatant and filter through a 0.22 µm nylon syringe filter.
- Storage: Store the filtered solution at 4°C until analysis to prevent degradation.
Instrumental Analysis
- LC Conditions:
- Column: Select an appropriate reversed-phase column (e.g., C18).
- Mobile Phase: Optimize gradient elution using water and methanol or acetonitrile, both modified with 0.1% formic acid.
- Flow Rate: 0.3 mL/min.
- Injection Volume: 5-10 µL.
- Column Temperature: Maintain at 30-40°C.
- MS Detection:
- Ionization Mode: Positive electrospray ionization (ESI+).
- Detection Mode: Multiple Reaction Monitoring (MRM).
- Ion Transitions: Monitor specific precursor-to-product ion transitions for NDMA (e.g., m/z 75.1 → 43.0 for quantification).
- Valve Switching Program:
- Configure the ten-way switching valve to divert the ranitidine matrix to waste during early elution.
- Switch the flow to direct NDMA into the mass spectrometer at its specific retention window.
- Return to waste position after NDMA elution to protect the instrument.
Quantification
- Calibration Standards: Prepare NDMA calibration standards in methanol across the concentration range of 3-100 ng·mL⁻¹.
- Linear Regression: Establish a calibration curve by plotting peak area against concentration. The method demonstrates a good linear relationship (r = 0.9992) within this range [103].
- Quality Control: Analyze quality control samples at low, medium, and high concentrations within the calibration range to ensure accuracy and precision.
Quantitative Data and Results
NDMA Levels in Marketed Ranitidine Products
Analysis of 21 batches of ranitidine products from various manufacturers revealed significant variation in NDMA content, with several batches exceeding acceptable limits [103].
Table 1: NDMA Content in Ranitidine Hydrochloride Capsules from Various Manufacturers
| Manufacturer | Batch Number | NDMA Concentration (ng·mL⁻¹) | NDMA Concentration (ppm) | Exceeds ADI* |
|---|---|---|---|---|
| A | 306200201 | Not Detected (<1.0) | Not Detected | No |
| C | E190903 | 10.49 | 0.35 | Yes |
| C | E200304 | 5.24 | 0.17 | No |
| D | 1907012 | 57.05 | 1.90 | Yes |
| F | 2002512 | 11.65 | 0.39 | Yes |
| F | 2005784 | 3.38 | 0.11 | No |
| G | 190603 | 24.20 | 0.81 | Yes |
| H | 1904221 | 27.52 | 0.92 | Yes |
Acceptable Daily Intake (ADI) limit for ranitidine hydrochloride capsules is 0.32 ppm [103]
The data demonstrates that 7 out of 17 batches of ranitidine hydrochloride capsules exceeded the acceptable daily intake limit of 0.32 ppm, with the highest level reaching 1.90 ppm – nearly six times the acceptable limit [103].
FDA Laboratory Testing Results
The U.S. FDA conducted extensive testing of ranitidine and nizatidine products, detecting NDMA in all samples tested [105].
Table 2: FDA Testing of NDMA Levels in Ranitidine and Nizatidine Products
| Company | Product | Lots Tested | NDMA Level (ppm) | NDMA (micrograms/tablet or dose) |
|---|---|---|---|---|
| Sanofi Pharmaceutical | OTC Ranitidine 150mg | 8 lots | 0.07-2.38 | 0.01-0.36 |
| Sanofi Pharmaceutical | OTC Ranitidine 75mg | 8 lots | 0.10-0.55 | 0.01-0.04 |
| Novitium | Rx Ranitidine 300mg | S18038B | 2.85 | 0.86 |
| Dr Reddy's | Rx Ranitidine 300mg | C805265 | 0.68 | 0.20 |
| Aurobindo | Rx Ranitidine 300mg | RA3019001-A | 1.86 | 0.56 |
| Silarx Pharma | Ranitidine 150mg Syrup | 3652081-02661 | 1.37 | 0.20 |
The FDA testing revealed substantial variation between manufacturers and product types, with some lots containing significantly higher NDMA levels than others [105].
Headspace Sampling as an Alternative Approach
Principles of Headspace Sampling
Headspace sampling is a sample introduction technique for gas chromatography that analyzes the gas layer above a sample in a sealed vial rather than the sample itself [106]. This technique is particularly suitable for volatile analytes like NDMA when the sample matrix is less volatile. The fundamental equation governing headspace analysis is:
A ∝ CG = C0/(K + β)
Where A is the detector response area, CG is the analyte concentration in the gas phase, C0 is the initial sample concentration, K is the partition coefficient, and β is the phase ratio [106]. To maximize detector response, conditions should be optimized to minimize the sum of K and β [106].
Comparison of Headspace Techniques
A systematic comparison of static and dynamic headspace sampling techniques for gas chromatography revealed distinct performance characteristics [26].
Table 3: Comparison of Headspace Sampling Techniques
| Technique Class | Specific Techniques | Extraction Yields | Method Detection Limits | Relative Standard Deviations |
|---|---|---|---|---|
| Static Sampling | Syringe, Loop | ~10-20% | ~100 ng·L⁻¹ | <27% |
| Static Enrichment | SPME, PAL SPME Arrow | Up to ~80% | Picogram per liter range | <27% |
| Dynamic Enrichment | ITEX, Trap Sampling | Up to ~80% | Picogram per liter range | <27% |
Static sampling techniques provide sufficient extraction yields for many applications, while enrichment techniques (both static and dynamic) offer significantly lower detection limits, making them suitable for trace analysis [26].
Strategic Implementation in Quality Control
Headspace Gas Analysis (HGA) based on laser absorption spectroscopy (TDLAS) represents an advanced, non-destructive method for quantifying gases in pharmaceutical packaging headspace [108]. Recognized by the United States Pharmacopoeia (USP <1207>) as a quality control methodology, HGA enables 100% product inspection without sample destruction, facilitating real-time process monitoring and correction [108].
The Scientist's Toolkit
Table 4: Essential Research Reagent Solutions for NDMA Analysis
| Item | Function/Application |
|---|---|
| NDMA Reference Standard | Quantification and method calibration; requires special handling due to carcinogenicity [103] |
| Ranitidine Hydrochloride Reference Standard | System suitability testing and method development [103] |
| Methanol (HPLC Grade) | Sample extraction and preparation; stores solutions at 4°C before analysis [103] |
| Formic Acid | Mobile phase modifier for improved ionization efficiency in LC-MS [103] |
| Deionized Water | Mobile phase component and sample preparation [103] |
| 0.22 µm Nylon Syringe Filters | Sample cleanup before injection into chromatographic system [103] |
| Headspace Vials (10-22 mL) | Sample incubation for headspace-GC analysis; requires tight seals to prevent volatile loss [106] |
| Solid-Phase Microextraction Fibers | Enrichment of volatile analytes in headspace sampling [26] |
Workflow and Process Diagrams
NDMA Analysis Workflow
NDMA Formation Factors
The quantitative analysis of NDMA in ranitidine products exemplifies the critical role of advanced analytical methodologies in modern pharmaceutical quality control. The development of specialized LC-MS/MS methods with valve switching technology addressed the unique challenges posed by the thermolabile nature of ranitidine, enabling accurate quantification without artifact formation [103]. The significant variation in NDMA levels across different manufacturers and batches underscores the impact of manufacturing processes and solid-state reactivity on product quality and safety [104].
This case study further demonstrates how automated headspace sampling techniques provide a complementary approach for volatile impurity analysis, with the potential for integration into continuous quality control systems. The findings highlight the necessity for comprehensive impurity control strategies throughout the product lifecycle, from raw material selection and process optimization to finished product testing and stability monitoring. As regulatory scrutiny of genotoxic impurities intensifies, the pharmaceutical industry must continue to advance analytical capabilities and implement robust quality systems to ensure patient safety and maintain regulatory compliance.
Automated headspace sampling has become an indispensable technique in pharmaceutical quality control, particularly for the analysis of volatile impurities and residual solvents. This technique minimizes sample preparation, reduces matrix interference, and enhances analytical precision [4]. The future evolution of this field is being shaped by two powerful trends: the integration of artificial intelligence (AI) for data analysis and predictive modeling, and the ongoing miniaturization of sampling systems aligned with Green Analytical Chemistry principles [109]. These advancements promise to transform headspace sampling from a routine analytical tool into an intelligent, efficient, and sustainable component of the modern pharmaceutical laboratory. This article explores these future directions through quantitative data analysis, detailed experimental protocols, and visual workflows tailored for researchers and drug development professionals.
Quantitative Market and Performance Trends
The adoption of advanced headspace sampling technologies is reflected in market data and performance metrics. The following tables summarize key quantitative trends that underscore the growth and effectiveness of these systems.
Table 1: Global Headspace Samplers Market Outlook
| Attribute | Historical Data (2023) | Projection (2032) | CAGR (2025-2032) |
|---|---|---|---|
| Market Size | USD 1.2 Billion | USD 2.3 Billion | 7.6% |
| Data Source: Marketsizeandtrends, Industry Analysis [14] |
Table 2: Performance Comparison of Headspace Sampler Types
| Sampler Type | Key Features | Typical Applications | Market Trend |
|---|---|---|---|
| Static Headspace | Simple, cost-effective, reliable & reproducible results | Routine analysis of volatiles at higher concentrations | Significant current market share |
| Dynamic Headspace | Collects larger gas volumes, higher sensitivity & specificity | Detecting trace-level contaminants or impurities | Anticipated faster growth rate |
| Data Source: Marketsizeandtrends, Product Type Analysis [14] |
Table 3: AI-Driven Drug Discovery Pipeline (as of April 2024)
| Clinical Trial Phase | Number of AI-Discovered Drugs | Key Notes |
|---|---|---|
| Phase I | 17 | One trial ended |
| Phase I/II | 5 | One discontinued |
| Phase II/III | 9 | One reported non-significant findings |
| Data Source: Aionlabs, Analysis of eight leading AI drug discovery companies [110] |
Experimental Protocols
Protocol 1: AI-Integrated Quality Prediction for Multi-Unit Manufacturing
This protocol is adapted from a real-world application of an AI-integrated Intelligent Quality Prediction and Diagnostic (IQPD) framework for a product with complex, multi-stage manufacturing [111].
Application Note: This framework is designed for quality prediction and diagnostics in small-sample, multi-unit pharmaceutical manufacturing processes, facilitating a transition from experience-driven to data-driven operations.
Materials:
- Data Source: Multi-year historical manufacturing data covering the entire process from raw materials to finished products.
- AI Platform: Computational environment capable of running ensemble machine learning models and graph attention networks (GANs).
Procedure:
- Data Collection and Curation:
- Collect data spanning a minimum of four years from at least four different production units.
- Ensure the dataset comprehensively covers all critical process parameters and quality attributes across all manufacturing units.
- Model Development - Path-enhanced Double Ensemble (PeDGAT):
- Implement a model that combines a Graph Attention Network (GAT) to encode complex, long-range dependencies between different production units.
- Integrate path information to capture sequential dependencies across the manufacturing process.
- Employ a double ensemble strategy to enhance model stability and performance, which is crucial when working with small-sample systems.
- Model Training and Validation:
- Train the PeDGAT model on the curated historical dataset.
- Validate the model's predictive accuracy and stability against a holdout dataset. The referenced study achieved an average improvement of 13.18% in prediction accuracy and 87.67% in stability across three key indicators compared to traditional global models.
- Diagnostic Modeling:
- Develop a diagnostic model using Grey Correlation Analysis and expert knowledge to identify root causes of quality variations without relying on large sample sizes.
- This model provides a panoramic view of attribute relationships across all units, enhancing process transparency.
- System Integration and Deployment:
- Integrate the validated IQPD framework into a Human-Cyber-Physical System.
- Utilize the framework for real-time quality monitoring and adjustments during active manufacturing.
Protocol 2: Gas-Evolving Headspace GC for Quantifying Inorganic Compounds
This protocol details an innovative headspace technique for quantifying non-volatile inorganic compounds, such as Vanadium Pentoxide (V₂O₅), by measuring a volatile reaction product [112].
Application Note: This method transforms a non-volatile analyte into a measurable gas (CO₂) through a chemical reaction within a sealed headspace vial, significantly expanding the application scope of headspace GC.
Materials:
- Reagents: Vanadium Pentoxide (V₂O₅) sample, Oxalic Acid (99.5%), Sulfuric Acid (98.3%), Distilled Water.
- Equipment: Headspace Sampler (e.g., TriPlus 300), Gas Chromatograph with a thermal conductivity detector (TCD), DB-624 or similar capillary column.
Procedure:
- Reaction Optimization:
- Weigh an appropriate amount of the V₂O₅ sample into a headspace vial.
- Add a solution of oxalic acid in sulfuric acid to the vial. The reaction proceeds as follows: C₂O₄²⁻ + V₂O₅ + 6H⁺ → 2VO²⁺ + 2CO₂(g) + 3H₂O [112]
- Systematically optimize key reaction parameters:
- Temperature: Determine the optimal temperature for quantitative conversion (e.g., 60°C).
- Time: Establish the minimum reaction time required for complete conversion of V₂O₅ to CO₂.
- Headspace Analysis:
- Seal the vial and place it in the headspace autosampler.
- Set the headspace conditions (e.g., incubation at 60°C with shaking).
- The headspace sampler will pressurize the vial and transfer the generated CO₂ to the GC system.
- Chromatographic Separation and Detection:
- Use a DB-624 capillary column with helium as the carrier gas.
- Employ a TCD for the detection and quantification of CO₂.
- Validation:
- Validate the method for reliability and reproducibility by assessing spike recovery rates and measurement precision.
AI Integration in Analytical Workflows
The integration of AI is moving beyond drug discovery into analytical quality control. Machine Learning (ML) and Deep Learning (DL) models are now used to predict molecular behavior, optimize analytical methods, and interpret complex datasets, thereby reducing development time and enhancing predictive capability [113].
Key Applications:
- Molecular Modeling and Property Prediction: DL models can accurately forecast the physicochemical properties and biological activities of new chemical entities by learning from vast datasets of known molecular structures [113]. This can be applied to predict the volatility, solubility, and partition coefficients of compounds in headspace methods.
- Virtual Screening: AI can rapidly screen large chemical libraries to identify compounds with desired properties, a technique that can be adapted to predict which impurities or residual solvents are most likely to form in a given pharmaceutical process [113].
- Intelligent Quality Control: As demonstrated in Protocol 3.1, AI frameworks can provide real-time, predictive quality control for complex manufacturing processes, moving away from traditional end-product testing to a more proactive and data-driven approach [111].
Despite promising clinical progress with 31 drugs in trials as of April 2024, the full impact of AI in pharma is still unfolding. Initial setbacks highlight ongoing challenges with target selection and efficacy, but investor confidence remains strong with billions of dollars flowing into the sector [110].
Miniaturization and Green Chemistry
The drive towards miniaturization in analytical chemistry is closely aligned with the 12 principles of Green Chemistry [109]. In headspace sampling, this trend focuses on reducing solvent consumption, minimizing waste generation, and lowering the overall environmental footprint without compromising analytical performance.
Advancements and Techniques:
- Green Liquid Chromatography (GLC): While primarily for LC, its principles directly influence greener practices in all analytical fields, including the use of more environmentally friendly mobile phases and high-performance columns that reduce solvent use [109].
- Miniaturized Sample Preparation: Techniques like liquid-liquid microextraction based on ionic liquids or deep eutectic solvents are gaining traction for their ability to minimize solvent volumes [109].
- Lab-on-a-Chip and Microfluidics: The automation and miniaturization offered by these systems significantly enhance the sustainability profile of analytical methods [109].
The Scientist's Toolkit
Table 4: Essential Research Reagent Solutions for Advanced Headspace Analysis
| Reagent/Material | Function/Application | Example Use Case |
|---|---|---|
| Dimethylsulfoxide (DMSO) | High-boiling point, aprotic polar solvent used as sample diluent | Preferred diluent for analyzing residual solvents (e.g., in Losartan Potassium API) due to higher precision and sensitivity vs. water [4] |
| Oxalic Acid | Reducing agent in gas-evolving headspace reactions | Converts non-volatile V₂O₅ into quantifiable CO₂ for indirect measurement [112] |
| Ionic Liquids | Green solvent additives | Used in miniaturized sample preparation to improve extraction efficiency and reduce organic solvent consumption [109] |
| Graph Attention Network (GAT) Models | AI for encoding complex inter-unit dependencies | Core of the PeDGAT model for predicting quality in multi-stage pharmaceutical manufacturing [111] |
Workflow and System Diagrams
Conclusion
Automated headspace sampling is an indispensable technology for modern pharmaceutical quality control, offering unparalleled efficiency, accuracy, and compliance in the analysis of volatile impurities. By mastering foundational principles, applying robust methodologies, effectively troubleshooting common issues, and rigorously validating methods, laboratories can significantly enhance their analytical capabilities. The future of this field points toward greater integration with artificial intelligence for data analysis, continued miniaturization of systems, and the adoption of even greener analytical techniques. These advancements will further empower researchers and quality control professionals to ensure drug safety and efficacy, ultimately accelerating the development and delivery of new therapeutics to patients.
References
- 1. : Types and Uses | Phenomenex Headspace Gas Chromatography [https://www.phenomenex.com/knowledge-center/gc-knowledge-center/headspace-gc-principles-applications]
- 2. Headspace Sampling Fundamentals [https://www.agilent.com/en/product/gas-chromatography/gc-sample-preparation-introduction/what-is-headspace?srsltid=AfmBOoo639xYzHGfv4THNkYbI2kNJqVzCzvtPSSokb4DggeRxLsaemAz]
- 3. Versa Automated Headspace Vial Sampler [https://scioninstruments.com/products/versa-automated-headspace-vial-sampler/]
- 4. Analytical Method by Headspace‐Gas Chromatography for ... [https://pmc.ncbi.nlm.nih.gov/articles/PMC12614197/]
- 5. Residual Solvents and Organic Volatile Impurities (OVI) ... [https://www.intertek.com/pharmaceutical/analysis/residual-solvents-voc-ovi-analysis/]
- 6. Recent progress in the determination of volatile impurities ... [https://www.sciencedirect.com/science/article/abs/pii/S0165993606001233]
- 7. Validation of an analytical method for quality control ... [https://www.sciencedirect.com/science/article/abs/pii/S0731708508001027]
- 8. Platform headspace gas chromatography method for high ... [https://www.sciencedirect.com/science/article/abs/pii/S0731708523001188]
- 9. Volatile Organic Impurities and Residual Solvents [https://www.thermofisher.com/us/en/home/industrial/pharma-biopharma/pharmaceutical-quality-control-testing/volatile-organic-impurities-residual-solvents.html]
- 10. Residual Solvent Analysis - Pharmaceutical [https://syft.com/industries/pharmaceutical/residual-solvent-analysis/]
- 11. A Fast, Simplified Approach to Quantitative Headspace ... [https://www.chromatographyonline.com/view/fast-simplified-quantitative-headspace-analysis-volatile-impurities-drug-packaging-products]
- 12. Headspace GCFID Testing in Pharma: A QA Team's Guide [https://resolvemass.ca/headspace-gcfid-testing-in-pharma-a-qa-teams-guide/]
- 13. Smart quality control in pharmaceuticals [https://www.mckinsey.com/industries/life-sciences/our-insights/digitization-automation-and-online-testing-embracing-smart-quality-control]
- 14. Headspace Samplers Market Report | Global Forecast ... [https://dataintelo.com/report/global-headspace-samplers-market]
- 15. North America Fully Automatic Headspace Sampling ... [https://www.linkedin.com/pulse/north-america-fully-automatic-headspace-sampling-tkouf]
- 16. Headspace Sampling Fundamentals [https://www.agilent.com/en/product/gas-chromatography/gc-sample-preparation-introduction/what-is-headspace?srsltid=AfmBOoply1gtyJYqzhRIZMc5p2Xw0tS8GqG91MDWhu7Eb2zrRzYhFiAy]
- 17. Exploring Headspace Sampling in Volatile Sample Analysis [https://www.azom.com/article.aspx?ArticleID=22979]
- 18. Headspace Extraction - an overview [https://www.sciencedirect.com/topics/immunology-and-microbiology/headspace-extraction]
- 19. PDA 2025: How Automation Assures Product Quality for ... [https://www.biopharminternational.com/view/pda-2025-how-automation-assures-product-quality-for-next-gen-biopharma]
- 20. FDA readies for QMSR implementation with draft QMS ... [https://www.jdsupra.com/legalnews/fda-readies-for-qmsr-implementation-8425170/]
- 21. Headspace Sampling Fundamentals [https://www.agilent.com/en/product/gas-chromatography/gc-sample-preparation-introduction/what-is-headspace?srsltid=AfmBOop_a073Ow7iruz9t56Qjh01GakPUprv-ZfWy4yssgl4x9L5DbeJ]
- 22. Principles of Headspace Analysis [https://scioninstruments.com/blog/principles-of-headspace-analysis/]
- 23. Is Headspace Sampling Quantitative? [https://www.chromatographyonline.com/view/headspace-sampling-quantitative-0]
- 24. Headspace Sampling [https://www.chromatographyonline.com/view/headspace-sampling]
- 25. Static Headspace Sampling [https://www.chromatographyonline.com/view/static-headspace-sampling]
- 26. Systematic comparison of static and dynamic headspace ... [https://pubmed.ncbi.nlm.nih.gov/27526093/]
- 27. Dynamic versus static sampling for the quantitative ... [https://www.sciencedirect.com/science/article/abs/pii/S0021967302002224]
- 28. Development and validation of a headspace gas ... [https://pmc.ncbi.nlm.nih.gov/articles/PMC3146089/]
- 29. Headspace Autosampler 2025 Trends and Forecasts 2033 [https://www.archivemarketresearch.com/reports/headspace-autosampler-186928]
- 30. Headspace Sampling Fundamentals [https://www.agilent.com/en/product/gas-chromatography/gc-sample-preparation-introduction/what-is-headspace?srsltid=AfmBOop03zPH70A1E3hRIIF_PK3vrZpybnGnMDcLrGDTnqweV3xe8mlb]
- 31. Unlocking the Future of Headspace Autosampler [https://www.datainsightsmarket.com/reports/headspace-autosampler-1559605]
- 32. How do I choose the right septum for my HPLC vial? [https://www.hplcvials.com/faq/how-do-i-choose-the-right-septum-for-my-hplc-vial.html]
- 33. Vial Septa Selection Guide - News [https://www.aijirenvial.com/news/vial-septa-selection-guide-84964837.html]
- 34. Headspace Sampling Fundamentals [https://www.agilent.com/en/product/gas-chromatography/gc-sample-preparation-introduction/what-is-headspace?srsltid=AfmBOooZ17m6dPS5-IlGc5_2DrMrt5zjszDsvYyoQUrdQmaMhP-cptp1]
- 35. Fully Automatic Headspace Sampler Market Size By Type [https://www.linkedin.com/pulse/fully-automatic-headspace-sampler-market-size-type-application-7zdzf/]
- 36. From Gas to Gas: Fundamentals of Static Headspace ... [https://www.chromatographyonline.com/view/from-gas-to-gas-fundamentals-of-static-headspace-extraction-gas-chromatography]
- 37. Exploring Innovations in Headspace Sampling Supplies [https://www.marketreportanalytics.com/reports/headspace-sampling-supplies-288822]
- 38. Optimization and Validation of a Headspace Solid-Phase ... [https://pmc.ncbi.nlm.nih.gov/articles/PMC8624712/]
- 39. AUTOMA+ 2025: Pharmaceutical Automation and ... [https://www.drugdiscoverytrends.com/automa-2025-to-cover-pharma-automation-and-digitalization-trends/]
- 40. Headspace Sampling Fundamentals [https://www.agilent.com/en/product/gas-chromatography/gc-sample-preparation-introduction/what-is-headspace?srsltid=AfmBOor0oilC7QrWue6MkHstASSz3QbwDPjNKB11aC_x5ffIlefZqavI]
- 41. Headspace Injection Method for Intermittent Sampling and ... [https://pmc.ncbi.nlm.nih.gov/articles/PMC11969650/]
- 42. Optimization of headspace extraction conditions for volatile ... [https://pubs.rsc.org/en/content/articlehtml/2025/ay/d5ay01147g]
- 43. Optimized synthesis of suvorexant and determination of eight ... [https://pubs.rsc.org/en/content/articlehtml/2025/ra/d5ra06779k]
- 44. Residual Solvent Analysis Information | Thermo Fisher Scientific - US [https://www.thermofisher.com/us/en/home/industrial/pharma-biopharma/pharma-biopharma-learning-center/pharmaceutical-qa-qc-information/residual-solvent-analysis-information.html]
- 45. FAQs: Residual Solvents | USP [https://www.usp.org/frequently-asked-questions/residual-solvents]
- 46. USP General Chapters 467 Residual Solvents and 1467 Residual Solvents-Verification of Compendial Procedures (Live Webcast) [https://www.usp.org/events-training/course/usp-general-chapters-467-residual-solvents-and-1467-residual-solvents-0]
- 47. Validation of a generic analytical procedure for ... [https://www.sciencedirect.com/science/article/pii/S0731708504002687]
- 48. North America Fully Automatic Headspace Sampler Market ... [https://www.linkedin.com/pulse/north-america-fully-automatic-headspace-sampler-xk2ee/]
- 49. AQbD-based Headspace GC-MS/MS method development ... [https://pubs.rsc.org/en/content/articlelanding/2025/an/d5an00653h]
- 50. Headspace Sampling Supplies Competitive Strategies [https://www.marketreportanalytics.com/reports/headspace-sampling-supplies-288839]
- 51. Impurity Profiling in Pharmaceuticals: Analytical Methods ... [https://biotech-spain.com/en/articles/impurity-profiling-in-pharmaceuticals-analytical-methods-and-compliance/]
- 52. Recent trends in the impurity profile of pharmaceuticals [https://pmc.ncbi.nlm.nih.gov/articles/PMC3255420/]
- 53. Headspace Sampling Fundamentals [https://www.agilent.com/en/product/gas-chromatography/gc-sample-preparation-introduction/what-is-headspace?srsltid=AfmBOopTJbNDJRIOKVZtZWVJhPJ4j3-R97ZrAoyY_xbpqPI0FqWiRv-M]
- 54. High-Throughput Headspace Analysis of Volatile Impurities ... [https://www.chromatographyonline.com/view/high-throughput-headspace-analysis-of-volatile-impurities-in-consumer-products-using-standard-additions]
- 55. Optimizing Sample Introduction for Headspace GC [https://www.chromatographyonline.com/view/optimizing-sample-introduction-headspace-gc]
- 56. The use of multiple headspace extraction gas ... [https://www.pharmaceutical-technology.com/sponsored/the-use-of-multiple-headspace-extraction-gas-chromatography/]
- 57. Headspace Sampling Fundamentals [https://www.agilent.com/en/product/gas-chromatography/gc-sample-preparation-introduction/what-is-headspace?srsltid=AfmBOord2NqPiLVRWDm-5vhlTeIDkGkyq5QTUwPxvyHKJ5h7r2Jk8-zq]
- 58. Determination of Monomers in Polymers by Multiple ... [https://www.perkinelmer.com/library/app-determination-of-monomers-in-polymers-by-multiple-headspace-extraction.html]
- 59. The Solvent-Free Revolution: Redefining Green Chemistry ... [https://pharmafeatures.com/the-solvent-free-revolution-redefining-green-chemistry-in-pharmaceuticals/]
- 60. In-tube dynamic extraction a green solventless alternative ... [https://www.sciencedirect.com/science/article/pii/S2772582021000024]
- 61. A green approach for the automatic quantitative analysis of ... [https://pubmed.ncbi.nlm.nih.gov/38580405/]
- 62. Fully Automatic Headspace Sampler 2025 Market Trends and ... [https://www.datainsightsmarket.com/reports/fully-automatic-headspace-sampler-1520485]
- 63. Development and performance evaluation of a novel ... [https://www.sciencedirect.com/science/article/pii/S0021967319305229]
- 64. Comparison of fully-automated headspace single drop ... [https://www.sciencedirect.com/science/article/abs/pii/S0026265X14001374]
- 65. Headspace Sampling | LCGC International [https://www.chromatographyonline.com/view/headspace-sampling-0]
- 66. What Are The Difficulties Of Headspace Sampling? - Blogs [https://www.alwsci.com/news/what-are-the-difficulties-of-headspace-samplin-84959040.html]
- 67. Headspace Sampling Supplies Trends and Opportunities ... [https://www.datainsightsmarket.com/reports/headspace-sampling-supplies-209844]
- 68. A green approach for the automatic quantitative analysis of ... [https://www.sciencedirect.com/science/article/pii/S0003267024002885]
- 69. Headspace Sampling Optimization [https://scioninstruments.com/us/blog/headspace-sampling-optimization/]
- 70. Optimization of headspace extraction conditions for volatile ... [https://pubs.rsc.org/en/content/articlelanding/2025/ay/d5ay01147g]
- 71. Enhancing Extractions by Salting Out | LCGC International [https://www.chromatographyonline.com/view/enhancing-extractions-by-salting-out]
- 72. Headspace Solid-Phase Micro-Extraction Method ... [https://www.mdpi.com/2297-8739/11/1/27]
- 73. How to Identify Ghost Peaks in U/HPLC [https://www.phenomenex.com/knowledge-center/hplc-knowledge-center/ghost-peaks-uhplc-hplc-causes-preventions?srsltid=AfmBOooKplzjsQ3tefX2WHEPIeAchDCGl0LaHj-3xx28dEizzdIboaro]
- 74. Ghost Peak Investigation in a Reversed-Phase Gradient ... [https://www.chromatographyonline.com/view/ghost-peak-investigation-reversed-phase-gradient-lc-system]
- 75. Conquer Ghost Peaks in HPLC: Identification and Elimination [https://www.sepscience.com/conquer-ghost-peaks-in-hplc-identification-and-elimination-10277]
- 76. Are You Controlling Peak Integration to Ensure Data ... [https://www.chromatographyonline.com/view/are-you-controlling-peak-integration-ensure-data-integrity]
- 77. Headspace Sampling, Part II: Instrumentation [https://www.chromatographyonline.com/view/headspace-sampling-part-ii-instrumentation]
- 78. Headspace Sampling Fundamentals [https://www.agilent.com/en/product/gas-chromatography/gc-sample-preparation-introduction/what-is-headspace?srsltid=AfmBOopRff2WalIYgLrOwPfQkDPmtRVzkOAYmKMm5JOTUhIgVqe4PpeM]
- 79. Headspace Sampling Fundamentals [https://www.agilent.com/en/product/gas-chromatography/gc-sample-preparation-introduction/what-is-headspace?srsltid=AfmBOorW00i3vgJjZ1pclX2iDmqbNUW5x9ZHsVVERUSDeCqnaLW2eX_6]
- 80. Causes of Retention Time Drift in HPLC [https://www.elementlabsolutions.com/uk/chromatography-blog/post/causes-of-retention-time-drift-in-hplc]
- 81. Common Issues And Solutions in Headspace Sampling ... [https://www.alwsci.com/news/common-issues-and-solutions-in-headspace-sampl-85029965.html]
- 82. What Could Cause Peak Overlapping in Results When ... [https://www.mtoz-biolabs.com/what-could-cause-peak-overlapping-in-results-when-contamination-is-unlikely-and-purification-was-carefully-performed.html]
- 83. The LCGC Blog: Retention Shifts in HPLC [https://www.chromatographyonline.com/view/lcgc-blog-retention-shifts-hplc]
- 84. Methods for Changing Peak Resolution in HPLC [https://www.chromatographyonline.com/view/methods-changing-peak-resolution-hplc-advantages-and-limitations]
- 85. HPLC 2025 Preview: The Present and Future of ... [https://www.chromatographyonline.com/view/hplc-2025-preview-the-present-and-future-of-automation-in-analytical-laboratories]
- 86. Methodologies of quantitative headspace analysis using ... [https://www.sciencedirect.com/science/article/abs/pii/S000326700001374X]
- 87. A Robust Static Headspace GC-FID Method to Detect and ... [https://pmc.ncbi.nlm.nih.gov/articles/PMC5857322/]
- 88. Headspace Sampling Fundamentals [https://www.agilent.com/en/product/gas-chromatography/gc-sample-preparation-introduction/what-is-headspace?srsltid=AfmBOorra3WoJwk87-XKo1Rgyq0GW7P7R7veBZDyxVly-z60zuOl_dm0]
- 89. ICH and FDA Guidelines for Analytical Method Validation [https://www.labmanager.com/ich-and-fda-guidelines-for-analytical-method-validation-34252]
- 90. Development and Validation of a Solvent-Free Headspace ... [https://www.mdpi.com/2227-9040/11/9/487]
- 91. Limit of Detection ( LOD ) and Limit of Quantitation ( LOQ ) in Analytical... [https://www.pharmaspecialists.com/2023/09/lod-and-loq-in-analytical-method-validation.html]
- 92. Determination of a robust headspace GC-MS/MS method ... [https://pmc.ncbi.nlm.nih.gov/articles/PMC11458342/]
- 93. Headspace Sampling Fundamentals [https://www.agilent.com/en/product/gas-chromatography/gc-sample-preparation-introduction/what-is-headspace?srsltid=AfmBOop9o8pSO_jV-OOFeriuIAgjXmJQN2575b9Rzei9lStJbHh8sGuJ]
- 94. Comparison of GC-MS and GC×GC-MS in the Analysis ... [https://pmc.ncbi.nlm.nih.gov/articles/PMC4849136/]
- 95. Headspace Sampling: Instrumentation [https://www.chromatographyonline.com/view/headspace-sampling-instrumentation]
- 96. Selected Ion Flow Tube-Mass Spectrometry (SIFT-MS) as ... [https://pmc.ncbi.nlm.nih.gov/articles/PMC8655936/]
- 97. SIFT-MS: Gas-Phase Chemistry - MS with a Difference [https://www.spectroscopyonline.com/view/sift-ms-gas-phase-chemistry-ms-difference]
- 98. Pharmaceutical Method Validation for SIFT-MS [https://syft.com/pharmaceutical-method-validation-for-sift-ms/]
- 99. LIGHTHOUSE | CCIT, Headspace Oxygen and Moisture ... [https://lighthouseinstruments.com/]
- 100. Headspace Sampling Fundamentals [https://www.agilent.com/en/product/gas-chromatography/gc-sample-preparation-introduction/what-is-headspace?srsltid=AfmBOorers5sEC6hQd-0d0o3bkOvFaWAUa7t7AV5lrOiMVJB1XcP7Q7g]
- 101. Achieving Lab Digitalization: A Guide to Data Integrity [https://www.labmanager.com/achieving-lab-digitalization-a-guide-to-data-integrity-34428]
- 102. Development and validation of headspace gas ... [https://pmc.ncbi.nlm.nih.gov/articles/PMC11737362/]
- 103. Determination of N-nitrosodimethylamine in Ranitidine ... [https://pmc.ncbi.nlm.nih.gov/articles/PMC8842598/]
- 104. Crystal defects cause nitrosamine formation in ranitidine ... [https://www.sciencedirect.com/science/article/abs/pii/S0022354925004149]
- 105. Laboratory Tests | Ranitidine [https://www.fda.gov/drugs/drug-safety-and-availability/laboratory-tests-ranitidine]
- 106. Headspace Sampling Fundamentals [https://www.agilent.com/en/product/gas-chromatography/gc-sample-preparation-introduction/what-is-headspace?srsltid=AfmBOoqbeoEV1NwPFPKISmuHdzc63V3PfhxaBbUzhZ3LlSGcG0rS-uAl]
- 107. A Bioanalytical Method for Quantification of N ... [https://www.sciencedirect.com/science/article/pii/S0022354923000291]
- 108. Headspace Gas Analysis: how, what and why for ... [https://bexchange.bonfiglioliengineering.com/headspace-gas-analysis-hga-what-it-is-how-it-works-and-why-it-is-particularly-useful-in-the-pharmaceutical-industry]
- 109. Advances in Green Analytical Techniques for Impurity Profiling in... [https://jyoungpharm.org/10.5530/jyp.20250075]
- 110. The AI Revolution in Pharma – Will 2025 Be ... [https://aionlabs.com/the-ai-revolution-in-pharma-will-2025-be-the-breakthrough-year/]
- 111. - AI IQPD framework of integrated prediction and... | EurekAlert! quality [https://www.eurekalert.org/news-releases/1097518]
- 112. Gas-Evolving Headspace Technique toward Highly ... [https://www.sciencedirect.com/science/article/abs/pii/S0021967325007496]
- 113. Transformative Role of Artificial Intelligence in Drug ... [https://pmc.ncbi.nlm.nih.gov/articles/PMC12406033/]