Contaminants of Emerging Concern: Environmental Exposure, Molecular Mechanisms, and Analytical Frontiers
This article provides a comprehensive analysis of Contaminants of Emerging Concern (CECs), addressing their environmental pathways, effects on human health, and advanced detection methodologies.
Contaminants of Emerging Concern: Environmental Exposure, Molecular Mechanisms, and Analytical Frontiers
Abstract
This article provides a comprehensive analysis of Contaminants of Emerging Concern (CECs), addressing their environmental pathways, effects on human health, and advanced detection methodologies. Tailored for researchers, scientists, and drug development professionals, it explores the foundational science behind CECs, including pharmaceuticals, personal care products, and industrial chemicals. It critically reviews state-of-the-art analytical techniques, from high-resolution mass spectrometry to biomonitoring, and tackles persistent challenges in risk assessment and data interpretation. The scope extends to evaluating current regulatory frameworks and proposing integrative strategies for future environmental health research and policy, synthesizing findings from recent studies and technological advancements to guide scientific and clinical priorities.
Defining the Spectrum: Sources, Pathways, and Health Impacts of CECs
Contaminants of Emerging Concern (CECs) represent a vast array of chemical and biological substances detected in the environment at concentrations that may pose newly identified risks to ecosystem and human health [1] [2]. These contaminants are characterized not necessarily by their novelty but by the growing scientific recognition of their environmental presence, persistence, and potential ecological and health impacts [2]. The term "emerging" reflects evolving understanding rather than recent invention, as many CECs have been in use for decades while their environmental fate remained unstudied [2].
The United States Environmental Protection Agency defines CECs as substances "known or anticipated to be in the environment, that may pose newly identified risks to human health or the environment" [1]. This conceptual framework encompasses natural and manufactured chemicals with features that complicate traditional risk assessment paradigms, particularly their ability to cause significant biological effects at very low concentrations and through mechanisms not captured by conventional toxicity testing [3].
Table 1: Major Categories of Contaminants of Emerging Concern
| Category | Representative Compounds | Primary Sources |
|---|---|---|
| Pharmaceuticals & Personal Care Products (PPCPs) | Antibiotics, antidepressants, synthetic hormones, fragrances [3] [2] [4] | Wastewater treatment plants, agricultural runoff, direct disposal [2] |
| Industrial Chemicals | Polybrominated diphenyl ethers (PBDEs), Perfluorinated compounds (PFCs) [4] | Industrial discharge, fire-fighting foams, consumer product leaching [4] |
| Pesticides | Glyphosate, malathion, current-use formulations [2] [5] | Agricultural and urban runoff, atmospheric deposition [2] |
| Engineered Materials | Microplastics, nanoparticles [6] [2] | Plastic degradation, consumer products, industrial applications [6] |
| Biological CECs | Antibiotic resistant bacteria (ARB), antibiotic resistant genes (ARG) [2] | Wastewater discharge, agricultural operations [2] |
Analytical Methodologies for CEC Detection
Sample Collection and Preparation
Comprehensive CEC monitoring requires sophisticated sampling strategies across multiple environmental compartments. For aqueous matrices including irrigation water, infiltration water, and groundwater, solid-phase extraction (SPE) represents the most widely employed concentration technique [7]. This method involves passing water samples through cartridges containing specialized sorbents that selectively retain target analytes, followed by elution with organic solvents. For solid matrices including soil and sediment, ultrasonic-assisted extraction (UAE) and pressurized liquid extraction (PLE) have demonstrated efficacy in recovering diverse CECs while minimizing compound degradation [7].
Critical considerations for sample integrity include:
- Matrix Characterization: Measurement of pH, electrical conductivity, total organic carbon, and suspended solids to interpret extraction efficiency [7]
- Preservation: Immediate stabilization with appropriate preservatives (e.g., sodium azide) and storage at -20°C to prevent microbial degradation [7]
- Quality Assurance: Implementation of procedural blanks, matrix spikes, and surrogate standards to account for analytical artifacts and recovery variability [7]
Instrumental Analysis
Liquid chromatography coupled with tandem mass spectrometry (LC-MS/MS) employing triple quadrupole analyzers represents the gold standard for CEC quantification in environmental matrices [7]. This platform provides the sensitivity, selectivity, and multi-residue capability essential for detecting trace-level contaminants (typically ng/L to μg/L) in complex environmental samples.
Table 2: Optimized LC-MS/MS Parameters for Multi-Residue CEC Analysis
| Parameter | ESI+ Conditions | ESI- Conditions |
|---|---|---|
| Mobile Phase | Solvent A: Ultrapure water with 0.1% formic acid; Solvent B: MeOH with 0.1% formic acid [7] | Solvent A: Ultrapure water with 1 mM ammonium fluoride; Solvent B: MeOH:AcN 65:35% (v/v) [7] |
| Ion Source Settings | Drying gas flow: 14 L/min; Nebulizer pressure: 35 psi; Drying gas temperature: 250°C; Sheath gas temperature: 350°C; Sheath gas flow: 12 L/min; Nozzle voltage: 500 V; Capillary voltage: 3500 V [7] | Same as ESI+ with polarity reversal |
| Data Acquisition | Multiple Reaction Monitoring (MRM) with optimized fragmentor voltages and collision energies for each compound [7] | Multiple Reaction Monitoring (MRM) with optimized fragmentor voltages and collision energies for each compound [7] |
Method validation studies demonstrate that this approach can simultaneously quantify 40 CECs in aqueous matrices and 28 in solid matrices with acceptable accuracy (70-120% recovery) and precision (<20% RSD) across diverse environmental samples [7]. The methodology effectively controls matrix effects through careful optimization of sample clean-up procedures and application of matrix-matched calibration standards.
Figure 1: Comprehensive Workflow for CEC Analysis in Environmental Matrices
Environmental Fate and Ecological Effects
Pathways and Persistence
CECs enter aquatic environments primarily through point sources such as wastewater treatment plant (WWTP) effluents, industrial discharges, and hospital outflows [2]. Even with advanced treatment technologies, many CECs pass through WWTPs unaltered or only partially transformed, creating a continuous introduction pathway [2]. Non-point sources including agricultural runoff (carrying pesticides and veterinary pharmaceuticals) and urban stormwater (containing automotive chemicals, PPCPs, and microplastics) represent additional significant contribution routes [6] [2].
While some CECs demonstrate limited environmental persistence, their continuous release creates "pseudo-persistent" contamination scenarios, wherein transformation and removal processes are outpaced by ongoing inputs [2]. This phenomenon is particularly relevant for pharmaceuticals and personal care products designed for biological activity, which may retain their efficacy despite dilution in receiving waters.
Mechanisms of Ecological Impact
CECs pose unique challenges to aquatic organisms through several distinct mechanisms:
Endocrine Disruption: Many PPCPs and industrial chemicals function as endocrine disrupting compounds (EDCs) that alter normal hormonal functions in aquatic organisms [3] [2]. These substances can mimic or block natural hormones, leading to reproductive impairment, developmental abnormalities, and population-level consequences. The EPA notes that EDCs may cause effects that only manifest during later life stages after early-life exposure, complicating traditional toxicity assessment [3].
Bioaccumulation and Biomagnification: Lipophilic CECs including PBDEs and PFCs accumulate in tissue and increase in concentration as they move up food chains [4]. This biomagnification results in top predators experiencing body burdens several orders of magnitude higher than environmental concentrations, with documented population declines in vulnerable species [5] [4].
Antimicrobial Resistance Promotion: The environmental presence of antibiotics, preservatives, disinfectants, and biocides contributes to the development and spread of antimicrobial resistance (AMR) [2] [5]. AMR represents a rapidly escalating global health emergency that undermined antibiotic effectiveness and contributed to approximately five million deaths in 2019 [5].
Figure 2: Environmental Fate and Effects Pathway of CECs in Aquatic Ecosystems
The Researcher's Toolkit: Essential Materials and Methods
Table 3: Essential Research Reagents and Materials for CEC Analysis
| Item | Specification | Function |
|---|---|---|
| SPE Cartridges | Oasis HLB (Hydrophilic-Lipophilic Balance), 60 mg, 3 mL [7] | Extraction and concentration of diverse CECs from aqueous matrices |
| LC-MS/MS Mobile Phase | ESI+: 0.1% formic acid in water/MeOH; ESI-: 1 mM ammonium fluoride in water/MeOH:AcN [7] | Chromatographic separation with optimized ionization efficiency |
| Internal Standards | Isotope-labeled analogs of target compounds (e.g., ¹³C, ²H) [7] | Correction for matrix effects and quantification accuracy |
| Extraction Solvents | Methanol, Acetonitrile, Ethyl Acetate (HPLC grade) [7] | Compound extraction from solid matrices and SPE elution |
| QuEChERS Kits | Pre-packaged salts and sorbents for dispersive solid-phase extraction [7] | Rapid sample preparation and clean-up for complex matrices |
Regulatory Framework and Research Priorities
The regulatory landscape for CECs remains fragmented, with significant gaps in monitoring and governance. The European Union's Water Framework Directive establishes environmental quality standards for only 45 priority substances, representing a small fraction of known CECs [2]. In the United States, the EPA has initiated a multi-year process to modernize its 1985 water quality criteria guidelines to better address the unique challenges posed by CECs, particularly endocrine disruptors that exhibit low acute toxicity but cause significant reproductive effects at very low exposure levels [3].
Critical research priorities identified include:
Risk-Based Prioritization: Development of frameworks to classify CECs and prioritize those of greatest concern based on integrated exposure and effects data [6]. Southern California Coastal Water Research Project (SCCWRP) is leading efforts to populate such frameworks with decade-long monitoring data to identify CECs with the highest potential for negative ecological impacts [6].
Global Data Equity: Addressing the substantial imbalance in CEC monitoring data, with approximately 75% of studies focused on North America and Europe despite the majority of the global population residing in Asia and Africa [5]. This geographical bias risks development of management strategies inappropriate for regions with different pollution profiles and environmental conditions [5].
Advanced Treatment Assessment: Evaluation of nature-based solutions and advanced treatment technologies for CEC removal, including constructed wetlands and vegetation filters that promote natural attenuation processes through soil-plant-microorganism systems [7]. Research demonstrates these approaches offer sustainable alternatives particularly suited to small communities where economic constraints limit conventional advanced treatment implementation [7].
Environmental exposure to contaminants of emerging concern (CECs) presents a critical research frontier in understanding ecological and public health risks. These pollutants, originating from diffuse and point sources, traverse complex pathways through agricultural, wastewater, and urban systems, often escaping conventional treatment processes. This whitepaper provides a technical overview of the primary sources, pathways, and environmental dynamics of these contaminants, framing them within the broader context of environmental exposure science. The persistence, bioaccumulative potential, and unknown toxicological profiles of many CECs highlight the urgent need for a multidisciplinary approach that integrates advanced monitoring, sophisticated analytical techniques, and innovative remediation technologies to mitigate their impacts on ecosystems and human health [8].
Contaminant Profiles and Quantitative Source Apportionment
The environmental burden of CECs is distributed across multiple primary sources. The tables below summarize the key contaminant classes and their typical loads from major anthropogenic pathways.
Table 1: Primary Contaminant Classes from Major Environmental Pathways
| Source Pathway | Key Contaminant Classes | Representative Compounds |
|---|---|---|
| Agricultural Runoff | Nutrients, Pesticides, Sediments, Pathogens | Nitrogen, Phosphorus, Atrazine, Glyphosate, E. coli [9] [10] [11] |
| Wastewater Discharge | Pharmaceuticals, Personal Care Products (PCPs), Nutrients, Surfactants | Carbamazepine, Triclosan, Ibuprofen, Bisphenol A [8] [12] [13] |
| Urban Stormwater Runoff | Polycyclic Aromatic Hydrocarbons (PAHs), Heavy Metals, Pesticides, Microplastics | Fluoranthene, Pyrene, Copper, Zinc, DEET, Phthalates [14] [15] |
Table 2: Quantitative Load from Primary Sources (United States)
| Pollutant | Agricultural Runoff (Annual Estimate) | Wastewater Discharge (Daily Volume) | Urban Stormwater (Findings from National Study) |
|---|---|---|---|
| Nitrogen | 12 million tons (fertilizer application) [11] | --- | Episodic loads often exceed those from wastewater plants [14] |
| Phosphorus | 4 million tons (fertilizer application) [11] | --- | --- |
| Pesticides | ~500,000 tons [11] | --- | Frequently detected; numerous pesticides per event [14] |
| Wastewater Volume | --- | 34 billion gallons [12] | --- |
| Organic Chemical Mixtures | --- | --- | Median: 73 chemicals/site; Cumulative conc. up to 263,000 ng/L [14] |
Environmental Pathways and Fate of Contaminants
Contaminants follow distinct hydrological and engineered pathways from their sources to receiving environments, with their fate determined by chemical properties and ecosystem processes.
Agricultural Runoff Pathway
Agricultural runoff is a non-point source of pollution, primarily driven by precipitation and irrigation events. Water flows over fields, picking up excess nutrients, pesticides, and soil sediments, subsequently discharging into groundwater or surface water bodies like streams and rivers [9] [10]. A significant environmental impact is eutrophication, where excess nitrogen and phosphorus stimulate algal blooms. The subsequent decomposition of this algal biomass depletes dissolved oxygen, creating hypoxic "dead zones" that are incapable of supporting most aquatic life, as exemplified by the annual 6,000-square-mile dead zone in the Gulf of Mexico [9] [10]. This pathway also facilitates the transport of pathogens from animal waste and pesticides, which can cause sublethal and lethal effects on aquatic organisms and bioaccumulate through the food web [9] [11].
Wastewater Discharge Pathway
Wastewater systems collect effluent from domestic and industrial sources, channeling it to treatment plants (WWTPs). While conventional WWTPs effectively remove many pollutants, a wide range of CECs, including pharmaceuticals, personal care products, and plasticizers, are often recalcitrant to treatment and are released into receiving waters with the effluent [8] [12]. Treated wastewater is a recognized point source of nutrients and CECs to rivers, lakes, and coastal waters [12]. Septic systems, used by approximately 20% of U.S. households, represent another significant pathway; system failures can lead to the contamination of groundwater and nearby surface waters with nutrients and pathogens [12].
Urban Stormwater Runoff Pathway
Urban stormwater runoff is a complex mixture of contaminants washed from impervious surfaces such as roads, parking lots, and roofs during rain events. This pathway is a major conveyor of hydrocarbons (e.g., PAHs), heavy metals, pesticides, and household chemicals [14] [15]. A multi-agency national study demonstrated that stormwater transports substantial mixtures of bioactive contaminants, with the number and concentration of chemicals positively correlated with the density of impervious surfaces and urban development [14]. The study noted that episodic storm-event organic concentrations and loads were comparable to, and often exceeded, those of daily wastewater plant discharges [14]. Atmospheric deposition and vehicular transportation are identified as major ongoing sources of urban stormwater pollution [15].
Urban contaminant transport pathway from sources to receiving waters.
Advanced Methodologies for Exposure Assessment
Tracking the fate and exposure of CECs requires sophisticated sampling and analytical protocols.
National Stormwater Contaminant Study Protocol
A seminal multi-agency study established a rigorous methodology for characterizing the national-scale contaminant profile of urban stormwater [14].
- Site Selection & Sampling: The study collected 50 flow-weighted composite samples from 21 sites across 17 states. Samples were collected from stormwater conveyance infrastructure discharging mixed runoff from residential, commercial, and industrial landscapes. Both automated refrigerated samplers and manual isokinetic samplers were employed to collect 10-L composite samples across the storm-runoff hydrograph [14].
- Analytical Techniques: Samples were analyzed for 438 organic chemicals and 62 inorganic chemicals/parameters using eight analytical methods. Key techniques included Liquid Chromatography-Tandem Mass Spectrometry (LC-MS/MS) for pharmaceuticals, Gas Chromatography-Tandem Mass Spectrometry (GC-MS/MS) for hormones, and GC-MS for household chemicals, pesticides, and semivolatiles. Inorganic parameters, including trace elements and total mercury, were analyzed via established EPA methods [14].
- Quality Assurance: A comprehensive QA/QC protocol was implemented, including field equipment blanks, laboratory reagent water blanks, and field replicates. Isotope-dilution standards or surrogate compounds were added to all organic samples prior to extraction to account for analytical variability [14].
Wastewater-Based Epidemiology (WBE)
WBE is an innovative, non-invasive tool for assessing community-wide exposure to CECs by analyzing chemical biomarkers in raw wastewater [13].
- Concept & Workflow: WBE estimates the collective exposure of a population serviced by a specific wastewater treatment plant. The core principle involves the selection of specific human excretion products (biomarkers) of a contaminant, sampling raw wastewater, and using analytical techniques to quantify the biomarkers. The measured concentrations are then back-calculated to estimate the population's exposure load [13].
- Biomarker Selection & Challenges: A critical step is the identification of appropriate biomarkers, which must be specific to human metabolism and sufficiently stable in the sewer environment. For instance, 3-phenoxybenzoic acid (3-PBA) is a common urinary metabolite of many pyrethroid pesticides but lacks specificity for a single compound. Stability tests are crucial, as some biomarkers (e.g., certain phthalate metabolites) can degrade significantly within 24 hours in wastewater, leading to underestimation of exposure [13].
- Application to Pollutants: WBE has been applied to assess exposure to pesticides, plasticizers (phthalates, bisphenols), personal care products, and heavy metals. For heavy metals, biomarkers can include the parental substance (e.g., total arsenic), metabolic biomarkers, or non-substance biomarkers like metallothionein (MT) or δ-Aminolevulinic acid (δ-ALA), which indicate broader metal exposure and toxicological effect [13].
Wastewater-based epidemiology workflow for exposure assessment.
The Scientist's Toolkit: Research Reagent Solutions
Advanced research and monitoring in this field rely on a suite of specialized reagents, standards, and materials.
Table 3: Essential Research Reagents and Materials
| Reagent / Material | Function & Application | Technical Notes |
|---|---|---|
| Isotope-Dilution Standards (iDS) | Internal standards for mass spectrometry; correct for matrix effects and analyte loss during sample preparation. | Added to all samples prior to extraction; crucial for achieving high-precision quantitation in complex environmental matrices [14]. |
| Surrogate Compounds | Monitor extraction efficiency and correct for variability in sample processing for analytes where a stable isotope-labeled analogue is unavailable. | Added at the beginning of the analytical procedure; recovery rates are used to adjust final reported concentrations [14]. |
| LC-MS/MS & GC-MS/MS Reagents | High-purity solvents and reagents for the extraction, separation, and detection of trace organic contaminants. | Enable multi-residue analysis of hundreds of CECs (e.g., pharmaceuticals, pesticides) at nanogram-per-liter levels [14] [13]. |
| Certified Reference Materials | Calibrate analytical instruments and validate methods against certified, traceable values. | Essential for ensuring the accuracy of data for heavy metals and other inorganic analytes [14]. |
| Stable Biomarkers | Specific human metabolic products used as indicators of exposure in Wastewater-Based Epidemiology. | Must be resistant to degradation in sewer conditions; e.g., some phthalate metabolites and pesticide biomarkers [13]. |
Agricultural runoff, wastewater discharge, and urban stormwater represent three critical, interconnected pathways that facilitate the transport of CECs into the environment. Quantitative data and advanced methodological protocols, such as those from national stormwater studies and WBE, are essential for characterizing the complex nature of these contaminant mixtures. Understanding these primary sources and environmental pathways is foundational to the broader thesis of environmental exposure, enabling the development of targeted monitoring strategies, accurate ecological risk assessments, and effective remediation technologies to safeguard ecosystem integrity and public health. Future research must focus on the long-term ecological impacts of these complex mixtures and the development of standardized, actionable monitoring guidelines [8].
The study of molecular toxicity has evolved to encompass the complex interplay between environmental exposures and the human genome. A growing body of evidence indicates that environmental contaminants of emerging concern can induce toxicity through mechanisms that extend beyond direct genetic damage to include profound epigenetic alterations and gene-environment interactions (GEI). These mechanisms explain how exposures can reprogram gene expression and biological pathways without altering the underlying DNA sequence, with significant implications for disease etiology and public health [16] [17].
This technical guide examines the molecular mechanisms through which environmental toxicants induce epigenetic changes and how genetic background modulates individual susceptibility. Within the broader context of environmental exposure research, understanding these mechanisms is critical for developing biomarkers of effect, advancing precision environmental health, and designing targeted therapeutic interventions against toxicant-associated diseases [18] [19].
Epigenetic Alterations Induced by Environmental Toxicants
Epigenetic mechanisms represent a crucial interface between environmental exposures and gene expression. The major classes of epigenetic modifications include DNA methylation, histone modifications, and non-coding RNA expression, all of which can be perturbed by various environmental toxicants [16].
DNA Methylation Changes
DNA methylation involves the addition of methyl groups to cytosine bases in CpG dinucleotides, primarily mediated by DNA methyltransferases (DNMTs). This modification typically leads to transcriptional repression when it occurs in promoter regions. Environmental toxicants can disrupt normal DNA methylation patterns through several mechanisms:
- Altered methyl donor availability: The universal methyl donor S-adenosylmethionine (SAM) is required for all methylation reactions. SAM synthesis depends on one-carbon metabolism, which requires nutrients including folate, methionine, and serine. Environmental toxicants can disrupt this metabolic pathway, thereby affecting SAM availability and global DNA methylation patterns [20].
- Inhibition of demethylation enzymes: Ten-eleven translocation (TET) enzymes catalyze DNA demethylation. Certain environmental pollutants can inhibit TET activity, leading to hypermethylation of specific genomic regions [20].
- Direct modulation of DNMT expression: Studies have shown that phthalates and other environmental toxicants can directly alter the expression of DNMTs, leading to widespread changes in DNA methylation [16].
Phthalate exposure has been linked to organ-specific epigenetic changes in hormone-related genes, which associate with neurodevelopmental disorders, infertility, and metabolic diseases [16]. Strikingly, evidence from animal models supports the potential for transgenerational inheritance of these epigenetic changes, suggesting that toxicant-induced epigenetic alterations may persist across multiple generations [16].
Histone Modifications
Histone modifications constitute another major epigenetic mechanism vulnerable to environmental disruption. These post-translational modifications include acetylation, methylation, phosphorylation, and ubiquitination of histone tails, which collectively regulate chromatin structure and gene accessibility.
The balance of histone acetylation is maintained by histone acetyltransferases (HATs) and histone deacetylases (HDACs). This balance is particularly susceptible to metabolic disruptions because acetyl-CoA, the substrate for acetylation, is a central metabolite [20]. In cancer cells, metabolic reprogramming often increases acetyl-CoA production through various pathways, including:
- Fatty acid oxidation producing mitochondrial acetyl-CoA
- ACLY-mediated conversion of citrate to cytosolic acetyl-CoA
- ACSS2-mediated synthesis of acetyl-CoA from acetate during metabolic stress [20]
Environmental toxicants can mimic this effect by disrupting normal metabolic pathways, leading to altered histone acetylation patterns. Furthermore, histone methylation depends on SAM availability, creating another pathway through which toxicants can influence the epigenetic landscape [20].
Non-Coding RNA Regulation
Non-coding RNAs, particularly microRNAs (miRNAs) and long non-coding RNAs (lncRNAs), have emerged as important mediators of toxicant-induced epigenetic changes. These molecules can regulate gene expression post-transcriptionally and can themselves be regulated by epigenetic mechanisms.
Specific miRNAs, including miR-21, miR-155, and several lncRNAs, have been identified as intermediaries between environmental exposures and epigenetic remodeling [21]. Phthalate exposure has been shown to induce abnormal noncoding RNA expression patterns that contribute to its toxic effects [16].
Table 1: Environmental Toxicants and Their Epigenetic Targets
| Toxicant Class | Specific Examples | Primary Epigenetic Effects | Associated Health Outcomes |
|---|---|---|---|
| Phthalates | DEHP, DBP, DEP | Altered DNA methylation of hormone-related genes; histone modifications; miRNA dysregulation | ADHD, infertility, metabolic disorders [16] |
| Heavy Metals | Uranium, Arsenic, Mercury | DNA methylation changes; altered histone acetylation; miRNA expression | Autoimmune disorders, neurodevelopmental issues [19] [21] |
| Per- and Polyfluoroalkyl Substances (PFAS) | PFOA, PFOS | Immunotoxicity through epigenetic mechanisms; altered DNA methylation | Immune suppression, inflammatory diseases [19] |
| Airborne Particulates | PM2.5, PM10 | DNA methylation shifts; histone modifications; chromatin accessibility changes | Respiratory inflammation, cardiovascular disease [21] |
Gene-Environment Interactions in Toxicology
Gene-environment interactions occur when the effect of environmental exposure on disease risk differs based on an individual's genetic makeup. The statistical definition of GEI exists on both additive and multiplicative scales, but the biological reality is far more complex [18].
Fundamental Concepts and Models
The traditional model of GEI can be represented mathematically as:
P = G + E + G×E
Where P represents the phenotype, G represents genetic factors, E represents environmental exposures, and G×E represents their interaction. However, contemporary understanding recognizes that this simplified model fails to capture the dynamic nature of these interactions across the lifespan and their dependence on developmental timing [18].
The concept of "window of opportunity" emphasizes that the timing of exposure to environmental agents is critical in determining health outcomes. Exposures during sensitive developmental periods, such as prenatal or early childhood stages, may have more profound and lasting effects than exposures during adulthood [17].
Biological Mechanisms Underlying GEI
Several biological processes mediate gene-environment interactions in toxicology:
- Xenobiotic Metabolism: Genetic polymorphisms in metabolic enzymes (e.g., cytochrome P450 family, glutathione S-transferases) can significantly alter an individual's capacity to detoxify environmental chemicals, leading to differential susceptibility [22] [18].
- Cellular Distribution and Transport: Transporters determine the localization, accumulation, and elimination of toxicants from body compartments. Genetic variations in these transporters can dramatically affect tissue concentrations of chemicals and their toxicologically effective concentrations at target sites [22].
- Cellular Resilience and Repair Mechanisms: Cells have evolved elaborate mechanisms to compensate, buffer, and repair damage. Genetic differences in these resilience pathways can determine why some individuals remain healthy despite exposure while others develop disease [22].
- Target Molecular Interactions: Genetic variations can alter the affinity between toxicants and their molecular targets, potentially leading to differential activation of adverse outcome pathways (AOPs) [22].
Table 2: Documented Gene-Environment Interactions in Human Health
| Gene | Environmental Exposure | Health Outcome | Molecular Mechanism |
|---|---|---|---|
| BRCA1-Associated Protein (BAP1) | Asbestos | Mesothelioma | Impaired DNA repair and cellular response to asbestos fibers [18] |
| Chromodomain Helicase DNA-Binding Protein 8 (CHD8) | Pesticides | Autism Spectrum Disorder | Disrupted chromatin remodeling and gene expression in neurodevelopment [18] |
| Fat Mass and Obesity-Associated (FTO) | Physical Activity | Obesity | Altered energy homeostasis and metabolic programming [18] |
| Dopamine Receptor D4 (DRD4) | Parenting Style | ADHD | Modified neurodevelopmental trajectory and behavioral regulation [18] |
| Paraoxonase 1 (PON1) | Organophosphorous Pesticides | Neurological Symptoms | Differential detoxification capacity due to enzyme polymorphisms [23] |
Integrated Molecular Pathways
Environmental toxicants can activate conserved molecular pathways that interface with both epigenetic machinery and immune function, creating a complex network of interactions that ultimately determine toxicological outcomes.
Shared Signaling Pathways in Toxicant Response
Multiple classes of environmental pollutants converge on common signaling pathways that mediate their toxic effects:
- Toll-like Receptor (TLR)-NF-κB Signaling: Various environmental toxicants can activate TLR signaling, leading to NF-κB activation and subsequent inflammatory responses. This pathway can induce epigenetic changes by recruiting chromatin-modifying enzymes to inflammatory gene promoters [21].
- NLRP3 Inflammasome Activation: The NLRP3 inflammasome serves as a sensor for environmental stressors and can be activated by multiple toxicants. Inflammasome activation leads to caspase-1-mediated cytokine maturation and inflammation, with associated epigenetic changes [21].
- Reactive Oxygen Species (ROS) Pathways: Many environmental toxicants induce oxidative stress by generating ROS. ROS can function as signaling molecules that modulate the activity of epigenetic enzymes, including HDACs, HATs, and TET proteins [21].
The following diagram illustrates the integrated signaling pathways through which environmental pollutants exert immune-epigenetic effects:
Metabolic-Epigenetic Interplay in Toxicity
Cellular metabolism is intricately connected to epigenetic regulation, as many epigenetic modifications depend on metabolic cofactors. This relationship creates a mechanism through which environmental toxicants that disrupt metabolism can subsequently alter the epigenome:
- SAM-Dependent Methylation: The ratio of SAM to SAH (S-adenosylhomocysteine) regulates the activity of DNMTs and HMTs. Toxicants that affect one-carbon metabolism can shift this ratio and globally alter methylation patterns [20].
- Acetyl-CoA-Mediated Acetylation: Nuclear acetyl-CoA levels directly influence histone acetylation. Toxicants that disrupt mitochondrial function or energy metabolism can alter acetyl-CoA production and consequently affect histone acetylation [20].
- NAD+-Dependent Deacetylation: The NAD+-dependent sirtuin family of deacetylases links cellular energy status to epigenetic regulation. Environmental toxicants that affect NAD+ levels can influence sirtuin activity and gene expression patterns [20].
The integrated relationship between metabolic disruption and epigenetic changes in environmental toxicology can be visualized as follows:
Experimental Approaches and Methodologies
Research on epigenetic alterations and gene-environment interactions requires sophisticated methodological approaches that span multiple technological domains.
Assessing Epigenetic Modifications
Comprehensive evaluation of toxicant-induced epigenetic changes involves multiple complementary techniques:
DNA Methylation Analysis:
- Bisulfite Sequencing: The gold standard for DNA methylation analysis at single-base resolution. Treatment with bisulfite converts unmethylated cytosines to uracils, while methylated cytosines remain unchanged, allowing for precise mapping of methylation patterns.
- EPIC BeadChip Arrays: Provide a cost-effective method for profiling methylation at over 850,000 CpG sites throughout the genome, suitable for large epidemiological studies.
- Whole-Genome Bisulfite Sequencing: Offers comprehensive methylation mapping across the entire genome, including non-CpG and repetitive regions.
Histone Modification Profiling:
- Chromatin Immunoprecipitation Sequencing (ChIP-seq): Utilizes antibodies specific to histone modifications (e.g., H3K27ac, H3K4me3, H3K27me3) to pull down associated DNA fragments, which are then sequenced to map the genomic distribution of these marks.
- Mass Spectrometry-Based Proteomics: Enables quantitative analysis of histone modifications without antibody bias.
Non-Coding RNA Analysis:
- Small RNA Sequencing: Identifies and quantifies miRNA expression changes in response to environmental exposures.
- lncRNA Microarrays and RNA-seq: Profile expression of long non-coding RNAs associated with toxicant exposure.
GEI Study Designs
Different study designs are employed to investigate gene-environment interactions:
- Candidate Gene Studies: Focus on pre-specified genes with known biological relevance to the exposure or disease. These studies have higher statistical power for the specific variants tested but are limited by prior knowledge.
- Genome-Wide Interaction Studies (GWIS): Test for interactions across the entire genome without prior hypothesis. While comprehensive, these studies require large sample sizes to achieve sufficient statistical power.
- Family-Based Designs: Utilize twin studies or family trios to control for genetic background and shared environment.
- Case-Only Studies: Estimate GEI by examining the correlation between genetic variants and environmental exposures among cases only. This design provides improved statistical power but requires the assumption that genes and environment are independent in the population.
Table 3: Methodologies for Assessing Biomarkers in Environmental Health
| Biomarker Category | Specific Methods | Applications in Environmental Toxicology | Technical Considerations |
|---|---|---|---|
| Exposure Biomarkers | Mass spectrometry (targeted and untargeted), HPLC, GC-MS | Quantification of specific chemical residues and metabolites in biological matrices [24] | Requires validation of analytical performance; must consider kinetics of biomarkers |
| Effect Biomarkers | Cytogenetic assays (micronuclei, chromosome aberrations), oxidative stress markers, omics technologies | Detection of quantifiable changes in biochemical/physiologic parameters [24] | Multi-omics approaches allow comprehensive assessment but require sophisticated bioinformatics |
| Susceptibility Biomarkers | Genotyping of polymorphic variants, metabolic phenotyping | Identification of intrinsic susceptibility to adverse effects of exposure [24] | Genetic polymorphisms must have functional significance to be meaningful |
| Epigenetic Biomarkers | Bisulfite sequencing, ChIP-seq, miRNA profiling | Assessment of DNA methylation, histone modifications, non-coding RNA expression [16] [21] | Tissue-specificity and cellular heterogeneity must be considered in interpretation |
The Scientist's Toolkit: Research Reagent Solutions
Advanced research on molecular mechanisms of toxicity requires specialized reagents and tools designed specifically for investigating epigenetic alterations and gene-environment interactions.
Table 4: Essential Research Reagents for Toxicity Mechanisms Research
| Research Tool Category | Specific Examples | Primary Applications | Technical Function |
|---|---|---|---|
| Epigenetic Enzyme Assays | DNMT Activity Assays, HDAC/HAT Activity Kits, HMT Inhibitor Screening | Quantifying changes in epigenetic enzyme activity following toxicant exposure [16] [20] | Measures catalytic function using colorimetric, fluorometric, or radioisotopic methods |
| Methylation Detection Reagents | Bisulfite Conversion Kits, Methylated DNA Standards, Methylation-Sensitive Restriction Enzymes | DNA methylation analysis at specific loci or genome-wide [16] | Chemical or enzymatic conversion of DNA for methylation status determination |
| Chromatin Analysis Tools | ChIP-Validated Antibodies, Chromatin Accessibility Assays, Histone Modification Panels | Histone modification profiling and chromatin structure analysis [21] | Specific binding to epigenetic marks or assessment of nucleosome positioning |
| Gene Expression Profiling | miRNA Inhibition/ Mimic Systems, lncRNA Functional Assays, Pathway-Specific Reporter Constructs | Functional studies of non-coding RNAs in toxicant response [21] | Modulation of specific RNA molecules to determine functional consequences |
| Metabolic Epigenetic Probes | SAM/SAH Measurement Kits, Acetyl-CoA Quantitation Assays, NAD+ Detection Systems | Linking metabolic changes to epigenetic alterations [20] | Quantitative measurement of metabolic cofactors that influence epigenetic regulation |
| GEI Analysis Resources | GWIS Analysis Software, Genotyping Arrays, Exposure Assessment Platforms | Statistical analysis of gene-environment interactions [18] | Computational tools and genomic resources for interaction studies |
The investigation of epigenetic alterations and gene-environment interactions has fundamentally transformed our understanding of molecular toxicity mechanisms. Environmental toxicants can exert lasting biological effects through epigenetic reprogramming that influences gene expression patterns without altering DNA sequences. These effects are further modulated by individual genetic background through complex gene-environment interactions that determine susceptibility.
The integration of multi-omics approaches with advanced computational methods has created unprecedented opportunities to decipher these complex relationships. Future research directions should focus on developing temporally-resolved exposure assessments, expanding multi-ethnic GEI studies, and advancing epigenetic editing technologies for functional validation of findings.
Understanding these molecular mechanisms is essential for advancing precision environmental health, developing targeted intervention strategies, and informing evidence-based regulatory decisions to protect vulnerable populations from environmental toxicants. The continued elucidation of these complex interactions will ultimately enable more personalized approaches to environmental health protection and disease prevention.
Contaminants of Emerging Concern (CECs) represent a diverse group of chemical and biological substances not commonly monitored or regulated in the environment, yet possessing potential for adverse ecological and human health effects. The scope of these contaminants is vast, with approximately 350,000 chemical substances in use that may enter the environment, while less than 1% are currently regulated by international conventions and environmental standards [25]. This regulatory gap represents a critical public health challenge, as global environmental pollution from all contaminants is estimated to cause approximately 9 million premature human deaths annually, with toxic chemical exposure contributing to over 1.8 million of these deaths [25].
This whitepaper synthesizes current epidemiological and experimental evidence linking CEC exposure to chronic disease outcomes, focusing on the biological mechanisms, advanced methodological approaches, and public health implications within environmental health research. We examine several prominent CEC classes including per- and polyfluoroalkyl substances (PFAS), pharmaceuticals and personal care products (PPCPs), micro- and nano-plastics (MNPs), and endocrine-disrupting chemicals (EDCs) [26]. Understanding the exposure pathways and health effects of these substances is essential for developing evidence-based public health interventions and regulatory policies.
Major CEC Classes and Exposure Pathways
Definition and Classification of CECs
The term "contaminants of emerging concern" refers to a heterogeneous group of synthetic or naturally occurring chemicals or microorganisms that are not commonly monitored in the environment but have the potential to cause known or suspected adverse ecological and/or health effects [26]. According to the Interstate Technology & Regulatory Council (ITRC), CECs are formally defined as "substances and microorganisms including physical, chemical, biological, or radiological materials known or anticipated in the environment, that may pose newly identified risks to human health or the environment" [27].
CECs encompass several broad categories:
- Pharmaceuticals and Personal Care Products (PPCPs): Including antidepressants, blood pressure medications, over-the-counter drugs like ibuprofen, bactericides like triclosan, sunscreens, antifungal agents, and hormones [26].
- Per- and Polyfluoroalkyl Substances (PFAS): Synthetic compounds known as "forever chemicals" due to their environmental persistence [26] [28].
- Micro- and Nano-plastics (MNPs): Plastic fragments smaller than 5 mm (microplastics) and particles ranging between 1-1000 nm (nanoplastics) [26].
- Endocrine-Disrupting Chemicals (EDCs): Compounds that alter the normal functions of hormones [3].
- Biological Contaminants: Including viruses, pathogenic bacteria, protozoa, and antibiotic resistance genes [25].
Environmental Prevalence and Human Exposure Pathways
CECs enter the environment through multiple pathways, with wastewater treatment plants (WWTPs) being a primary conduit for surface water contamination [29]. It is estimated there are over 900 streams in the US composed of at least 50% effluent, a phenomenon extending beyond arid to temperate regions due to increased urbanization and climate change [29].
Table 1: Primary Exposure Pathways for Major CEC Classes
| CEC Category | Environmental Sources | Primary Human Exposure Routes | Environmental Persistence |
|---|---|---|---|
| PFAS | Industrial sites, firefighting foam, consumer products | Drinking water, food packaging, dust | Extremely high ("forever chemicals") |
| PPCPs | Wastewater effluent, agricultural runoff | Drinking water, food products | Variable; some highly persistent |
| Microplastics | Plastic waste degradation, personal care products | Seafood, drinking water, air inhalation | High; slow degradation |
| EDCs | Plasticizers, pesticides, industrial chemicals | Food, water, consumer products | Variable; some highly persistent |
The pervasive nature of CECs is demonstrated by their detection in virtually all environmental matrices, from deep ocean trenches to mountain peaks, and in biological samples from plants, animals, and humans [25]. For instance, microplastics have been found in various human organs, including the brain, placenta, liver, kidneys, lungs, and blood [25].
Epidemiological Evidence Linking CECs to Chronic Diseases
Developmental and Reproductive Health Effects
Strong epidemiological evidence connects CEC exposure with adverse developmental and reproductive outcomes. A pioneering study from the University of Rochester Medical Center (URMC) tracked 200 mother-baby pairs, measuring PFAS compounds in maternal blood during pregnancy and profiling infants' T-cell populations at birth, six months, and one year [30]. The findings revealed that by age 12 months, infants with higher prenatal PFAS exposure exhibited:
- Significantly fewer T follicular helper (Tfh) cells - vital for helping B cells produce strong, long-lasting antibodies
- Disproportionately more Th2, Th1, and regulatory T cells (Tregs)
- Immune profiles linked to allergies, autoimmunity, or immune suppression when out of balance [30]
This research provides the first evidence identifying changes in specific immune cells during development due to PFAS exposure, opening possibilities for early monitoring or mitigation strategies to prevent lifelong diseases [30].
The CLEAR research center in Detroit focuses on volatile organic compounds (VOCs) as urban CECs, investigating their role in adverse birth outcomes. Detroit has the highest preterm birth rate in the country (15.2%), and researchers hypothesize that VOC exposure through vapor intrusion during early life incites inflammatory responses that reprogram developing immune systems, setting the stage for preterm birth and associated adverse health outcomes [31].
Neurodevelopmental and Behavioral Effects
Emerging evidence indicates concerning neurodevelopmental impacts from CEC exposure, with potential male-bias in vulnerability. University of Rochester research on PFHxA (a short-chain PFAS previously thought to be less harmful) found that early life exposure in male mice resulted in:
- Increased anxiety-related behaviors
- Memory deficits
- Decreased activity levels [30]
Researchers noted that finding behavioral effects only in males was reminiscent of the male-biased prevalence in many neurodevelopmental disorders such as autism and ADHD, suggesting the male brain might be more vulnerable to environmental insults during neurodevelopment [30].
Immune Dysregulation and Allergic Diseases
CEC exposure appears to contribute to the disproportionate burden of allergic diseases in urban populations. URMC researchers discovered a previously uncharacterized subset of pro-allergic T helper 2 (Th2) cells with distinct molecular characteristics that are more frequently found in urban infants who later developed allergies [30]. The comparative analysis revealed:
- Urban infants had higher levels of aggressive pro-allergic Th2 cells
- Old Order Mennonite (rural) infants had more regulatory T cells that help maintain immune balance
- The farming environment, rich in microbial exposure, appears to support a more tolerant immune system [30]
This suggests that CECs and other environmental factors in urban settings may promote immune cells primed for allergic inflammation, providing new insight into why urban children are more prone to allergies than children from rural areas [30].
Carcinogenic and Metabolic Effects
Epidemiological evidence continues to accumulate regarding the carcinogenic potential of certain CEC classes. Long-term, low-dose exposure to PFAS has been linked to:
- Increased risk of breast cancer
- Reproductive dysfunction
- Birth defects
- Metabolic diseases [25]
Notably, the adverse health effects of many CECs often emerge after prolonged latency periods. For example, lung cancer resulting from exposure to polycyclic aromatic hydrocarbons may take 10 to 30 years to manifest, equivalent to delaying the onset of population-level disease burdens by approximately two decades [25].
Table 2: Chronic Disease Outcomes Associated with CEC Exposure
| CEC Category | Associated Health Outcomes | Strength of Evidence | Vulnerable Populations |
|---|---|---|---|
| PFAS | Immune dysfunction, thyroid disease, kidney/testicular cancer, elevated cholesterol | Strong human epidemiological evidence | Developing fetus, children |
| PPCPs | Antibiotic resistance, endocrine disruption, developmental reproductive effects | Growing evidence; mixture effects concerning | Aquatic organisms; human evidence emerging |
| Plasticizers (e.g., BPA, phthalates) | Developmental effects, reduced fertility, insulin resistance | Strong experimental; human evidence growing | Pregnant women, infants |
| Microplastics | Oxidative stress, inflammation, cellular damage | Emerging evidence; mechanism plausible | General population |
Methodological Approaches in CEC Research
Advanced Biomarker Development
Innovative biomarker approaches are essential for establishing connections between CEC exposure and health outcomes. The FDA-NIH Joint Leadership Council BEST (Biomarkers, EndpointS, and other Tools) Resource defines a biomarker as a "characteristic that is measured as an indicator of normal biological processes, pathogenic processes, or biological responses to an exposure or intervention" [32]. The historical development of biomarker science dates back to Dr. Herbert Needleman's pioneering work in the 1960s-70s using lead in teeth as a biomarker for lead neurotoxicity in children [32].
Modern approaches include:
- Non-invasive matrices: Placenta, cord blood, umbilical cord, hair, urine, saliva, vernix, and meconium for measuring fetal/neonatal biomarkers [32]
- Exhaled breath analysis: Emerging as a promising matrix for detecting and monitoring chemical exposures [32]
- Cell-free fetal DNA: Present in maternal blood as early as 10 weeks of pregnancy, used to detect chromosomal anomalies and expanding to environmental exposure assessment [32]
The biomarker development pathway requires rigorous validation, including demonstration of biological plausibility, analytical validation, and clinical validation for each intended use [32].
Transcriptomic and Systems Biology Approaches
Advanced molecular techniques are revealing subtle but significant health impacts of CEC exposure. An in-situ study on fathead minnows (Pimephales promelas) exposed to WWTP effluent revealed significant neurobiological effects through RNA-sequencing analysis of brain tissues [29]. The experimental protocol included:
- Caged-fish exposure: Fish were deployed in modified mesh minnow traps above and below a WWTP effluent outfall for a 4-day (96 h) exposure during baseflow conditions [29]
- RNA-sequencing: Conducted on brain tissues to assess transcriptomic changes [29]
- Water sampling: Analyzed for 14 pharmaceuticals and pharmaceutical degradates, with one sample analyzed for 113 pharmaceuticals/degradates and other CECs [29]
The results demonstrated 280 gene isoforms significantly differentially expressed in male fish and 293 gene isoforms in female fish between upstream and downstream sites, with only 13% overlap between sexes, indicating sex-dependent impacts on neuronal gene expression [29]. This systems biology approach, paired with functional enrichment analyses, identified novel gene biomarkers for effluent exposure that could expand monitoring of environmental effects.
Mixture Toxicity Assessment
A critical methodological challenge in CEC research involves assessing the combined effects of chemical mixtures. Traditional single-compound laboratory exposures may not accurately reflect real-world scenarios where organisms encounter complex mixtures [29]. When comparing transcriptomic results from real-world effluent exposure to those from single-compound studies, there was relatively little overlap in terms of gene-specific effects, bringing into question the application of single-compound exposures in accurately characterizing environmental risks [29].
This complexity is magnified by the dynamic nature of WWTP effluent, where composition fluctuates with patterns of human use and environmental factors that lead to differential attenuation [29]. The environmental risk of these contaminants remains largely undercharacterized, hampering the development of CEC mixture regulations [29].
The Researcher's Toolkit: Methodologies and Reagents
Analytical Methods for CEC Detection
Advanced analytical techniques are required to detect CECs at environmentally relevant concentrations (typically ng/L to μg/L). The most common approaches include:
- Liquid Chromatography-Mass Spectrometry (LC-MS/MS): Central to identification and quantification of polar CECs at trace levels [26] [28]
- Gas Chromatography-Mass Spectrometry (GC-MS): Effective for volatile and semi-volatile compounds [26]
- High-Resolution Mass Spectrometry: Provides accurate mass measurements for identifying unknown compounds [26]
Supplementary methods include enzyme-linked immunosorbent assay (ELISA), polymerase chain reaction (PCR) for biological contaminants, and various biosensors [26]. For microplastics analysis, techniques include visual microscopy, Fourier-transform infrared spectroscopy (FTIR), and Raman spectroscopy, though methodological standardization remains a challenge [25].
Table 3: Essential Research Reagents and Analytical Solutions for CEC Studies
| Research Tool Category | Specific Examples | Primary Application | Technical Considerations |
|---|---|---|---|
| Chromatography Systems | HPLC, UPLC, GC | Separation of complex mixtures | Column selection critical for resolution |
| Mass Spectrometry | LC-MS/MS, GC-MS, HRMS | Identification and quantification | Requires reference standards for quantification |
| Molecular Biology Assays | RNA-seq, PCR, ELISA | Biomarker discovery and validation | Sample quality critical for reliability |
| Bioinformatics Tools | Differential expression analysis, Pathway enrichment (GO, KEGG) | Data analysis and interpretation | Statistical rigor essential |
| Cell-Based Assays | Bioluminescent yeast estrogen screen (BLYES) | Endocrine disruption screening | High-throughput capability |
Experimental Models in CEC Toxicology
Various model systems provide complementary insights into CEC health effects:
- In vitro systems: Cell lines for high-throughput screening of toxicity mechanisms
- In vivo models: Zebrafish (Danio rerio) for developmental toxicity assessment [31], fathead minnows (Pimephales promelas) for aquatic toxicology [29], and mouse models for immune and neurological effects [30] [31]
- Human epidemiological studies: Cohort designs tracking exposure and health outcomes over time [30] [31]
The CLEAR research center exemplifies this integrated approach, combining phytoscreening for VOC detection, sensor technology for real-time monitoring, zebrafish toxicity bioassays, pregnant mouse models, and human epidemiology in an at-risk population [31].
Public Health Implications and Regulatory Challenges
Risk Assessment and Management Gaps
Significant challenges exist in regulating CECs due to scientific and technical barriers:
- Toxicity assessment limitations: Traditional ecotoxicity tests for a single chemical cost approximately USD 118,000 on average, making comprehensive assessment of thousands of chemicals prohibitively expensive and time-consuming [25]
- Analytical limitations: Standardized protocols for detecting and quantifying many CECs are underdeveloped or nonexistent [25]
- Mixture effects: Risk assessment approaches struggle to address combined effects of multiple contaminants [29]
The European Union's REACH regulation addresses this by mandating that chemical substances be registered and assessed, placing the burden of proof for chemical safety on manufacturers and importers [25]. Similarly, the U.S. Toxic Substances Control Act (TSCA) adopts a risk-based regulatory approach [25].
Socioeconomic Burden of CEC Exposure
The economic implications of unregulated CECs are substantial:
- PFAS management is estimated to have a social cost as high as EUR 16 trillion - approximately 4000 times the net annual profit of the global PFAS industry (around USD 4 billion) [25]
- Antibiotic resistance, exacerbated by pharmaceutical CECs, directly and indirectly caused approximately 5 million deaths in 2019, potentially rising to 10 million deaths annually by 2050 [25]
- By 2050, antibiotic resistance could result in a global GDP loss of USD 3.4 trillion annually and push an additional 24 million people into extreme poverty [25]
Epidemiological evidence increasingly links CEC exposure to various chronic diseases, including immune dysfunction, neurodevelopmental disorders, reproductive impairment, and metabolic diseases. The distinctive challenges of CECs—including environmental persistence, ubiquitous distribution, low-dose effects, and complex mixture interactions—necessitate novel approaches to environmental health protection.
Future research priorities should include:
- Advanced monitoring techniques utilizing sensor technology, remote sensing, and citizen science for better exposure assessment
- High-throughput toxicology approaches to efficiently screen priority CECs
- Biomarker development for early detection of exposure and biological effects
- Mixture toxicology research to understand combined effects
- Susceptibility research identifying vulnerable populations and life stages
Addressing the challenges posed by CECs requires transdisciplinary collaboration across scientific fields, regulatory agencies, and public health organizations. Only through integrated approaches can we effectively characterize risks, develop protective policies, and implement mitigation strategies that safeguard both ecosystem and human health across the lifespan.
This whitepaper provides a technical examination of three critical classes of contaminants of emerging concern (CECs) in aquatic environments: per- and polyfluoroalkyl substances (PFAS), pharmaceuticals, and cyanotoxins. With the escalating threat of water pollution globally, understanding the environmental exposure pathways and toxicological effects of these contaminants is paramount for environmental and public health protection. This guide synthesizes current research on the sources, environmental fate, and ecological impacts of these compounds, with a particular emphasis on advanced analytical methodologies, experimental protocols for toxicity assessment, and emerging bioremediation strategies. Designed for researchers, scientists, and drug development professionals, this document serves as a comprehensive resource for navigating the complexities of CEC research and contributes to the broader thesis on predicting and mitigating the environmental effects of emerging contaminants.
Contaminants of emerging concern represent a diverse group of chemical compounds that are now being detected in the environment with potential consequences for ecosystem and human health, but are not yet consistently regulated. Their persistence, bioaccumulative potential, and often unknown chronic toxicity pose significant challenges for risk assessment and water quality management.
The aquatic environment serves as a primary sink for these pollutants, which enter water bodies through multiple pathways including wastewater effluent, agricultural runoff, and industrial discharges [33] [34]. Among CECs, PFAS, pharmaceuticals, and cyanotoxins have garnered significant scientific and regulatory attention due to their unique properties and widespread occurrence. PFAS are characterized by their extreme persistence, earning the nickname "forever chemicals," with thousands of variants existing in commercial use [33] [34]. Pharmaceuticals, designed to be biologically active, can disrupt endocrine and metabolic functions in non-target aquatic organisms at low concentrations. Cyanotoxins, produced during harmful algal blooms (HABs) fueled by eutrophication and climate change, represent natural toxicants with increasing global distribution [35] [36].
Understanding the interplay between these contaminants adds another layer of complexity. Recent research indicates that co-occurring contaminants can interact, potentially altering their toxicity and environmental behavior. For instance, certain PFAS have been shown to influence cyanobacterial blooms and metabolic pathways, demonstrating unanticipated ecological interactions [37]. This guide presents detailed case studies on each contaminant class, providing structured data, experimental protocols, and visual tools to advance research in this critical field.
Contaminant Profiles and Environmental Exposure Pathways
PFAS (Per- and Polyfluoroalkyl Substances)
PFAS are a group of over 4,700 man-made chemicals characterized by fully fluorinated carbon chains that confer exceptional stability and resistance to degradation [34]. Their amphipathic nature, with both hydrophobic and lipophobic properties, makes them highly effective in numerous industrial and consumer applications.
Primary Sources and Exposure Pathways: PFAS enter aquatic systems through multiple vectors, including firefighting foam (AFFF), industrial discharges from manufacturing facilities, landfill leachate, and wastewater treatment plant effluent [33]. Due to their high mobility and persistence, they contaminate groundwater and surface water, leading to human exposure primarily through contaminated drinking water and food, particularly fish from contaminated waters [33] [34].
Key Compounds: The most extensively studied PFAS compounds are perfluorooctanoic acid (PFOA) and perfluorooctane sulfonate (PFOS), which are now considered "legacy" PFAS. While their production has been phased out in many regions, they remain environmentally persistent and have been largely replaced by shorter-chain alternatives (e.g., GenX) with similar concerns regarding mobility and persistence [33] [34].
Table 1: Characteristic Profiles of Major PFAS Compounds
| PFAS Compound | Chain Length | Primary Use | Key Property |
|---|---|---|---|
| PFOA | C8 | Non-stick coatings, waterproofing | Persistent, bioaccumulative |
| PFOS | C8 | Fire-fighting foam, stain repellents | Persistent, bioaccumulative |
| PFBS | C4 | Replacement for PFOS | Highly mobile in water |
| GenX | C6 | Industrial processing | Persistent, mobile |
Cyanotoxins
Cyanotoxins are toxic secondary metabolites produced by various species of cyanobacteria during Harmful Algal Blooms (HABs). Their occurrence is increasing globally due to eutrophication and climate change, posing significant threats to aquatic ecosystems and human health [35] [36].
Primary Sources and Exposure Pathways: Cyanotoxins originate from bloom-forming cyanobacteria such as Microcystis, Dolichospermum, and Planktothrix in eutrophic freshwater systems [35] [36]. Human exposure occurs primarily through recreational water contact, consumption of contaminated drinking water or fish, and accidental ingestion of water during swimming.
Key Toxin Classes: The major cyanotoxin classes include:
- Microcystins (MCs): Hepatotoxic cyclic peptides with over 200 variants (e.g., MC-LR, MC-RR, MC-YR); MC-LR is the most toxic and well-studied [35].
- Cylindrospermopsins (CYN): Alkaloid hepatotoxins that inhibit protein synthesis.
- Anatoxins (ATXs): Alkaloid neurotoxins, with ATX-a being the most significant congener [35].
Table 2: Major Cyanotoxin Classes and Their Characteristics
| Cyanotoxin Class | Toxic Mechanism | Primary Producers | Key Variants |
|---|---|---|---|
| Microcystins | Hepatotoxicity, protein phosphatase inhibition | Microcystis, Planktothrix | MC-LR, MC-RR, MC-YR |
| Cylindrospermopsins | Hepatotoxicity, protein synthesis inhibition | Cylindrospermopsis, Dolichospermum | CYN |
| Anatoxins | Neurotoxicity, acetylcholine mimicry | Dolichospermum, Tychonema | ATX-a, dhATX |
Environmental Exposure Framework
The transport and fate of CECs in aquatic systems follow complex pathways influenced by chemical properties, environmental conditions, and anthropogenic factors. Exposure pathways begin with contaminant release and involve transport through multiple environmental media before reaching human and ecological receptors [38]. Critical exposure routes for aquatic contaminants include:
- Ingestion: Consumption of contaminated drinking water or aquatic food sources
- Dermal Contact: Direct skin exposure during recreational activities
- Inhalation: Aerosolized contaminants from water surfaces
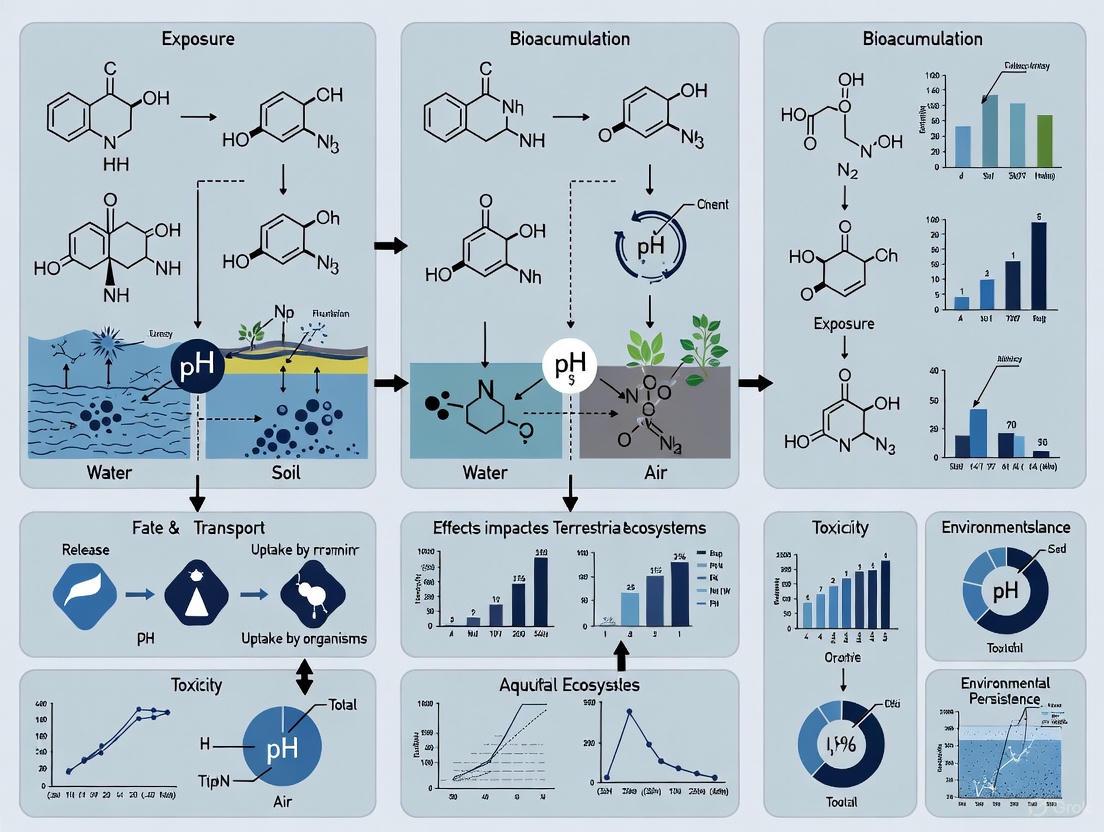
The diagram below illustrates the complex pathways and interrelationships between different environmental compartments for CECs.
Quantitative Data on Occurrence and Risk
Cyanotoxin Occurrence in Six Chinese Lakes
A 2022 study investigating six eutrophic lakes across China revealed widespread cyanotoxin contamination with significant spatial heterogeneity linked to environmental conditions [35].
Table 3: Cyanotoxin Occurrence and Environmental Factors in Six Chinese Lakes (Summer 2022)
| Lake Name | Region | MC Concentration (μg/L) | Dominant MC Variant | Key Environmental Factors |
|---|---|---|---|---|
| Taihu Lake | Eastern Plain | 0.45 (avg) | MC-LR | High water temperature (33.01°C), high TP |
| Dianchi Lake | Yunnan-Guizhou Plateau | 0.92 (avg) | MC-RR | High NH₄-N, high Chl-a |
| Chaohu Lake | Eastern Plain | 0.21 (avg) | MC-LR | Moderate TN, TP |
| Hulun Lake | Inner Mongolia | 0.08 (avg) | MC-LR | Low water temperature (22.41°C), high DO, high TN |
| Xingyun Lake | Yunnan-Guizhou Plateau | 0.35 (avg) | MC-RR | High pH, high TP |
| Wuliangsuhai Lake | Inner Mongolia | 0.11 (avg) | MC-LR | Grass-algae lake type, moderate nutrients |
The study demonstrated that microcystins were prevalent across all surveyed lakes, with concentrations varying significantly based on geographic location and hydrological conditions [35]. Total phosphorus (TP) and water temperature (WT) were identified as critical factors influencing cyanotoxin production, with warmer temperatures and higher nutrient levels generally correlating with increased MC concentrations [35].
PFAS and Cyanotoxin Risk Assessment Values
Regulatory agencies and scientific studies have established various guideline values for CECs based on toxicological assessments.
Table 4: Human Health Risk Assessment Values for Selected Contaminants
| Contaminant | Health Effect | Risk Value | Basis |
|---|---|---|---|
| PFOA | Kidney/testicular cancer | -- | EPA: Increased risk evidence [33] [39] |
| PFOS | Increased cholesterol | -- | ATSDR: Consistent association [39] |
| MC-LR | Hepatotoxicity | 1.0 μg/L (WHO drinking water guideline) | WHO provisional value [36] |
| PFOS | Reduced antibody response | -- | ATSDR: Epidemiological evidence [39] |
| PFOA | Pregnancy-induced hypertension | -- | CDC/ATSDR: Association observed [39] |
Experimental Protocols and Methodologies
Protocol: Assessing PFAS Effects on Cyanobacterial Metabolomics
This protocol, adapted from Liao et al. (2025), examines the impact of single PFOS versus mixed PFAS exposure on Microcystis aeruginosa using metabolomic profiling [37].
Experimental Workflow
The diagram below outlines the key stages of the experimental workflow for assessing PFAS effects on cyanobacteria.
Detailed Methodology
Cyanobacteria Culture and Maintenance:
- Obtain Microcystis aeruginosa from a certified culture collection (e.g., Freshwater Algae Culture Collection at the Institute of Hydrobiology, Chinese Academy of Sciences).
- Maintain in BG11 medium at pH 7.4, 25°C, with 2200 lux light intensity under a 12:12 light:dark cycle.
- Use cells in the exponential growth phase for all experiments to ensure metabolic consistency.
Exposure Experiment Design:
- Prepare three exposure scenarios:
- Control: BG11 medium only
- PFOS exposure: BG11 with perfluorooctane sulfonic acid (0.5 mg/L)
- PFAS mixture: BG11 with multiple PFAS compounds at environmentally relevant concentrations
- Culture algae in continuous or batch systems with continuous bubbling of air with 5% CO₂ (v/v) to ensure non-limiting carbon supply.
- Maintain constant light intensity at 150 μmol photons m⁻² s⁻¹ using full-spectrum LED lamps.
- Monitor pH daily using a calibrated pH meter (e.g., HI 9124 pH meter).
- Prepare three exposure scenarios:
Physiological Parameter Assessments:
- Algal Density: Measure daily using optical density at 680 nm or cell counting with a hemocytometer.
- Chlorophyll-a Content: Extract with methanol and measure fluorescence or spectrophotometrically.
- Photochemical Efficiency (Fv/Fm): Determine using a pulse-amplitude modulation (PAM) fluorometer after dark adaptation.
- Oxidative Stress Markers: Measure malondialdehyde (MDA) content as a lipid peroxidation indicator via thiobarbituric acid reactive substances (TBARS) assay.
- Microcystin Production: Quantify intracellular and extracellular microcystins using ELISA or LC-MS/MS.
Metabolomic Profiling:
- Sample Preparation: Harvest cells by centrifugation at 5,000 × g for 10 min. Quench metabolism immediately using liquid nitrogen.
- Metabolite Extraction: Use 80% methanol with repeated freeze-thaw cycles. Concentrate extracts using a speed vacuum concentrator.
- LC-MS Analysis: Perform untargeted metabolomics using UHPLC-Q-TOF-MS with both positive and negative ionization modes.
- Data Processing: Use software (e.g., XCMS, MS-DIAL) for peak picking, alignment, and annotation against databases (e.g., HMDB, KEGG).
- Pathway Analysis: Identify significantly altered metabolic pathways using pathway enrichment analysis and pathway impact values.
Key Findings from Original Study
The study revealed that PFOS exposure inhibited algal growth and photosynthetic capacity, accompanied by elevated peroxidation levels and increased microcystin synthesis. In contrast, combined PFAS exposure enhanced both algal growth and photosynthetic efficiency. Metabolic profiling indicated that PFOS's inhibitory effects were potentially due to the disruption of purine/pyrimidine metabolism and the TCA cycle, while mixed PFAS stimulated glutathione metabolism and fatty acid biosynthesis, suggesting a hormetic effect [37].
Protocol: Cyanotoxin Monitoring in Lakes
This protocol, based on Yang et al. (2025), details comprehensive sampling and analysis of multiple cyanotoxins across diverse lake systems [35].
Field Sampling Design:
- Select sampling sites to represent different hydrological regions and potential nutrient gradients.
- Collect surface water and sediment samples during peak bloom season (typically summer).
- Record in-situ environmental parameters including water temperature (WT), dissolved oxygen (DO), pH, and chlorophyll-a (Chl-a) at each sampling point.
Sample Collection and Preservation:
- Collect water samples in pre-cleaned amber glass bottles.
- Gather sediment samples using a grab sampler or core sampler.
- Filter water samples through GF/F filters (0.7 μm pore size) immediately after collection.
- Freeze all samples at -20°C until analysis to preserve analyte integrity.
Analytical Methods:
- Nutrient Analysis: Measure total nitrogen (TN), total phosphorus (TP), and phosphate (PO₄-P) using standard colorimetric methods (e.g., automated flow injection analysis).
- Cyanotoxin Extraction:
- Water samples: Solid-phase extraction (SPE) using hydrophilic-lipophilic balance (HLB) cartridges.
- Sediment samples: Accelerated solvent extraction (ASE) or ultrasonic extraction with methanol/water mixtures.
- Cyanotoxin Quantification:
- Use liquid chromatography with tandem mass spectrometry (LC-MS/MS) for multiple cyanotoxins.
- Analyze for major microcystin variants (MC-LR, MC-RR, MC-YR), cylindrospermopsin (CYN), and anatoxins (ATX-a).
- Include quality control samples (blanks, spikes, duplicates) in each batch.
Risk Assessment:
- Calculate risk quotients (RQs) by comparing measured concentrations to toxicity reference values.
- Evaluate spatial patterns in toxin distribution and correlation with environmental parameters using statistical analysis (e.g., principal component analysis, redundancy analysis).
The Scientist's Toolkit: Essential Research Reagents and Materials
Table 5: Key Research Reagents and Equipment for CEC Analysis
| Item | Function/Application | Example Specifications |
|---|---|---|
| BG11 Medium | Cyanobacteria culture and maintenance | Standard recipe with nitrate, phosphate, and micronutrients [37] |
| HLB Solid-Phase Extraction Cartridges | Concentration of cyanotoxins and PFAS from water samples | 200 mg, 6 cc cartridge volume [35] |
| UHPLC-Q-TOF-MS System | Untargeted metabolomic profiling | High-resolution mass accuracy (<5 ppm) [37] |
| LC-MS/MS System | Targeted quantification of cyanotoxins and PFAS | Triple quadrupole with ESI source [35] |
| PAM Fluorometer | Measurement of photosynthetic efficiency | Pulse-amplitude modulation technology [37] |
| Certified Reference Standards | Quantification of target analytes | PFOA, PFOS, MC-LR, CYN, ATX-a [35] [37] |
The complex interplay between PFAS, pharmaceuticals, and cyanotoxins in aquatic systems presents significant challenges for researchers and risk assessors. This technical guide has synthesized current knowledge on the environmental exposure pathways, ecological effects, and advanced methodologies for studying these contaminants of emerging concern. The structured data, experimental protocols, and visualization tools provided herein offer a foundation for advancing research in this critical field. As climate change and anthropogenic activities continue to influence contaminant distribution and transformation, interdisciplinary approaches integrating chemistry, toxicology, and systems biology will be essential for protecting aquatic ecosystem health and human populations dependent on safe water resources. Future research directions should prioritize understanding mixture toxicity, developing advanced remediation strategies, and refining risk assessment frameworks to address the evolving landscape of aquatic contamination.
Advanced Detection and Monitoring: From Laboratory Analysis to Real-Time Sensing
High-Resolution Mass Spectrometry and Chromatography for Trace-Level Analysis
The expanding anthropogenic environmental chemical space, driven by industrial activity and diverse consumer products, has made the comprehensive characterization of environmental samples a significant analytical challenge [40]. Contaminants of emerging concern (CECs), including pharmaceuticals, personal care products, pesticides, and industrial chemicals, represent a growing threat to ecosystems and human health due to their persistence, bioaccumulation potential, and often-unknown toxicological profiles [41]. Addressing these challenges necessitates advanced analytical tools capable of detecting and quantifying trace levels of these compounds in complex environmental matrices such as water, soil, and air [41].
High-resolution mass spectrometry (HRMS) coupled with chromatography has emerged as a powerful tool for tackling this challenge. Its high sensitivity, specificity, and versatility facilitate real-time detection of volatile organic compounds, comprehensive non-targeted screening of unknown contaminants, and accurate quantification in diverse matrices [41]. This technical guide explores the core methodologies, workflows, and applications of these techniques within environmental exposure and effects research, providing researchers with detailed protocols and frameworks for implementing these advanced analytical strategies.
Analytical Techniques and Instrumentation
Chromatographic Separation and Mass Spectrometric Detection
The analysis of trace-level organic micropollutants (OMPs) requires sophisticated separation and detection strategies. Considering the diverse physicochemical characteristics of OMPs, the coupling of both liquid (LC) and gas chromatography (GC) to high-resolution mass spectrometry is often mandatory for comprehensive screening [42].
- Liquid Chromatography-HRMS: Reversed-phase LC is typically employed for semi-polar and polar compounds such as pharmaceuticals, pesticides, and their transformation products. The separation occurs based on hydrophobicity, and the eluent is directly introduced into the mass spectrometer via electrospray ionization (ESI).
- Gas Chromatography-HRMS: GC is ideal for volatile and semi-volatile non-polar compounds, including many legacy pesticides, flame retardants, and other industrial chemicals. Separation is based on volatility and polarity, with the effluent typically ionized by electron ionization (EI) or chemical ionization (CI) before mass analysis.
The mass analyzers of choice are those capable of high-resolution accurate-mass (HRAM) measurements, such as Quadrupole-Time-of-Flight (QTOF) and Orbitrap instruments. These provide exact mass measurements (with mass errors often < 5 ppm), enabling the determination of elemental compositions and the differentiation of isobaric compounds [42] [43]. The "high-resolution" capability refers to the mass spectrometer's ability to distinguish between ions with small mass differences (typically with a resolving power > 20,000), which is crucial for confident identification in complex matrices.
The Scientist's Toolkit: Essential Research Reagent Solutions
Successful trace analysis relies on more than just instrumentation. The following table details key reagents, materials, and software solutions essential for this field.
Table 1: Key Research Reagent Solutions for HRMS-Based Environmental Analysis
| Item | Function | Example Applications |
|---|---|---|
| HRAM Mass Spectrometer (e.g., QTOF, Orbitrap) | Provides accurate mass data for elemental composition determination and structure elucidation; enables non-targeted screening. | Identification of unknown emerging contaminants; wide-scope suspect screening [42] [41] [43]. |
| Ultra-Inert GC Liners/Columns | Minimizes analyte decomposition and irreversible adsorption of active compounds (e.g., pesticides) in the GC flow path. | Trace analysis of chlorinated pesticides like lindane, aldrin, and DDT to achieve symmetric peaks and low detection limits [44]. |
| Ionic Liquids (ILs) (e.g., Imidazolium-based) | Serve as "green" extraction solvents in microextraction techniques due to low volatility, tunable properties, and high thermal stability. | Liquid-phase microextraction of heavy metals, pesticides, pharmaceuticals, and phenols from water samples for preconcentration [45]. |
| Suspect/Target Databases (e.g., NORMAN Suspect List Exchange, US EPA CompTox) | Digital libraries of known or suspected contaminants used for matching HRMS data (mass, fragmentation pattern). | Preliminary identification of compounds in a sample without a reference standard (suspect screening) [40]. |
| Reference Standards | Certified pure compounds used for method development, calibration, and confirmation of identifications based on retention time and fragmentation. | Target quantification and validation of suspect screening results for prioritized contaminants [42]. |
Prioritization Strategies for Non-Target Screening
Non-target screening (NTS) using chromatography-HRMS is a powerful approach for detecting chemicals of emerging concern without prior compound selection [40]. The primary challenge lies in the vast number of analytical features (often thousands per sample) generated, creating a bottleneck at the identification stage. Effective prioritization strategies are therefore essential to focus resources on the most relevant features. An integrated workflow combining seven complementary strategies enables a stepwise reduction from thousands of features to a focused shortlist of high-priority compounds [40].
Table 2: Seven Prioritization Strategies for Non-Target Screening Workflows
| Strategy | Core Principle | Key Techniques/Tools |
|---|---|---|
| 1. Target & Suspect Screening (P1) | Matching features against predefined databases of known or suspected contaminants. | Use of PubChemLite, NORMAN Suspect List Exchange; matching m/z, isotope patterns, RT, MS/MS. |
| 2. Data Quality Filtering (P2) | Removing artifacts and unreliable signals to ensure data integrity. | Filtering based on occurrence in blanks, replicate consistency, peak shape, instrument drift. |
| 3. Chemistry-Driven Prioritization (P3) | Focusing on compound-specific properties to find classes of interest. | Mass defect filtering for PFAS; homologue series detection; diagnostic MS/MS fragments. |
| 4. Process-Driven Prioritization (P4) | Using spatial, temporal, or technical processes to guide selection. | Comparing influent vs. effluent; upstream vs. downstream; correlation with rainfall events. |
| 5. Effect-Directed Prioritization (P5) | Integrating biological response data to target bioactive contaminants. | Effect-Directed Analysis (EDA); Virtual EDA (vEDA) using statistical models (e.g., PLS-DA). |
| 6. Prediction-Based Prioritization (P6) | Using in-silico models to predict risk without full identification. | MS2Quant (predicted concentration); MS2Tox (predicted LC50); Risk Quotient (PEC/PNEC). |
| 7. Pixel/Tile-Based Approaches (P7) | Analyzing raw data regions before peak detection in complex datasets. | Localizing regions of high variance in 2D chromatograms (GC×GC, LC×LC) for further analysis. |
The sequential and synergistic application of these strategies is critical. For instance, an initial suspect list (P1) of 300 compounds can be reduced by data quality filters (P2) and chemical relevance (P3) to 100 features. Process-based (P4) and effect-based (P5) prioritization can then highlight 20 features linked to a specific source or toxicity, with prediction models (P6) finally ranking the top 5 for definitive identification based on potential risk [40].
The following workflow diagram visualizes the logical relationship and integration of these strategies within a comprehensive NTS workflow.
Detailed Experimental Protocols
Protocol: Trace-Level Analysis of Chlorinated Pesticides by GC-MS
The analysis of low-level chlorinated pesticides by GC-MS is challenging due to the adsorptivity and potential decomposition of these compounds in the chromatographic system. The following method outlines a practical and reliable approach [44].
- Instrumentation: Agilent 7890 GC system coupled to an Agilent 5975B Inert Mass Selective Detector (or equivalent single-quadrupole MSD). A 30 m × 0.25 mm, 0.25 µm film thickness DB-5ms Ultra-Inert capillary column is used.
- Sample Preparation: For solid matrices (e.g., soil, fruits, vegetables), a 1 g sample is dried, sieved, and extracted with 5 mL of dichloromethane via 10 minutes of sonication. For liquid matrices like shampoo, a 1 mL sample can be extracted with 10 mL of water to remove surfactants, followed by solvent exchange into 2 mL of dichloromethane.
- Critical GC Conditions:
- Inlet Liner: Ultra-Inert split liner with quartz wool is mandatory to prevent analyte decomposition and adsorption.
- Inlet Temperature: 250°C, operated in splitless mode.
- Carrier Gas: Helium, constant flow mode.
- Oven Temperature Program: Initial 60°C (hold 1 min), ramp to 180°C at 20°C/min, then to 300°C at 10°C/min (hold 5 min).
- Transfer Line Temperature: 280°C.
- MS Detection: Operated in Electron Ionization (EI) mode at 70 eV. Selected Ion Monitoring (SIM) is used for sensitivity. The solvent delay is set to 4 minutes.
- Performance Metrics: This method achieves a limit of detection (LOD) of 5 ppb (w/v) for compounds like lindane, aldrin, and DDT, with a linearity (R²) > 0.999 in the range of 8-320 ppb and reproducibility of <5% RSD (n=10) [44].
Table 3: Retention Times and Target Ions for Chlorinated Pesticides
| Analyte | Retention Time (min) | Target Quantifier Ion (m/z) | Qualifier Ions (m/z) |
|---|---|---|---|
| Lindane | ~10.5 | 181 | 219, 254 |
| Aldrin | ~12.1 | 263 | 265, 293 |
| Heptachlor Epoxide | ~12.8 | 353 | 355, 337 |
| Dieldrin | ~14.5 | 263 | 265, 277 |
| o,p'-DDD | ~15.2 | 235 | 237, 199 |
| p,p'-DDT | ~16.8 | 235 | 237, 165 |
Protocol: Ionic Liquid-Based Liquid-Phase Microextraction (IL-LPME)
Ionic liquids (ILs) are "green" solvents ideal for preconcentrating trace analytes from aqueous samples, enhancing the sensitivity of subsequent LC-MS or GC-MS analysis [45]. The following describes a dispersive liquid-liquid microextraction (DLLME) method.
- Principle: A water-immiscible IL is dispersed into an aqueous sample as fine droplets, creating a large surface area for the rapid extraction of target analytes. The droplets are then collected and analyzed.
- Materials:
- Ionic Liquid: 1-Octyl-3-methylimidazolium hexafluorophosphate ([C₈MIM][PF₆]).
- Disperser Solvent: Acetone or methanol.
- Syringes: 1-mL and 10-mL syringes.
- Procedure:
- Transfer 10 mL of the filtered water sample (e.g., river water, wastewater) into a 15 mL conical glass centrifuge tube.
- Using a syringe, rapidly inject a mixture containing 50 mg of [C₈MIM][PF₆] (extraction solvent) dissolved in 1.0 mL of acetone (disperser solvent) into the sample.
- Gently shake the tube to form a cloudy solution, indicating the dispersion of fine IL droplets throughout the sample.
- Centrifuge the tube at 4000 rpm for 5 minutes to sediment the dense IL phase at the bottom.
- Carefully remove the upper aqueous layer with a pipette.
- Use a micro-syringe to transfer the sedimented IL phase (typically ~30 µL) into a micro-vial for instrumental analysis (e.g., by HPLC-DAD or GC-MS).
- Applications: This method has been successfully applied for the extraction of triazole fungicides, carbamate pesticides, phenols, and heavy metals from environmental water samples, achieving high enrichment factors (EF) of 107–156 and low detection limits in the sub-ppb range [45].
Application in Environmental Research: A Case Study
A study from Pasto, Colombia, effectively demonstrates the application of these techniques in a real-world scenario to assess anthropogenic impact on water quality [42].
- Study Context: Surface water and wastewater samples were collected from the Pasto River, which is impacted by agricultural runoff in its upper basin and untreated domestic wastewater discharge in the urban areas.
- Analytical Methodology: The researchers employed a combined LC- and GC-QTOF MS approach for target and suspect screening, using home-made databases containing over 2000 compounds.
- Findings and Environmental Impact:
- Agricultural Impact: In the upstream sampling point, 15 pesticides (7 insecticides, 6 fungicides, and 2 herbicides) were identified, illustrating the clear impact of agricultural practices. No pharmaceuticals were detected at this site.
- Urban Impact: In the middle and downstream urban sites, 14 pharmaceuticals (including 7 antibiotics and 3 analgesics) were found, revealing the impact of the urban population. The direct discharge of untreated wastewater was the confirmed source.
- Transformation Products: The identification of transformation products like carbofuran-3-hydroxy (a pesticide metabolite) and 4-acetylamino antipyrine (a pharmaceutical metabolite) highlights the capability of HRMS-based NTS to reveal the fate of contaminants in the environment [42].
- Outcome: Based on the screening data, the researchers recommended implementing targeted quantitative LC-MS/MS methods for the most relevant identified compounds for future monitoring, demonstrating how NTS guides focused regulatory and remediation efforts.
High-resolution mass spectrometry coupled with advanced chromatographic techniques provides an unparalleled toolkit for investigating the environmental exposure and effects of contaminants of emerging concern at trace levels. The power of this approach lies not only in the sensitivity and specificity of the instrumentation but also in the development of sophisticated data analysis workflows. As detailed in this guide, integrated prioritization strategies are the key to transforming overwhelming raw data into actionable information for environmental risk assessment.
Despite these advancements, challenges such as matrix interferences, a lack of standardized methodologies, and limited spectral libraries persist [41]. The future of this field points toward greater integration of artificial intelligence (AI) for data processing and predictive modeling, the continued refinement of "green" sample preparation methods like IL-based microextraction [45], and the development of more transparent and scalable workflows to move non-target screening from an exploratory tool toward robust, actionable regulatory support [40]. Continued innovation and collaboration are essential to mitigate the risks posed by the ever-expanding universe of environmental contaminants.
The increasing global contamination of water sources by contaminants of emerging concern (CECs) presents a critical challenge for environmental protection and public health. These contaminants, including pharmaceuticals, personal care products, endocrine-disrupting chemicals, and illicit drugs, are not completely removed by conventional wastewater treatment plants and are increasingly detected in aquatic environments at concentrations with potential ecological consequences [46] [26]. Conventional analytical methods like gas chromatography-mass spectrometry (GC-MS) and high-performance liquid chromatography-mass spectrometry (HPLC-MS) provide excellent sensitivity but are limited by cost, lengthy analysis time, and lack of portability for real-time monitoring [46] [47]. This technological gap has driven the development of novel sensor technologies that offer rapid, sensitive, and field-deployable solutions for environmental monitoring.
The emergence of plasmonic sensors and nanosensors represents a paradigm shift in environmental analytics. These technologies leverage the unique properties of nanoscale materials to achieve detection capabilities that rival or surpass conventional methods while offering the potential for miniaturization, portability, and real-time analysis [48]. When integrated into portable devices, these sensors enable wastewater-based epidemiology, on-site contamination screening, and continuous environmental monitoring, providing crucial data for assessing population-level chemical exposure and ecological risk assessment [47]. This technical guide explores the operating principles, material foundations, and implementation frameworks for these advanced sensing platforms within environmental exposure research.
Fundamental Principles and Sensing Mechanisms
Plasmonic Sensing Mechanisms
Plasmonic sensors utilize the interaction between light and free electrons in metallic nanostructures to detect molecular binding events with high sensitivity. The two primary phenomena exploited in environmental sensing are Surface Plasmon Resonance (SPR) and Surface-Enhanced Raman Scattering (SERS).
Surface Plasmon Resonance (SPR) occurs when incident light photons couple with collective electron oscillations (plasmons) at a metal-dielectric interface under specific resonance conditions. The resonance angle or wavelength is extremely sensitive to changes in the local refractive index caused by analyte binding to the sensor surface. This enables label-free detection of molecular interactions in real-time [46]. Conventional SPR configurations use planar gold or silver films, while advanced fiber-optic SPR sensors offer miniaturization potential. Research has demonstrated that bimetallic configurations, such as alloy layers formed of spherical silver and gold nanoparticles, can enhance sensitivity and detection accuracy compared to conventional single-metal designs [49].
Surface-Enhanced Raman Scattering (SERS) leverages the enormous electromagnetic field enhancement that occurs near plasmonic nanostructures, particularly at sharp tips or between closely-spaced nanoparticles. This enhancement can amplify the weak inherent Raman signals of molecules by factors up to 10^10–10^11, enabling single-molecule detection in some cases [46]. The SERS effect allows for the study of molecular information of adsorbed analytes through their vibrational fingerprints, providing both quantitative and qualitative analytical information.
Table 1: Comparison of Plasmonic Sensing Mechanisms
| Mechanism | Transduction Principle | Key Features | Environmental Applications |
|---|---|---|---|
| Surface Plasmon Resonance (SPR) | Shift in resonance angle/wavelength due to refractive index change | Label-free, real-time monitoring, quantitative | Detection of pharmaceuticals, pesticides, hormones in water |
| Surface-Enhanced Raman Scattering (SERS) | Enhancement of Raman scattering signals near metallic nanostructures | Provides molecular fingerprint, extremely high sensitivity | Identification of chemical contaminants, illicit drugs, dyes |
| Localized Surface Plasmon Resonance (LSPR) | Shift in extinction peak of nanoparticles | Simpler instrumentation, solution-based sensing | Heavy metal detection, colorimetric assays |
Nanomaterial-Based Sensing Platforms
Nanomaterials form the foundation of advanced sensing platforms due to their unique size-dependent properties, including high surface area-to-volume ratio, quantum effects, and tunable surface chemistry. These properties can be harnessed across multiple transduction mechanisms for environmental monitoring.
Optical nanosensors utilize changes in optical properties such as absorption, fluorescence, or reflectance upon analyte interaction. Gold nanoparticles (AuNPs) are particularly valuable in colorimetric sensors due to their strong surface plasmon resonance in the visible region and distance-dependent color changes from red to blue during aggregation [50]. Functionalized AuNPs have been deployed for the detection of heavy metals like mercury and lead, inorganic species, and diverse organic pollutants in water samples [50].
Electrochemical nanosensors measure electrical changes (current, potential, or impedance) resulting from chemical reactions or binding events at electrode surfaces modified with nanomaterials. The integration of carbon nanotubes, graphene, and metal nanoparticles enhances electron transfer kinetics, increases active surface area, and improves selectivity through tailored functionalization [48] [47]. These sensors demonstrate superior performance in turbid and complex environmental matrices, making them well-suited for field analysis of contaminants [47].
Plasmonic Sensing Pathways for Environmental Monitoring
Advanced Materials and Nanostructures
Classification of Nanomaterials for Sensing
The exceptional properties of nanomaterials—including high thermal and electrical conductivity, large surface area-to-volume ratio, and good biocompatibility—make them ideal for sensing applications [48]. These materials can be systematically classified by their dimensionality, which correlates with their functional properties in sensing devices.
Zero-dimensional (0D) nanomaterials include quantum dots (e.g., CdSe, InP), fullerenes, and spherical nanoparticles (e.g., gold, silver, metal oxides). Their confined structure in all dimensions results in discrete electronic states and size-tunable optical properties. For instance, quantum dots exhibit size-dependent fluorescence emissions valuable for multiplexed detection schemes [48].
One-dimensional (1D) nanomaterials such as nanowires, nanotubes, nanorods, and nanofibers have two dimensions at the nanoscale. Carbon nanotubes (CNTs) exemplify this category with their exceptional mechanical strength, high electrical conductivity, and large surface area, making them excellent transducers in electrochemical and field-effect sensors [48].
Two-dimensional (2D) nanomaterials like graphene, transition metal dichalcogenides (e.g., MoS₂), and MXenes have thickness at the atomic scale while extending in two dimensions. Graphene's unique Dirac cone electronic structure, high carrier mobility, and large specific surface area have enabled ultrasensitive detection of various contaminants [48].
Table 2: Nanomaterial Classification by Dimensionality and Applications
| Dimensionality | Examples | Key Properties | Sensor Applications |
|---|---|---|---|
| 0D | Quantum dots, metal nanoparticles, fullerenes | Quantum confinement, size-tunable optics, high surface area | Fluorescent tags, catalytic sensors, colorimetric detection |
| 1D | Carbon nanotubes, nanowires, nanorods | Anisotropic electrical transport, high aspect ratio | Electrochemical sensors, field-effect transistors, MEMS sensors |
| 2D | Graphene, MXenes, transition metal dichalcogenides | Ultra-thin structure, high surface-to-volume ratio, unique band structure | SPR enhancement, conductive films, molecular sieving |
Molecularly Imprinted Polymers (MIPs) as Recognition Elements
Molecularly imprinted polymers (MIPs) are synthetic receptors that provide antibody-like specificity through template-guided polymerization. The non-covalent imprinting approach, pioneered by Mosbach et al., has become the most widespread method due to its simplicity and faster binding kinetics [46]. The process involves copolymerizing functional monomers around a target molecule (template) in the presence of cross-linking agents, followed by template removal to create specific binding cavities complementary in shape, size, and functional group orientation to the analyte [46].
The integration of MIPs with plasmonic transducers creates robust sensing platforms that combine high specificity with exceptional sensitivity. Surface imprinting techniques, where binding sites are located at or close to the polymer surface, facilitate faster removal and rebinding of template molecules, improving sensor response times [46]. MIP-based plasmonic sensors have been successfully developed for various environmental contaminants including pharmaceuticals, pesticides, and endocrine-disrupting compounds in water samples [46].
Experimental Protocols and Methodologies
Fabrication of MIP-Based Plasmonic Sensors
Protocol: Development of MIP-Coated SPR Sensor for Pharmaceutical Detection
Materials Required:
- Gold-coated SPR sensor chip
- Template molecule (target pharmaceutical, e.g., diclofenac)
- Functional monomers (methacrylic acid, acrylamide)
- Cross-linker (ethylene glycol dimethacrylate)
- Initiator (azobisisobutyronitrile - AIBN)
- Porogenic solvent (acetonitrile/toluene mixture)
- Monoclonal antibodies specific to target analytes (for validation)
Procedure:
- Pre-assembly Solution Preparation: Dissolve the template molecule (0.1 mmol) and functional monomers (0.4 mmol) in porogenic solvent (5 mL) in a glass vial. Allow pre-complexation for 30 minutes with gentle stirring.
- Polymerization Mixture Preparation: Add cross-linker (2.0 mmol) and initiator AIBN (0.02 mmol) to the pre-assembly solution. Purge with nitrogen gas for 5 minutes to remove oxygen.
- Sensor Functionalization: Spin-coat the polymerization mixture onto the gold SPR chip at 2000 rpm for 30 seconds.
- UV Polymerization: Place the coated chip in a UV polymerization chamber (λ = 365 nm) for 2 hours under nitrogen atmosphere.
- Template Extraction: Soxhlet extraction with methanol:acetic acid (9:1 v/v) for 24 hours to remove template molecules, followed by drying under vacuum.
- Characterization: Validate binding sites through saturation binding experiments using SPR and compare with non-imprinted polymer (NIP) controls.
Quality Control:
- Confirm complete template removal through mass spectrometry analysis of extraction solvents.
- Verify polymer homogeneity and thickness using atomic force microscopy (AFM).
- Assess cross-reactivity with structurally similar compounds to determine imprinting factor.
Development of Colorimetric Plasmonic Nanosensors
Protocol: Gold Nanoparticle-Based Sensor for Heavy Metal Detection
Materials Required:
- Chloroauric acid (HAuCl₄)
- Trisodium citrate
- Functional ligands (dithiocarbamates, thymine derivatives, aptamers)
- Standard solutions of target heavy metals (Hg²⁺, Pb²⁺, As³⁺)
- Buffer solutions (phosphate, HEPES)
- UV-Vis spectrophotometer or plate reader
Procedure:
- Synthesis of Gold Nanoparticles (AuNPs): Heat 100 mL of 1 mM HAuCl₄ solution to boiling with vigorous stirring. Rapidly add 10 mL of 38.8 mM trisodium citrate solution. Continue heating and stirring until the solution develops a deep red color (approximately 10 minutes). Cool to room temperature and characterize by UV-Vis spectroscopy (λmax ≈ 520 nm) and TEM.
- Surface Functionalization: Add functional ligands (e.g., 5 μM final concentration of N-1-(2-mercaptoethyl)thymine for Hg²⁺ detection) to the AuNP solution. Incubate for 24 hours at room temperature with gentle shaking. Remove excess ligands by centrifugation at 12,000 rpm for 20 minutes and resuspend in appropriate buffer.
- Sensor Calibration: Incubate functionalized AuNPs with standard solutions of target analytes across a concentration range (e.g., 0.1-100 μM) for 15 minutes. Measure absorbance spectra from 400-800 nm. Calculate ratio of absorbance at longer wavelengths (650-700 nm) to absorbance at λmax (520 nm) to quantify aggregation.
- Selectivity Testing: Challenge the sensor with potential interfering ions (Na⁺, K⁺, Ca²⁺, Mg²⁺, Zn²⁺, Cd²⁺) at 10-fold higher concentrations than the target analyte.
- Sample Analysis: Apply to environmental water samples with and without spiked standards. Validate results using atomic absorption spectroscopy (AAS).
MIP-Based Sensor Fabrication Workflow
The Scientist's Toolkit: Essential Research Reagents and Materials
Table 3: Key Research Reagents for Sensor Development
| Reagent/Material | Function | Example Applications |
|---|---|---|
| Gold nanoparticles (AuNPs) | Plasmonic transducer, colorimetric signal generation | Heavy metal detection, illicit drug sensing [50] |
| Molecularly Imprinted Polymers (MIPs) | Synthetic recognition elements | Selective binding of pharmaceuticals, pesticides [46] |
| Carbon nanotubes (CNTs) | Electrode modification, signal amplification | Electrochemical detection of contaminants [48] |
| Aptamers | Nucleic acid-based recognition elements | Target-specific binding with conformational change |
| Functional monomers (MAA, AAM) | MIP formation, interaction with template | Creating specific binding cavities in polymers [46] |
| Cross-linkers (EGDMA) | MIP structural stability | Forming rigid polymer network [46] |
| Raman reporter molecules | SERS signal generation | Creating chemical signature in SERS sensors |
Portable Device Integration and Environmental Applications
From Laboratory to Field: Portable Sensor Systems
The transition from laboratory prototypes to field-deployable devices requires integration of sensing elements with sample handling, signal processing, and data transmission components. Portable biosensors for environmental monitoring increasingly incorporate smartphone-based detection, microfluidic sample handling, and wireless data connectivity for real-time environmental surveillance [47].
Fiber-optic SPR probes represent a significant advancement toward miniaturization, allowing the development of compact sensing systems that can be deployed in situ for continuous water quality monitoring [49]. Comparative studies have demonstrated that nano-plasmonic fiber optic sensors with bimetallic nanoparticle layers can outperform conventional SPR configurations in terms of sensitivity and detection accuracy [49].
Electrochemical sensor platforms have shown particular promise for portable illicit drug detection in wastewater, enabling wastewater-based epidemiology as a tool for estimating community-level drug consumption [47]. These systems can be miniaturized into portable devices for on-site screening while maintaining sensitivity comparable to laboratory instruments.
Applications in Monitoring Contaminants of Emerging Concern
Pharmaceuticals and Personal Care Products (PPCPs): MIP-based SPR sensors have been successfully applied to detect various pharmaceuticals in water samples, including antibiotics, anti-inflammatories, and hormones at environmentally relevant concentrations (ng/L to μg/L) [46] [26]. These sensors address the challenge of low-level detection in complex matrices while offering the potential for continuous monitoring at wastewater treatment facilities.
Illicit Drugs: Portable sensors using electrochemical and optical transduction have been developed for cocaine, amphetamines, opioids, and their metabolites in wastewater [47]. This application supports wastewater-based epidemiology approaches that provide near real-time data on community drug consumption patterns, complementing traditional survey methods.
Heavy Metals: Colorimetric plasmonic nanosensors utilizing functionalized gold nanoparticles have demonstrated excellent sensitivity for toxic heavy metals like mercury, lead, and arsenic [50]. The visual readout (color change) enables semi-quantitative analysis without instrumentation, while smartphone-based color analysis provides quantitative results in field settings.
Micro- and Nano-plastics (MNPs): While detection challenges remain due to the diverse chemical composition and size range of plastic particles, SERS-based approaches show promise for identifying and characterizing MNPs in environmental samples through their unique vibrational signatures [26].
Table 4: Performance Comparison of Novel Sensor Technologies for Environmental Monitoring
| Analyte Category | Sensor Technology | Limit of Detection | Analysis Time | Advantages |
|---|---|---|---|---|
| Pharmaceuticals | MIP-SPR | 0.1-10 ng/L | 15-30 minutes | Label-free, real-time capability |
| Heavy Metals | Colorimetric AuNPs | 1-50 nM | 5-15 minutes | Visual readout, no instrumentation needed |
| Illicit Drugs | Electrochemical nanosensors | 0.1-1 μg/L | < 5 minutes | Portable, high sensitivity in complex matrices |
| Pesticides | MIP-SERS | 0.01-0.1 μg/L | 10-20 minutes | Molecular fingerprinting, ultra-sensitive |
| Endocrine Disruptors | Aptamer-based SPR | 0.5-5 ng/L | 20-30 minutes | High specificity, regenerable |
Future Perspectives and Challenges
The convergence of nanosensor technology with artificial intelligence and machine learning represents the next frontier in environmental monitoring. Advanced data processing techniques can enhance sensor selectivity in complex matrices, recognize patterns in contamination events, and predict environmental trends based on sensor networks [48]. Integration of nanosensors into Internet of Things (IoT) frameworks enables the development of comprehensive environmental surveillance systems with real-time data access.
Despite significant progress, challenges remain in the widespread deployment of these technologies. Long-term stability under environmental conditions, sensor fouling in complex matrices, and reproducible mass manufacture of nanomaterial-based sensors require further development [48]. Additionally, standardization of testing protocols and validation against reference methods is essential for regulatory acceptance of novel sensor technologies for environmental monitoring.
The implementation of the One Health concept—recognizing the interconnection between human, animal, and environmental health—underscores the importance of advanced sensor technologies for comprehensive contaminant tracking across ecosystems [51]. As regulatory frameworks evolve to address contaminants of emerging concern, novel sensor technologies will play an increasingly vital role in environmental exposure assessment and risk management.
Biomonitoring has evolved from a supplementary tool to a cornerstone of modern exposure science, directly measuring the internal concentration of environmental chemicals in biological tissues. This technical guide details the methodologies and applications of biomonitoring for assessing the bioaccumulation of contaminants of emerging concern (CECs) and their early biological effects. Framed within the context of environmental exposure science, this review synthesizes current practices in biomarker selection, analytical techniques, and data interpretation. It further explores the mechanistic pathways through which pollutants trigger epigenetic and immune responses, establishing a critical link between exposure, internal dose, and early adverse outcomes. The integration of biomonitoring data with mechanistic toxicology is paramount for advancing risk assessment and informing public health policies aimed at mitigating the ecological and human health impacts of widespread chemical exposure.
Biomonitoring, defined as the direct measurement of chemicals or their metabolites in human tissues and body fluids, provides an unequivocal measure of internal dose, integrating exposure from all environmental sources and routes [52]. This approach represents a paradigm shift from traditional exposure assessment, which often relied on estimations based on environmental concentrations. The core components of biomonitoring are biomarkers, which are broadly categorized into three classes: biomarkers of exposure (the parent chemical or its metabolite), biomarkers of effect (measurable biochemical, physiological, or behavioral changes), and biomarkers of susceptibility (indicators of altered sensitivity to chemical exposure) [52].
The significance of biomonitoring in environmental health research has grown exponentially with advancements in analytical chemistry, now enabling the detection of chemicals at extraordinarily low concentrations (parts per trillion or quadrillion) in the general population [52]. Large-scale programs, such as the Centers for Disease Control and Prevention's (CDC) National Health and Nutrition Examination Survey (NHANES), have systematically quantified hundreds of environmental chemicals in the U.S. population, providing invaluable baseline data for tracking exposure trends and prioritizing research efforts [53]. For contaminants of emerging concern (CECs)—substances not commonly monitored but with potential ecological or health risks—biomonitoring is a key tool for moving from suspicion of exposure to confirmation, thereby shaping the national environmental research agenda [52].
Key Biomarkers and Analytical Methodologies
The selection of appropriate biomarkers and analytical methods is critical for generating reliable and interpretable biomonitoring data. This process involves choosing the specific chemical or metabolite to measure, the biological matrix in which to measure it, and the analytical technology to be used.
Selection of Biological Matrices
The choice of matrix depends on the pharmacokinetics of the target chemical, the purpose of the study, and practical considerations regarding sample collection. The following table summarizes the primary matrices used in biomonitoring studies.
Table 1: Common Biological Matrices in Biomonitoring Studies
| Matrix | Key Applications | Advantages | Disadvantages |
|---|---|---|---|
| Blood/Serum | Measurement of persistent, lipophilic chemicals (e.g., PFAS, HFRs), metals [54] | Represents systemic circulation; integrates exposure; well-established collection protocols [52] | Invasive collection; limited red blood cell lifespan (~120 days) for some chemicals [52] |
| Urine | Measurement of non-persistent chemicals and metabolites (e.g., phthalates, bisphenols, PAH metabolites) [54] | Non-invasive collection; large sample volumes; suitable for high-throughput studies [52] | Concentration varies with hydration; often requires creatinine correction; may not reflect chronic exposure for rapidly excreted compounds [52] |
| Breast Milk | Assessment of lipophilic, persistent chemicals (e.g., PCBs, dioxins, PBDEs) [52] | Provides information on maternal body burden and infant exposure; easy to collect [52] | Reflects historical exposures; diet significantly influences chemical levels [52] |
| Hair | Historical exposure assessment for specific metals (e.g., mercury, arsenic) [52] | Non-invasive; provides a temporal record of exposure | Potential for external contamination; inconsistent analytical results for many chemicals [52] |
| Adipose Tissue | Direct measurement of body burden of lipophilic chemicals [52] | Gold standard for lipophilic compounds | Highly invasive surgery required; rarely collected in routine studies [52] |
Prioritized Substance Groups and Analytical Techniques
International initiatives, such as the European HBM4EU, have prioritized key substance groups for biomonitoring. The following table outlines the recommended biomarkers, matrices, and analytical methods for these priorities.
Table 2: Analytical Methods for Priority Substance Groups as per HBM4EU
| Substance Group | Recommended Biomarker & Matrix | Primary Analytical Method | Notes |
|---|---|---|---|
| Per- and polyfluoroalkyl substances (PFASs) | Parent compounds in serum [54] | High-performance liquid chromatography-tandem mass spectrometry (LC-MS/MS) [54] | Measures the persistent parent compounds directly. |
| Phthalates and substitutes (e.g., DINCH) | Metabolites in urine [54] | LC-MS/MS [54] | Measuring metabolites avoids external contamination and reflects internal exposure. |
| Bisphenols | Parent compounds in urine [54] | LC-MS/MS or GC-MS/MS [54] | GC–MS/MS is an emerging alternative to LC-MS/MS. |
| Halogenated Flame Retardants (HFRs) | Parent compounds in serum; specific compounds (e.g., HBCDD) in urine [54] | LC-MS/MS (for HBCDD, phenolic HFRs); GC-low resolution MS with electron capture negative ionization (ECNI) for others [54] | Method depends on the specific compound. |
| Organophosphorous Flame Retardants (OPFRs) | Metabolites in urine [54] | LC-MS/MS [54] | Metabolite measurement is preferred. |
| Polycyclic Aromatic Hydrocarbons (PAHs) | Metabolites in urine [54] | LC-MS/MS [54] | Metabolites (e.g., 1-hydroxypyrene) are key exposure biomarkers. |
| Arylamines | Parent compounds in urine [54] | GC–MS or LC-MS/MS [54] | Both methods are suitable. |
| Cadmium and Chromium | Metals in blood or urine; Cr in erythrocytes for Cr(VI) exposure [54] | Inductively Coupled Plasma-Mass Spectrometry (ICP-MS) [54] | Cd determination in urine requires methods to avoid interferences. |
Experimental Protocols for Biomonitoring
This section provides a detailed methodology for a standard biomonitoring study, from sample collection to data reporting.
Protocol: Biomonitoring of Urinary Metabolites of Non-Persistent Chemicals (e.g., Phthalates, Bisphenols)
1. Study Design and Ethical Considerations:
- Define the study population and obtain informed consent under an institutional review board (IRB)-approved protocol.
- Consider the timing of sample collection (e.g., first-morning void, spot sample, 24-hour collection) based on the half-life of the target analytes [52].
2. Sample Collection:
- Use pre-screened containers to avoid contamination (e.g., plasticizers in lids).
- Collect urine in a sterile, chemical-free polypropylene cup.
- Aliquot samples into cryovials and immediately freeze at -20°C or -80°C for long-term storage.
3. Sample Preparation (Solid-Phase Extraction - SPE):
- Thaw urine samples and vortex thoroughly.
- Centrifuge to remove particulates.
- Add internal standards (isotope-labeled analogs of the target metabolites) to account for matrix effects and recovery losses.
- Dilute the supernatant with a buffer (e.g., ammonium acetate, pH 6.5).
- Condition the SPE cartridge (e.g., Oasis HLB) with methanol and buffer.
- Load the diluted urine sample onto the cartridge.
- Wash with buffer and water to remove interfering compounds.
- Elute the target analytes with a solvent like methanol or acetonitrile.
- Evaporate the eluent to dryness under a gentle stream of nitrogen.
- Reconstitute the dry residue in the initial mobile phase for LC-MS/MS analysis.
4. Instrumental Analysis (LC-MS/MS):
- Chromatography: Separate metabolites using a reverse-phase C18 column with a gradient of methanol (or acetonitrile) and water, both modified with 0.1% formic acid to enhance ionization.
- Mass Spectrometry: Operate the mass spectrometer in multiple reaction monitoring (MRM) mode. The instrument first ionizes the molecule to form a precursor ion, then fragments it and selects a specific product ion for quantification. This two-stage mass selection provides high specificity and sensitivity.
5. Quality Assurance/Quality Control (QA/QC):
- Include procedural blanks (solvent processed like samples) to check for contamination.
- Use duplicate samples and spiked samples to assess precision and accuracy.
- Calibrate the instrument with a series of standard solutions of known concentration.
- Participate in inter-laboratory comparison programs to ensure data comparability.
6. Data Analysis and Reporting:
- Quantify concentrations using the calibration curve and correct for recovery using the internal standard.
- Correct for urine dilution using creatinine concentration or specific gravity.
- Report results as µg/L of urine or µg/g creatinine.
The workflow for this comprehensive protocol is visualized below.
Bioaccumulation and Ecological Risk Assessment
Biomonitoring extends beyond human health to assess ecological risk, where invasive species can serve as powerful sentinels for ecosystem health. A study in the Albufera Natural Park (Spain) demonstrated this by comparing the bioaccumulation of 171 CECs in native and invasive species [55].
The study evaluated the Asian clam (Corbicula fluminea), American red swamp crayfish (Procambarus clarkii), and pumpkinseed sunfish (Lepomis gibbosus). The Asian clam exhibited the highest number of detected compounds (23) and the highest chemical concentrations, particularly for pharmaceuticals, making it a particularly sensitive bioindicator [55]. A comparative analysis with the native clam confirmed that invasive species could provide equivalent, and sometimes superior, information on chemical pollution [55].
The ecological risk assessment was performed using the internal concentrations of CECs measured in the organisms to calculate a Hazard Index (HI). The compounds with the highest contribution to the ecological risk were sertraline, fluoxetine, terbuthylazine, caffeine, and oseltamivir [55]. At most sites, the HI values indicated a high risk, demonstrating strong ecological pressure from mixtures of CECs for both native and invasive species [55]. This approach highlights the utility of biomonitoring data for moving from mere detection of chemicals to a quantitative assessment of their potential impact on the environment.
Early Biological Effects: The Immune-Epigenetic Axis
A frontier in biomonitoring is linking internal exposure to early biological effects before clinical disease manifests. A key mechanistic pathway is the pollutant-immune-epigenetic axis, where environmental exposures trigger immune responses that, in turn, drive durable epigenetic reprogramming [56].
Mechanistic Pathways
Pollutants initiate this cascade by being sensed by innate immune receptors. Key sensors include:
- Aryl Hydrocarbon Receptor (AHR): Activated by organic pollutants like PAHs and dioxins, influencing T-helper cell balance [56].
- Toll-like Receptor 4 (TLR4): Activated by particulate matter (e.g., PM2.5) and ozone, leading to NF-κB activation and pro-inflammatory cytokine (IL-6, TNF-α) production [56].
- NLRP3 Inflammasome: Activated by silica, heavy metals, or reactive oxygen species (ROS), driving the release of IL-1β and IL-18 [56].
This immune activation then reprograms the epigenome through several mechanisms:
- Cytokine Signalling: IL-6 downregulates DNA methyltransferase 1 (DNMT1), promoting DNA demethylation and sustaining inflammatory gene expression. TNF-α induces histone acetylation (e.g., H3K9ac, H3K14ac), facilitating chromatin accessibility [56].
- Oxidative Stress: ROS generated during pollutant metabolism inhibits histone deacetylases (HDACs) and activates Ten-eleven translocation (TET) enzymes, leading to a hypomethylated, transcriptionally active chromatin state [56].
- Non-Coding RNAs: Pollutants modulate the expression of microRNAs (e.g., miR-21, miR-155) and long non-coding RNAs, which act as intermediaries between cytokine signaling and epigenetic remodeling [56].
These changes can result in "trained immunity," where innate immune cells acquire a long-term memory of the exposure, or in skewed T-cell differentiation (e.g., toward Th17 and away from Treg), predisposing to chronic inflammation, autoimmunity, and allergic diseases [56]. The diagram below illustrates this core pathway.
The Scientist's Toolkit: Essential Research Reagents and Materials
Successful execution of biomonitoring and biomarker studies requires a suite of specialized reagents and materials. The following table details key items essential for the workflows described in this guide.
Table 3: Essential Research Reagents and Materials for Biomonitoring
| Item | Function/Application |
|---|---|
| Isotope-Labeled Internal Standards (e.g., 13C- or 2H-labeled analogs of target analytes) | Added to samples before processing to correct for matrix effects and analyte loss during sample preparation and analysis; crucial for accurate quantification in mass spectrometry [54]. |
| Solid-Phase Extraction (SPE) Cartridges (e.g., Oasis HLB, C18) | Used to clean up complex biological samples (urine, serum) and pre-concentrate target analytes, removing interfering compounds and improving method sensitivity [54]. |
| LC-MS/MS Grade Solvents (e.g., Methanol, Acetonitrile, Water) | High-purity solvents are essential for mobile phases in liquid chromatography to prevent background noise, ion suppression, and column damage, ensuring reliable and reproducible results. |
| Certified Reference Materials (CRMs) | Biological materials with certified concentrations of specific analytes. Used for method validation and to ensure the accuracy and traceability of analytical measurements [54]. |
| Pre-screened Collection Containers (e.g., polypropylene tubes/containers) | Specially tested containers that are certified to be free of contaminants like bisphenols and phthalates, which can leach into samples and cause false positive results [52]. |
| Specific Antibodies & ELISA Kits | For immunoassay-based detection of specific protein biomarkers (e.g., cytokines, adducts). Useful for high-throughput screening of biological effects when mass spectrometry is not available. |
| PCR Reagents and Bisulfite Conversion Kits | Essential for analyzing epigenetic biomarkers. Bisulfite conversion differentiates methylated from unmethylated cytosines in DNA, allowing for quantification of DNA methylation changes via PCR-based methods [56]. |
| ICP-MS Tuning Solution | A solution containing known elements at precise concentrations used to calibrate and optimize the performance of the ICP-MS instrument for accurate metal detection [54]. |
Biomonitoring provides an indispensable, direct measure of the internal chemical body burden, offering unparalleled insight into human and ecological exposure to CECs. The integration of sophisticated analytical techniques, such as LC-MS/MS and ICP-MS, with robust experimental protocols allows for the sensitive and specific quantification of biomarkers in a variety of biological matrices. Moving beyond mere exposure assessment, the field is increasingly focused on linking internal dose to early biological effects, with the immune-epigenetic axis emerging as a critical mechanistic pathway underlying the long-term health consequences of environmental pollutants. As biomonitoring data continue to accumulate, their careful interpretation within a risk assessment framework is essential for translating scientific evidence into effective public health and environmental protection strategies. Future directions will likely involve greater use of non-invasive sampling, high-throughput 'omics' technologies, and the development of biomarkers that can predict individual susceptibility and future disease risk.
The accurate assessment of environmental contaminants, pivotal for understanding exposure and ecological effects, is fundamentally dependent on the chosen sampling strategy. Within the context of contaminants of emerging concern (CECs) research, the selection between passive and grab sampling methodologies dictates the temporal scale and representativeness of the data collected. Grab sampling provides an instantaneous "snapshot" of environmental conditions at a specific point in time and location [57]. In contrast, passive sampling employs devices that accumulate contaminants over a period of days to weeks, providing a time-weighted average (TWA) concentration and offering a more integrated picture of environmental exposure [58] [59]. This whitepaper provides an in-depth technical comparison of these two core strategies, detailing their principles, applications, and experimental protocols to guide researchers and scientists in designing robust environmental monitoring programs for CECs.
Fundamental Principles and Comparative Analysis
Grab Sampling: Capturing the Instantaneous Snapshot
Grab sampling involves the direct collection of a discrete environmental sample—be it water, air, or process fluid—at a specific moment for laboratory analysis [57]. The primary objective is to obtain a sample that is chemically representative of the source fluid at the exact time of collection. Achieving this representativeness requires meticulous attention to best practices, including the use of probes to draw samples from the center of a process stream to avoid settled solids or pipe-scale contaminants, allowing for adequate flushing of the sampling system to clear dead volume, and selecting appropriate containers (e.g., pressurized cylinders for volatile compounds) to maintain sample integrity and prevent fractionation [57]. While grab sampling is straightforward and economical, its major limitation is its inability to account for temporal fluctuations in contaminant levels, potentially missing short-duration pollution events such as chemical spills or pulsed discharges [60] [59].
Passive Sampling: Integrating for a Long-Term View
Passive sampling operates on the principle of diffusion or sorption, where contaminants naturally migrate from the environmental medium onto a collecting sorbent or membrane within a sampler deployed for a defined period, without the use of an active pump [58]. This process provides a TWA concentration, effectively integrating all fluctuations—including transient contamination peaks—that occur during the deployment period [59]. This makes passive sampling exceptionally powerful for monitoring CECs, which may be present at ultra-trace levels and exhibit variable release patterns. Devices such as the Polar Organic Chemical Integrative Sampler (POCIS) for polar organics or passive air samplers are widely used [61] [62]. Their key advantages include superior sensitivity due to in-situ pre-concentration of target analytes, and cost-effectiveness for large-scale or long-term projects due to their simplicity and minimal maintenance requirements [63] [58]. However, their data can be influenced by environmental conditions like temperature and flow rate, and they do not provide real-time information [58].
Direct Comparison of Strategic Attributes
Table 1: A strategic comparison of Grab and Passive sampling methodologies.
| Feature | Grab Sampling | Passive Sampling |
|---|---|---|
| Temporal Representation | Instantaneous snapshot [57] | Time-weighted average (TWA), integrative [59] |
| Ability to Capture Peaks | Only if present at sampling time | Excellent; integrates short-term fluctuations and peaks [59] |
| Cost & Operational Demands | Generally low cost, simple | Low cost for large-scale projects; minimal maintenance [58] |
| Sensitivity | Limited by sample volume and analytical method | High; due to in-situ pre-concentration of analytes [59] |
| Temporal Resolution | High (for the specific moment) | Low; does not provide real-time data [58] |
| Ideal Application | Process validation, compliance checks where concentration is stable, validating online analyzers [57] | Long-term environmental monitoring, trend analysis, epidemiological studies, detecting ultra-trace CECs [58] [61] |
Applications in Monitoring Contaminants of Emerging Concern
The complementary strengths of passive and grab sampling are clearly demonstrated in field research on CECs. A nested watershed study on pesticides and pharmaceuticals highlighted that POCIS passive samplers detected CECs at equal or higher frequencies than grab sampling [61]. Notably, the two methods revealed different temporal patterns: grab samples showed the highest detection frequencies in summer, whereas POCIS maintained high frequencies in both spring and summer, underscoring its ability to integrate exposures over a longer period [61].
Similarly, in the realm of public health, passive sampling has proven highly effective for wastewater-based epidemiology (WBE). During the COVID-19 pandemic, studies compared "torpedo-style" 3D-printed passive samplers (containing cotton swabs and electronegative membranes) against traditional autosamplers for detecting SARS-CoV-2 in wastewater. The passive samplers performed reliably, in some instances detecting the virus on days when grab/auto samples were negative, suggesting a potential sensitivity advantage due to longer, integrative collection [60]. This makes passive samplers a powerful tool for community-level pathogen surveillance, especially in remote or small catchments with limited access to power and expensive autosamplers.
The synergy of combining both methods was showcased in a large-scale pesticide monitoring program across the Adour-Garonne basin in France [59]. The study concluded that while grab sampling was effective for capturing the spatial distribution of contamination at a given moment, POCIS provided crucial supplementary data on temporal trends and contamination levels, offering a more complete picture of water quality. This combined approach is often optimal for comprehensive environmental risk assessments.
Experimental Protocols and Methodologies
Protocol for Grab Sampling of Water
To ensure a representative sample, the following protocol, synthesizing best practices from industrial and environmental guidelines, should be adhered to [57]:
- System Preparation: Flush the sampling line thoroughly to remove any stagnant fluid or contaminants from previous samples. The volume flushed should be sufficient to displace the entire dead volume of the line multiple times.
- Sample Collection: Use a clean, appropriate container. For volatile compounds or gases, use sealed, pressurized cylinders to prevent fractionation and degassing. For non-volatile liquids, glass or polyethylene bottles may be suitable.
- Sample Handling and Preservation: Immediately label the container with time, date, and location. Preserve the sample as required for the target analytes (e.g., cooling, chemical preservation) and transport it to the laboratory promptly to minimize changes in composition.
Protocol for Passive Sampling of Water using POCIS
A typical protocol for deploying and processing POCIS, as used in CECs research, involves the following steps [60] [59]:
- Sampler Preparation: Prior to deployment, the POCIS units (typically comprising a solid-phase sorbent sandwiched between microporous membranes) should be handled with care to avoid contamination.
- Field Deployment: Deploy the POCIS units in the water body (e.g., secured in a protective cage in flowing water or suspended in a well-mixed zone) for a predetermined period, typically 14-28 days. Record the deployment and retrieval times precisely.
- Sampler Retrieval and Processing: Upon retrieval, carefully disassemble the units and transfer the sorbent material to a clean container. The analytes are typically recovered by rinsing the sorbent with a suitable solvent or buffer (e.g., PBS). The resulting eluent is then concentrated, often via centrifugal ultrafiltration, before chemical analysis [60].
Protocol Comparison for Pathogen Detection in Wastewater
Table 2: Detailed comparison of experimental protocols for SARS-CoV-2 detection in wastewater, adapted from a comparative study [60].
| Protocol Step | Grab / Auto Sampling | Passive Sampling (Torpedo-Style Device) |
|---|---|---|
| Sample Collection | Collection of a discrete volume (e.g., 100 mL - 1 L) of wastewater via manual grab or automated pump. | Deployment of a device housing both cotton swabs and electronegative membranes in wastewater outflow for ~24 hours. |
| Concentration | Centrifugation and ultrafiltration (e.g., using Centricon Plus-70 centrifugal filters, 30-kDa MWCO). pH adjustment to ~10, followed by vortexing and centrifugation to release solid-bound virus [60]. | The swab/membrane is placed in a syringe barrel; liquid is expressed and rinsed with PBS to a final volume (e.g., 50 mL). The rinseate is then concentrated using the same ultrafiltration method as for grab samples [60]. |
| Nucleic Acid Extraction | RNA extraction from the concentrate using a commercial kit (e.g., MagMax 96 viral isolation kit) on an automated system (e.g., Kingfisher Flex). | Identical process to the grab/auto sampling method. |
| Detection & Quantification | Reverse-transcription quantitative PCR (RT-qPCR) for viral targets (e.g., N1 and N2 genes of SARS-CoV-2). | Identical process to the grab/auto sampling method. |
The Scientist's Toolkit: Essential Research Reagent Solutions
Table 3: Key materials and reagents used in passive and grab sampling for environmental monitoring.
| Item | Function | Example Use Cases |
|---|---|---|
| Polar Organic Chemical Integrative Sampler (POCIS) | A passive sampler designed to accumulate a wide range of polar organic chemicals (0 < logKow < 4), providing a TWA concentration [59]. | Monitoring pesticides, pharmaceuticals, and other CECs in freshwater and marine environments [61] [59]. |
| Electronegative Filter Membranes | A sorbent material in passive samplers that captures viral particles and nucleic acids via electrostatic interactions. | Detection of viruses (e.g., SARS-CoV-2) in wastewater for public health surveillance [60]. |
| Cotton Swabs / Tampons (as Moore Swabs) | An absorbent material used in abiotic passive samplers to capture microorganisms and viruses from flowing water. | Wastewater-based epidemiology for pathogen detection (e.g., in university residence halls or hospitals) [60]. |
| Centricon Plus-70 Centrifugal Filters | Devices for concentrating dilute analytes from liquid samples via ultrafiltration, crucial for detecting trace-level CECs and pathogens. | Pre-concentration step for both grab and passive sample eluents before RNA extraction and PCR analysis [60]. |
| Solid-Phase Extraction (SPE) Sorbents | Used in some passive samplers and for post-collection processing of grab samples to isolate and pre-concentrate target organic analytes. | Analysis of a broad spectrum of CECs after sample collection; the specific sorbent (e.g., HLB) is chosen based on analyte properties [59]. |
Data Comparison and Validation Frameworks
Transitioning from grab to passive sampling, or using them in tandem, requires robust data comparison to ensure regulatory and scientific acceptance. The Interstate Technology & Regulatory Council (ITRC) outlines several effective comparison methods [64]:
- Side-by-Side Comparison: The most rigorous approach. The passive sampler is deployed for its required period and retrieved immediately before a grab sample is collected from the same location under the same conditions [64].
- Bracketed Comparison: Passive and grab sampling methods are alternated over three or more sampling rounds, providing passive data that is "bracketed" by active sample results [64].
- Historical Comparison: Passive sampling results are compared against long-term, stable historical data obtained from grab sampling [64].
For evaluating the results, a common statistical tool is the calculation of Relative Percent Difference (RPD). For side-by-side comparisons of contaminants like volatile organic compounds (VOCs), an RPD of ±25% is often considered acceptable for concentrations greater than 10 μg/L [64]. Data can also be plotted on a 1:1 correspondence graph, where strong agreement is indicated by points clustering closely around the line [64]. Furthermore, statistical methods such as Passing-Bablok regression or Lin’s concordance correlation coefficient can be applied to understand the comparability and usability of results between the different methods [64].
Conceptual Workflow for Method Selection
The following diagram illustrates the decision-making process for selecting and validating an environmental sampling strategy.
In the critical endeavor of assessing the environmental exposure and effects of CECs, no single sampling strategy is universally superior. Grab sampling remains an essential tool for capturing instantaneous, high-resolution snapshots, particularly for process validation and compliance monitoring in stable systems. However, the integrative nature, enhanced sensitivity, and cost-effectiveness of passive sampling make it an indispensable strategy for long-term trend analysis, detecting ultra-trace level contaminants, and capturing transient pollution events that are characteristic of many CECs. The most robust and informative environmental monitoring programs will often leverage the complementary strengths of both passive and grab sampling within a structured validation framework, thereby providing a holistic and accurate picture of environmental contamination necessary to protect public and ecological health.
The study of environmental exposures has been fundamentally transformed by the integration of high-throughput molecular technologies. Exposure science, which aims to comprehensively characterize an individual's environmental exposures throughout their lifetime, increasingly relies on omics approaches to decipher the complex biological responses to environmental contaminants [65] [66]. The exposome concept, first introduced by Wild in 2005, represents all environmental exposures from conception onwards, complementing the genome in understanding disease etiology [67]. While early definitions emphasized external factors, the concept has evolved to encompass associated biological responses, creating a bridge between traditional exposure assessment and systems biology [66].
Epigenomics and transcriptomics serve as critical pillars in this integrated framework, providing a dynamic readout of how environmental exposures reprogram biological systems. The epigenome, comprising DNA methylation, histone modifications, and chromatin organization, represents a mitotically heritable yet plastic layer of regulation that exhibits context-specific changes across the life course [68]. Simultaneously, the transcriptome captures the complete set of RNA transcripts, reflecting real-time gene expression changes in response to environmental cues [69]. Together, these technologies enable researchers to move beyond descriptive exposure assessment toward mechanistic understanding of how contaminants of emerging concern (CECs) influence health trajectories through molecular reprogramming.
Molecular Responses to Environmental Exposures
Epigenomic Reprogramming by Environmental Toxicants
Environmental exposures can induce persistent epigenomic perturbations that contribute to disease pathogenesis across the lifespan. The TaRGET II Consortium, one of the most comprehensive resources in toxicoepigenomics, systematically investigated epigenomic responses to diverse environmental toxicants including arsenic (As), lead (Pb), bisphenol-A (BPA), di-2-ethylhexyl phthalate (DEHP), tributyltin (TBT), tetrachlorodibenzo-p-dioxin (TCDD), and particulate matter (PM2.5) [68]. Their work generated 2,564 epigenomes and 1,043 transcriptomes from target tissues (liver, brain, lung, heart) and surrogate tissue (blood) across multiple life stages in mice, revealing several fundamental principles of environmental epigenomics.
The study identified widespread epigenomic disruptions, including:
- DNA methylation changes at 113,186 genomic regions
- Altered chromatin accessibility at 87,409 regulatory elements
- Chromatin state switching of histone modifications
- Persistent, toxicant-specific, sex-dependent epigenomic perturbations [68]
Notably, chromatin accessibility, measured by Assay for Transposase-Accessible Chromatin sequencing (ATAC-seq), demonstrated compound-specific patterns. In weanling livers, the greatest increases in accessibility were observed in males exposed to arsenic, high-dose BPA, and TCDD, while reduced accessibility predominated in males exposed to PM2.5 and females exposed to BPA and TBT [68]. These findings highlight how early-life exposure to toxicants can establish persistent epigenomic landscapes that may predispose to later-life disease.
Table 1: Epigenomic Alterations Induced by Selected Environmental Toxicants
| Toxicant | Exposure Route | Key Epigenomic Alterations | Persistence |
|---|---|---|---|
| Arsenic (As) | Drinking water | Increased chromatin accessibility in liver; DNA methylation changes | Persistent to adulthood |
| Bisphenol A (BPA) | Chow food | Sex-dependent chromatin accessibility changes; Histone modifications | Pattern varies by dose and sex |
| Lead (Pb) | Drinking water | DNA methylation changes in LINE-1 elements | Associated with childhood outcomes |
| PM2.5 | Air inhalation | Reduced chromatin accessibility in liver | Persistent changes at 5 months |
| TCDD | Oral gavage | Significant increases in chromatin accessibility | Strong effects at weaning stage |
Transcriptomic Signatures of Contaminant Exposure
Transcriptomic profiling provides a complementary dimension to epigenomic analyses by capturing the functional output of the genome in response to environmental stressors. RNA sequencing (RNA-seq) studies have revealed that disruption of the transcriptome varies in response to all exposures and is influenced by both sex and age [68]. The TaRGET II consortium documented disrupted expression of 14,908 genes following developmental exposure to environmental toxicants, demonstrating the profound impact of environmental exposures on global gene regulation [68].
Sex-specific transcriptomic responses represent a crucial finding in exposure science. For example, in females, the whole transcriptome response to early-life exposure to BPA, Pb, and PM2.5 increased along with age compared to age- and sex-matched controls [68]. Such sex-dimorphic responses may underlie differential susceptibility to environmental insults and highlight the importance of considering sex as a biological variable in exposure science research.
Emerging contaminants, including microplastics, nanoparticles, per- and polyfluoroalkyl substances (PFAS), pesticides, and personal care product additives, have been shown to induce characteristic transcriptomic signatures through convergent toxicity pathways [70]. These include:
- Oxidative stress response pathways (Nrf2-mediated antioxidant response)
- Inflammatory pathways (NF-κB signaling)
- Endocrine disruption (nuclear receptor signaling)
- Metabolic reprogramming (PPAR signaling pathways) [70]
The identification of these conserved pathways across diverse contaminant classes suggests shared mechanisms of toxicity that transcend the specific chemical identity of pollutants.
Methodological Framework: Experimental Protocols and Workflows
Integrated Epigenomics-Transcriptomics Pipeline
A robust methodological framework is essential for generating high-quality epigenomic and transcriptomic data in exposure studies. The following workflow outlines key experimental and computational steps for integrated multi-omics analysis:
Core Epigenomic Profiling Techniques
DNA Methylation Analysis
Whole Genome Bisulfite Sequencing (WGBS)
- Principle: Treatment of DNA with bisulfite converts unmethylated cytosines to uracils while methylated cytosines remain unchanged, allowing single-base resolution methylation mapping.
- Protocol:
- Extract high-molecular-weight DNA from target tissue (50-100ng input)
- Fragment DNA by sonication or enzymatic digestion (200-300bp)
- Perform bisulfite conversion using commercial kits (e.g., EZ DNA Methylation Kit)
- Construct sequencing libraries with methylation-aware adapters
- Sequence on Illumina platform (≥30x coverage recommended)
- Align reads to bisulfite-converted reference genome using tools like Bismark or BS-Seeker
- Call methylation states at each CpG site [68] [71]
Infinium Methylation BeadChip
- Principle: Array-based technology using probe hybridization to quantify methylation at predefined CpG sites (~850,000 sites in EPIC array).
- Protocol:
- Treat DNA with bisulfite
- Amplify, fragment, and hybridize to BeadChip
- Fluorescently stain and image arrays
- Process data with normalization and background subtraction
- Annotate differentially methylated positions/regions [68]
Chromatin Accessibility and Histone Modification Mapping
ATAC-seq (Assay for Transposase-Accessible Chromatin using sequencing)
- Principle: Hyperactive Tn5 transposase inserts adapters into accessible chromatin regions, preferentially fragmenting open chromatin.
- Protocol:
- Isolate nuclei from fresh tissue (50,000-100,000 cells)
- Treat with Tn5 transposase (37°C, 30 minutes)
- Purify and amplify tagmented DNA with barcoded primers
- Sequence on Illumina platform (≥25 million reads)
- Align reads to reference genome and call peaks [68]
ChIP-seq (Chromatin Immunoprecipitation followed by sequencing)
- Principle: Antibody-based enrichment of DNA fragments bound by specific histone modifications or transcription factors.
- Protocol:
- Cross-link proteins to DNA with formaldehyde
- Sonicate chromatin to 200-500bp fragments
- Immunoprecipitate with specific antibodies (e.g., H3K27ac, H3K4me3)
- Reverse cross-links, purify DNA, and construct libraries
- Sequence and map enriched regions [68]
Transcriptomic Profiling Methods
RNA Sequencing (RNA-seq)
- Principle: High-throughput sequencing of cDNA libraries to quantify transcript abundance and identity.
- Protocol:
- Extract total RNA with integrity number (RIN) >8.0
- Deplete ribosomal RNA or enrich polyadenylated transcripts
- Fragment RNA and synthesize cDNA
- Construct libraries with unique molecular identifiers
- Sequence on Illumina platform (≥30 million reads per sample)
- Align reads to reference genome/transcriptome
- Quantify gene expression and identify differentially expressed genes [68] [70]
Table 2: Key Analytical Platforms for Omics Data Generation
| Technology | Application | Resolution | Sample Input | Key Considerations |
|---|---|---|---|---|
| WGBS | Genome-wide DNA methylation | Single-base | 50-100ng DNA | High coverage needed; computationally intensive |
| RRBS | CpG-rich region methylation | ~1% of genome | 10-100ng DNA | Cost-effective; covers promoters/CGIs |
| ATAC-seq | Chromatin accessibility | ~100bp | 50,000 cells | Requires fresh/frozen tissue; sensitive to mitochondrial DNA |
| ChIP-seq | Histone modifications, TF binding | ~200bp | 1-10 million cells | Antibody quality critical; requires cross-linking |
| RNA-seq | Transcript abundance | Single transcript | 100ng-1μg RNA | Ribosomal depletion vs. polyA selection |
Integrative Analysis: Connecting Epigenomic and Transcriptomic Data
Bioinformatics Integration Strategies
Integrating epigenomic and transcriptomic data requires specialized bioinformatic approaches to identify functional relationships between regulatory elements and gene expression. The following diagram illustrates key computational workflows for multi-omics integration:
Key Integration Approaches
Regulatory Element-to-Gene Linking
- Principle: Identify correlations between epigenomic features at regulatory elements and expression of potential target genes.
- Methods:
- Distance-based assignment: Link regulatory elements to genes within specified genomic windows (e.g., ±500kb from TSS)
- Chromatin interaction data: Incorporate Hi-C or ChIA-PET data for three-dimensional genomic organization
- Statistical correlation: Identify significant associations between epigenomic marks and expression across samples [68] [69]
Multi-omics Dimension Reduction
- Joint NMF (Non-negative Matrix Factorization): Simultaneously factorize multiple omics data matrices to identify shared latent factors
- Multi-Omic Factor Analysis (MOFA): Identify principal sources of variation across multiple data modalities
- Canonical Correlation Analysis (CCA): Maximize correlation between epigenomic and transcriptomic features [69]
Pathway and Network Analysis
- Over-representation Analysis: Test whether genes associated with differential epigenomic features are enriched in specific biological pathways
- Gene Set Enrichment Analysis (GSEA): Examine whether genes in predefined sets show concordant epigenomic and transcriptomic changes
- Regulatory Network Inference: Reconstruct gene regulatory networks using both expression and chromatin state data [70] [69]
The Scientist's Toolkit: Essential Research Reagents and Platforms
Table 3: Key Research Reagent Solutions for Integrated Omics Studies
| Reagent/Platform | Function | Application Notes |
|---|---|---|
| Kits for DNA/RNA Extraction | Simultaneous isolation of genomic DNA and total RNA | Maintains paired epigenomic-transcriptomic data from same sample; critical for integration |
| Bisulfite Conversion Kits | Chemical treatment for methylation analysis | Efficiency >99% critical; DNA degradation minimization important |
| Tn5 Transposase | Enzyme for ATAC-seq library preparation | Commercial preparations ensure consistent tagmentation efficiency |
| ChIP-grade Antibodies | Specific enrichment of histone modifications | Validated for species and application; crucial for reproducible ChIP-seq |
| Library Prep Kits | Preparation of sequencing libraries | Barcoding enables sample multiplexing; UMI incorporation reduces duplicates |
| Methylation Standards | Controls for methylation analysis | Include fully methylated and unmethylated DNA for assay calibration |
| Epigenetic Modulators | Chemical probes for mechanistic studies | DNMT inhibitors, HDAC inhibitors for functional validation |
Applications in Environmental Health Research
Mechanistic Insights into Toxicant Action
Integrated epigenomic-transcriptomic approaches have revealed fundamental mechanisms through which environmental contaminants disrupt biological systems:
Endocrine Disrupting Chemicals (EDCs)
- Bisphenol A (BPA) and phthalates induce widespread changes in DNA methylation and histone modifications at genes involved in hormonal signaling and metabolic regulation [68] [65]. These changes often exhibit sex-specific patterns and can persist into adulthood following developmental exposure.
Particulate Matter (PM2.5)
- Air pollution components alter chromatin accessibility and histone marks at inflammatory gene promoters, providing a mechanistic basis for the established link between PM2.5 exposure and respiratory/cardiovascular disease [68] [72].
Metals and Metalloids
- Arsenic and lead exposure associated with DNA methylation changes in transposable elements (e.g., LINE-1) and imprinted genes, with implications for neurodevelopmental toxicity and carcinogenesis [68] [69].
Biomarker Discovery and Exposure Assessment
Epigenomic marks serve as sensitive biomarkers of environmental exposure due to their dynamic nature and stability in stored samples:
DNA Methylation Clocks
- Environmental exposures can accelerate epigenetic aging, as measured by epigenetic clocks. Systematic reviews have identified strong associations between air pollution, cigarette smoke, and synthetic chemicals with increased epigenetic age acceleration [72].
Surrogate Tissue Applications
- Blood-based epigenomic markers can reflect exposures and effects in target tissues, enabling minimally invasive biomonitoring. The TaRGET II consortium established correlative exposure signatures between liver (target tissue) and blood (surrogate tissue) [68].
The integration of epigenomics and transcriptomics within exposure science represents a paradigm shift in environmental health research. By simultaneously capturing regulatory inputs and transcriptional outputs, these approaches provide unprecedented insight into how environmental contaminants reprogram biological systems. The establishment of large-scale resources like the TaRGET II dataset, comprising thousands of epigenomic and transcriptomic profiles, demonstrates the power of systematic toxicant screening [68].
Future directions in the field include:
- Single-cell multi-omics: Resolving cell-type-specific responses to environmental exposures
- Spatial transcriptomics/epigenomics: Mapping molecular responses within tissue architecture
- Longitudinal profiling: Capturing dynamic responses across the lifespan
- Cross-species integration: Translating findings from model systems to human health
As the field advances, integrated omics approaches will play an increasingly central role in identifying susceptible populations, deciphering mechanisms of environmental disease, and developing targeted intervention strategies for contaminants of emerging concern.
Overcoming Analytical and Regulatory Hurdles in CEC Management
Challenges in Complex Matrix Analysis and Achieving Detection Sensitivity
The accurate assessment of environmental exposure and effects of contaminants of emerging concern (CECs) is fundamentally constrained by two interconnected analytical challenges: the complexity of environmental matrices and the imperative to achieve ultra-trace level detection sensitivity. CECs, including pharmaceuticals, personal care products, per- and polyfluoroalkyl substances (PFAS), endocrine-disrupting chemicals (EDCs), and microplastics, are typically present in environmental samples at exceptionally low concentrations (parts-per-trillion or lower) amidst a background of complex biological and chemical interferents [26] [3]. This combination demands sophisticated analytical approaches to generate reliable data for ecological and health risk assessment. Understanding these challenges is crucial for developing robust monitoring strategies and interpreting exposure data within a broader environmental health framework.
The environmental behavior of CECs is influenced by their physicochemical properties, leading to widespread distribution across aquatic systems, soils, and biota [26]. However, the technical capacity to detect and quantify these substances has only recently advanced to the point where trace-level characterization becomes feasible outside specialized laboratories. As regulatory attention on CECs intensifies—with links to endocrine disruption, antibiotic resistance, and ecological damage—the demand for precise, sensitive, and matrix-resistant analytical methods has become increasingly urgent [3] [5]. This technical guide examines the core challenges and solutions for analyzing CECs in complex environmental matrices, providing researchers with detailed methodologies to enhance data quality and reliability.
Core Analytical Challenges
Matrix Effects: Definition and Impact
Matrix effects represent a fundamental challenge in quantitative analysis, particularly when using liquid chromatography-mass spectrometry (LC-MS). These effects occur when compounds co-eluting with the target analyte interfere with the ionization process in the MS detector, causing either ionization suppression or enhancement [73]. The consequences directly impact data quality, affecting method accuracy, reproducibility, and sensitivity [73]. In environmental sampling, where target analytes exist at minute concentrations alongside abundant interferents, even minor matrix effects can generate significant quantitative errors.
The mechanisms behind matrix effects are multifaceted. One theoretical framework suggests that co-eluting interfering compounds, particularly basic compounds, may deprotonate and neutralize analyte ions, reducing the formation of protonated analyte ions [73]. An alternative theory posits that less-volatile compounds affect charged droplet formation efficiency, thereby reducing the conversion of these droplets into gas-phase ions [73]. Additionally, high-viscosity interfering compounds may increase the surface tension of charged droplets, further compromising droplet evaporation efficiency [73]. Understanding these mechanisms is essential for developing effective mitigation strategies.
Sensitivity Requirements for CEC Detection
The ultra-trace concentrations at which CECs typically occur in environmental samples necessitate exceptional analytical sensitivity. For many pharmaceuticals and endocrine-disrupting compounds, biological effects can be observed at concentrations as low as nanograms per liter, pushing the detection capabilities of conventional instrumentation to their limits [26] [3]. This sensitivity requirement is further complicated by the need to detect not only parent compounds but also their metabolites and transformation products, which may exhibit different analytical behaviors and potentially greater toxicity than their precursors [26].
The environmental relevance of detection sensitivity is underscored by the documented impacts of CECs on aquatic ecosystems. For example, endocrine-disrupting chemicals have been shown to induce reproductive abnormalities in fish populations at exposure levels challenging to detect without advanced instrumentation [3]. Similarly, the assessment of micro- and nano-plastics (MNPs) toxicity is complicated by difficulties in quantifying environmental concentrations and characterizing particle sizes, especially as plastics degrade into progressively smaller fractions [26]. These analytical limitations directly impact the quality of risk assessments and the development of protective environmental policies.
Methodological Approaches for Matrix Effect Management
Detection and Assessment of Matrix Effects
Several technical approaches exist for detecting and assessing matrix effects in analytical methods:
Post-extraction Spike Method: This technique evaluates matrix effects by comparing the signal response of an analyte in neat mobile phase with the signal response of an equivalent amount of the analyte spiked into a blank matrix sample after extraction [73]. The difference in response quantifies the extent of matrix effects. A significant limitation of this approach is that for endogenous analytes (such as certain metabolites), a truly blank matrix is often unavailable [73].
Post-column Infusion Method: This qualitative assessment involves infusing a constant flow of analyte into the HPLC eluent followed by injection of a blank sample extract [73]. Variations in the signal response of the infused analyte caused by co-eluting interfering compounds indicate regions of ionization suppression or enhancement in the chromatogram. While valuable for method development, this approach is time-consuming, requires additional hardware, and presents challenges for multi-analyte samples [73].
Alternative Detection Method: Research indicates a simpler approach based on recovery can be applied to detect matrix effects for any analyte, including endogenous compounds, in any matrix without additional hardware [73]. This method offers practical advantages for routine analysis where comprehensive matrix effect characterization is needed across multiple sample types.
Strategies for Overcoming Matrix Effects
Sample Preparation and Chromatographic Optimization
Strategic sample preparation and chromatographic separation form the first line of defense against matrix effects:
Sample Cleanup and Dilution: Optimizing sample preparation to remove interfering compounds represents a fundamental approach to reducing matrix effects [73]. However, most cleanup methods struggle to remove impurities chemically similar to the analyte, which are most likely to co-elute and cause interference [73]. Sample dilution can be effective when method sensitivity is sufficiently high, but this approach may compromise detection limits for trace-level CECs [73].
Chromatographic Resolution: Modifying chromatographic conditions to achieve temporal separation of analytes from interfering compounds can significantly reduce matrix effects [73]. This may involve adjusting mobile phase composition, gradient profiles, or column chemistry. However, this approach can be time-consuming, and some mobile phase additives have been found to suppress electrospray ionization signals [73]. Additionally, even in meticulously prepared samples, trace impurities in mobile phases can significantly suppress analyte peaks [73].
Table 1: Sample Preparation Techniques for Matrix Effect Reduction
| Technique | Mechanism | Advantages | Limitations |
|---|---|---|---|
| Solid Phase Extraction (SPE) | Selective retention of analytes or interferents | Effective for many compound classes; can be automated | May not remove structurally similar interferents |
| Liquid-Liquid Extraction | Partitioning based on solubility differences | Good for non-polar compounds; simple implementation | Limited effectiveness for polar compounds |
| Sample Dilution | Reduces concentration of interferents | Simple; preserves analyte integrity | Compromises sensitivity; not suitable for trace analysis |
| Selective Precipitation | Removes macromolecular interferents | Effective for protein removal | Potential analyte co-precipitation |
Calibration Techniques for Matrix Effect Compensation
When matrix effects cannot be eliminated through sample preparation or chromatography, specialized calibration techniques provide essential compensation:
Stable Isotope-Labeled Internal Standards (SIL-IS): This approach represents the gold standard for compensating matrix effects in quantitative LC-MS [73]. The chemical similarity and nearly identical chromatography between the analyte and its stable isotope-labeled analogue ensure that both experience virtually identical matrix effects, allowing for accurate correction. The primary limitations include significant expense and limited commercial availability for some CECs [73].
Standard Addition Method: Widely used in spectroscopic techniques, standard addition involves spiking samples with known concentrations of analyte [73]. This method does not require a blank matrix and is therefore appropriate for compensating matrix effects for any analyte, including endogenous metabolites in biological fluids [73]. Research demonstrates its potential application in LC-MS analysis to obtain improved data despite matrix effects [73].
Structural Analogue Internal Standards: Using a co-eluting structural analogue of the analyte as an internal standard presents a cost-effective alternative to SIL-IS [73]. While these compounds have been used to extend the linear range of calibration curves, evidence supports their utility in compensating matrix effects in routine LC-MS analysis, provided they exhibit similar chromatography and ionization characteristics to the target analyte [73].
Table 2: Quantitative Comparison of Matrix Effect Compensation Methods
| Compensation Method | Matrix Effect Correction Efficiency | Cost Considerations | Practical Implementation |
|---|---|---|---|
| Stable Isotope-Labeled IS | Excellent (typically >90%) | High cost; specialty chemicals | Requires commercially available standards |
| Standard Addition | Good to excellent (varies by matrix) | Moderate (increased sample preparation) | Time-consuming; multiple injections per sample |
| Structural Analogue IS | Good (70-90%) | Low to moderate | Requires identification of suitable analogue |
| Matrix-Matched Calibration | Variable | Moderate (requires blank matrix) | Challenging to match diverse sample matrices |
| External Calibration | Poor | Low cost | Simple but inaccurate with significant matrix effects |
Advanced Analytical Techniques for Enhanced Sensitivity
Instrumental Approaches for Trace-Level Detection
Advanced instrumentation forms the cornerstone of sensitive CEC detection:
High-Resolution Mass Spectrometry (HRMS): Instruments such as LC-HRMS/MS and GC-HRMS provide the exceptional sensitivity and selectivity required for CEC detection in complex matrices [26]. These techniques enable simultaneous screening, identification, and quantification of numerous contaminants, even without reference standards in some applications. The high mass accuracy and resolution capabilities help distinguish target analytes from isobaric interferences present in environmental samples.
Tandem Mass Spectrometry: The combination of multiple mass analysis stages, particularly in triple quadrupole instruments operating in Multiple Reaction Monitoring (MRM) mode, offers superior sensitivity and selectivity for targeted quantification of specific CECs [26]. The monitoring of specific precursor-product ion transitions significantly reduces chemical noise, enabling lower detection limits essential for assessing truly trace-level contaminants.
Pyrolysis Gas Chromatography-Mass Spectrometry (Py-GC-MS): For complex polymeric contaminants like microplastics, Py-GC-MS provides a powerful analytical solution without extensive sample cleanup [74]. Research demonstrates that for polymers such as polystyrene and polypropylene in wastewater, matrix components may not significantly interfere with analytical determination, suggesting potential for direct analysis with minimal pretreatment [74]. However, comprehensive method validation remains essential, as analyzing samples without matrix reduction may increase instrumental maintenance requirements [74].
Complementary Detection Techniques
Beyond mass spectrometry, several complementary techniques enhance CEC characterization:
Immunoassays: Techniques such as enzyme-linked immunosorbent assay (ELISA) provide sensitive, selective detection for specific compound classes, particularly when handling large sample volumes [26]. While potentially offering less comprehensive contaminant profiling than chromatographic techniques, immunoassays deliver cost-effective screening capabilities valuable for initial sample assessment.
Biosensors: Emerging biosensor technologies harness biological recognition elements to detect specific CECs or classes with minimal sample preparation [26]. These systems offer potential for real-time monitoring and field deployment, addressing critical gaps in traditional laboratory-based analysis.
Molecular Tools: Techniques including polymerase chain reaction (PCR) prove essential in detecting biologically active contaminants and pathogens, particularly those contributing to antibiotic resistance spread in environmental compartments [26].
Experimental Protocols for CEC Analysis
Protocol for 3D Spheroid Models in Toxicity Assessment
The following protocol adapts 3D cell culture models for assessing CEC effects, providing a physiologically relevant system for toxicity screening:
Spheroid Formation:
- Prepare 50 μL agarose gels in each well of a 96-well polystyrene cell culture plate [75].
- Fluorescently label cells with CellTracker Green CDMFA (10 μM) to enable visualization [75].
- Deposit 1000 fluorescently labeled cells into each well [75].
- Centrifuge the plate at 20°C, 400 rcf for 10 minutes [75].
- Incubate at 37°C with 5% CO₂ for 4 days to allow spheroid formation [75].
Collagen Gel Encapsulation for Matrix Interaction Studies:
- Prepare collagen gels by adding 0.5 N NaOH to neutralize a mixture containing double-distilled H₂O, 10× PBS, and acetic acid-solubilized type I rat tail collagen for a final collagen concentration of 2 mg/mL [75].
- Add carboxylated polystyrene fluorescent microspheres to track collagen movement [75].
- Add treatment compounds to the mixture before collagen polymerization [75].
- Pipette 50 μL of the collagen gel mixture into each well of a polydopamine-coated 24-well glass-bottomed plate kept on an ice pack [75].
- Transfer spheroids to the collagen mixture using a wide-tip pipette [75].
- Transfer the plate to an incubator and allow collagen to polymerize for 1 hour at 37°C with 5% CO₂ [75].
- Flip the plate several times at the beginning of gelation to prevent spheroid sedimentation [75].
- After polymerization, add fresh media with appropriate treatments to each well [75].
Imaging and Analysis:
- Image spheroids using a confocal microscope maintained at 37°C with 5% CO₂ [75].
- For each gel, image a ~250 μm-thick z-stack with a 5 μm z-step size [75].
- Perform time-lapse microscopy over the first 12 hours and single-time-point snapshots on day 5 [75].
- Quantify spheroid-matrix interactions using metrics such as spheroid-collagen pulling velocity, collagen density around spheroids, and spheroid hole formation [75].
Protocol for Matrix Effect Assessment in LC-MS
A streamlined protocol for detecting matrix effects in quantitative LC-MS analysis:
Sample Preparation:
Chromatographic Conditions:
- Utilize a 150 mm × 2.1 mm, 4-μm dp Cogent Diamond-Hydride 100Å column [73].
- Employ gradient elution: mobile phase B varied from 90% to 50% over 20 minutes, maintained at 50% for 1 minute, then returned to 90% from 21 to 24 minutes [73].
- Maintain flow rate at 200 μL/min with 10 μL injection volume [73].
- Use mobile phase A: deionized water with 0.1% formic acid; mobile phase B: acetonitrile with 0.1% formic acid [73].
Mass Spectrometry Conditions:
- Operate in positive multiple reaction monitoring (MRM) mode [73].
- Optimize MS parameters: ion spray voltage 5000 V; entrance potential 10 V; declustering potentials 26-36 V depending on analyte; focusing potentials 140-250 V; collision energy 29 V [73].
- Maintain gas flows: curtain gas 12, nebulizer gas 8, collision gas 4 (arbitrary units) [73].
- Set ion spray temperature to 300°C [73].
The Scientist's Toolkit: Essential Research Reagents and Materials
Table 3: Key Research Reagents for Complex Matrix Analysis
| Reagent/Material | Specification | Application in CEC Analysis |
|---|---|---|
| Stable Isotope-Labeled Internal Standards | Deuterated or ¹³C-labeled analogues of target analytes | Gold standard for matrix effect compensation in quantitative MS [73] |
| Type I Collagen | Rat tail, acetic acid solubilized | 3D matrix for cell spheroid cultures to study cell-matrix interactions [75] |
| CellTracker Green CDMFA | 10 μM in DMSO | Fluorescent cell labeling for spheroid visualization and tracking [75] |
| Carboxylated Polystyrene Fluorescent Microspheres | 0.5-1.0 μm diameter | Tracing collagen movement and matrix remodeling in 3D cultures [75] |
| Formic Acid | LC-MS grade, 0.1% in mobile phase | Mobile phase additive for improved chromatographic separation and ionization [73] |
| Polydopamine Coating | 0.5 mg/mL in Tris/HCl buffer, pH 8.5 | Surface treatment to promote collagen gel adhesion to culture plates [75] |
| Ultra-Low Attachment Plates | 96-well, round-bottom | Facilitating spheroid formation by preventing cell adhesion [76] |
| C18 Solid Phase Extraction Cartridges | 500 mg/6 mL, high-purity | Sample cleanup and preconcentration of CECs from aqueous environmental samples |
Workflow and Relationship Visualizations
Analytical Challenges and Solutions Workflow
Experimental Workflow for Complex Matrix Analysis
The analysis of contaminants of emerging concern in complex environmental matrices presents significant challenges related to matrix effects and detection sensitivity. These challenges necessitate sophisticated analytical strategies combining robust sample preparation, advanced instrumentation, and appropriate calibration techniques. The methodologies detailed in this guide—from 3D spheroid models for toxicity assessment to LC-MS protocols with matrix effect compensation—provide researchers with practical approaches to overcome these limitations. As the field advances, addressing the global data imbalance in CEC research and incorporating diverse environmental samples will be essential for developing comprehensive risk assessments and effective mitigation strategies. The integration of these analytical advancements within a broader environmental health framework will ultimately strengthen our capacity to understand and manage the impacts of emerging contaminants on ecosystems and human health.
The study of contaminants of emerging concern (CECs), including pharmaceuticals and personal care products (PPCPs), represents a critical frontier in environmental science. These compounds are increasingly detected at low levels in surface waters, posing potential risks to aquatic life that are not yet fully understood [3]. Researchers in this field face an unprecedented challenge of data overload, characterized by complex, high-volume datasets generated from modern analytical techniques. This data deluge encompasses chemical concentration measurements, biological effect indicators, temporal and spatial variables, and environmental parameters—creating a pressing need for sophisticated quality assurance and advanced statistical interpretation methods. Within the broader context of environmental exposure and effects research, managing this information complexity is paramount for deriving meaningful insights about CEC impacts on ecosystem health.
The technical challenges are substantial. CECs often demonstrate low acute toxicity while causing significant reproductive effects at minimal exposure levels, and impacts on aquatic organisms during early life stages may not manifest until adulthood [3]. These phenomena necessitate specialized testing methodologies and endpoints beyond traditional toxicity assessment, further complicating data interpretation. This whitepaper provides researchers, scientists, and drug development professionals with a comprehensive framework for navigating data overload through rigorous quality assurance protocols, appropriate statistical visualization techniques, and advanced interpretation methodologies specifically tailored to CEC research.
Data Presentation: Quantitative Summaries for CEC Research
Effective management of data overload begins with structured presentation of quantitative information. The tables below demonstrate proper summarization of CEC research data for clear comparison and interpretation.
Table 1: Summary statistics for gorilla chest-beating rate study (beats per 10 hours) [77]
| Group | Mean | Standard Deviation | Sample Size (n) |
|---|---|---|---|
| Younger Gorillas (<20 years) | 2.22 | 1.270 | 14 |
| Older Gorillas (≥20 years) | 0.91 | 1.131 | 11 |
| Difference | 1.31 | - | - |
Table 2: Comparative analysis of household characteristics in water access study [77]
| Variable | All Households with Children (n=85) | Households with Diarrhoea Incidents (n=26) | Households without Diarrhoea Incidents (n=59) |
|---|---|---|---|
| Woman's Age (years) | |||
| Mean | 40.2 | 45.0 | 38.1 |
| Median | 37.0 | 46.5 | 35.0 |
| Standard Deviation | 13.90 | 14.04 | 13.44 |
| IQR | 28.00 | 28.50 | 22.50 |
| Household Size | |||
| Mean | 8.4 | 10.5 | 7.5 |
| Median | 7.0 | 8.5 | 6.0 |
| Standard Deviation | 4.93 | 6.51 | 3.78 |
| IQR | 6.00 | 7.75 | 4.50 |
Table 3: Class interval frequency distribution for male subject weights in nutrition study [78]
| Weight Interval (pounds) | Frequency |
|---|---|
| 120 – 134 | 4 |
| 135 – 149 | 14 |
| 150 – 164 | 16 |
| 165 – 179 | 28 |
| 180 – 194 | 12 |
| 195 – 209 | 8 |
| 210 – 224 | 7 |
| 225 – 239 | 6 |
| 240 – 254 | 2 |
| 255 – 269 | 3 |
These structured presentations enable researchers to quickly identify patterns, outliers, and relationships within complex datasets—a crucial first step in overcoming data overload challenges in CEC research.
Experimental Protocols: Methodologies for CEC Assessment
EPA Technical Framework for CEC Evaluation
The U.S. Environmental Protection Agency has developed a specialized framework for assessing CECs that present unique methodological challenges. The White Paper Aquatic Life Criteria for Contaminants of Emerging Concern: Part I Challenges and Recommendations details technical issues and recommendations that modify the 1985 guidelines to better address CECs [3]. This protocol is particularly relevant for compounds acting as endocrine disruptors (EDCs), which alter normal hormonal functions and cause various health effects, particularly reproductive impacts in aquatic organisms.
Key methodological considerations include:
- Specialized Testing Protocols: Development of testing methodologies not typically available in standard toxicity assessment, with endpoints not previously evaluated using current guidelines.
- Life-Stage Exposure Tracking: Implementation of longitudinal studies that track exposure during early developmental stages with observational continuity through adulthood.
- Mode-of-Specific Action Assessment: Design of experiments that account for specific modes of action that may affect only certain types of aquatic animals (e.g., vertebrates such as fish).
Comparative Experimental Design for Quantitative Data
For studies comparing quantitative data between groups, such as investigating CEC effects across different species or exposure levels, specific methodological approaches ensure statistical robustness:
- Group Sizing and Power Analysis: Determination of appropriate sample sizes to detect meaningful differences between groups, as demonstrated in the gorilla behavior study (n=14 younger, n=11 older) [77].
- Data Collection Standardization: Implementation of consistent measurement protocols across all experimental groups to minimize technical variance.
- Baseline Characterization: Comprehensive profiling of pre-existing conditions across study groups, as exemplified by the household characteristic analysis in water access research [77].
- Longitudinal Monitoring: For CEC studies, incorporation of temporal sampling to account for fluctuating exposure levels and delayed biological effects.
These methodological frameworks provide the structural foundation for generating high-quality, interpretable data in complex CEC research environments characterized by multiple variables and potential confounding factors.
Mandatory Visualization: Workflow Diagrams for CEC Research
Effective visualization is critical for managing data overload in CEC research. The following diagrams illustrate key workflows and relationships using DOT language with compliance to specified color contrast requirements [79] [80] [81].
CEC Research Workflow
Data Analysis Pathway
CEC Mode of Action
These visualizations employ the specified color palette while maintaining sufficient contrast between foreground and background elements as required by WCAG guidelines [79] [80]. The diagrams provide clear, interpretable representations of complex processes that researchers encounter in CEC studies.
The Scientist's Toolkit: Research Reagent Solutions for CEC Analysis
Table 4: Essential research reagents and materials for CEC analysis
| Reagent/Material | Function | Application in CEC Research |
|---|---|---|
| Solid Phase Extraction (SPE) Cartridges | Sample cleanup and concentration | Isolation of CECs from complex water matrices prior to analysis |
| Isotope-Labeled Internal Standards | Quantification accuracy | Correction for matrix effects and extraction efficiency variability in mass spectrometry |
| LC-MS/MS Mobile Phase Reagents | Chromatographic separation | High-resolution separation of CEC compounds in liquid chromatography systems |
| Quality Control Materials | Data quality assurance | Verification of analytical method performance and instrument calibration |
| Reference Standard Materials | Compound identification and quantification | Confirmation of CEC identity and establishment of calibration curves |
| Biological Assay Kits | Endocrine disruption screening | Detection of estrogenic, androgenic, or thyroid-active compounds in environmental samples |
| Sample Preservation Reagents | Analytic stability | Maintenance of CEC integrity between collection and analysis |
Advanced Statistical Interpretation for CEC Data
Graphical Methods for Data Comparison
Appropriate visualization techniques are essential for interpreting complex CEC datasets. Several graphical methods prove particularly valuable:
- Back-to-Back Stemplots: Effective for comparing two groups with small datasets, preserving original data values while highlighting distribution differences [77].
- 2-D Dot Charts: Ideal for small to moderate datasets, displaying individual observations while facilitating group comparisons through stacking or jittering to avoid overplotting [77].
- Boxplots (Parallel Boxplots): Optimal for most comparative scenarios, visually representing five-number summaries (minimum, Q1, median, Q3, maximum) and identifying potential outliers using the IQR rule [77].
- Comparative Histograms: Useful for displaying frequency distributions across different experimental conditions or exposure groups [78].
- Frequency Polygons: An alternative to histograms that emphasize distribution shapes and facilitate comparison of multiple datasets through overlapping lines [78].
Selecting Appropriate Comparison Charts
Choosing the right visualization method is critical for effective data interpretation. The following guidelines apply to CEC research:
- Bar Charts: Most appropriate for comparing categorical data or summary statistics across different groups [82].
- Histograms: Ideal for displaying distribution of numerical variables measured in intervals, such as concentration ranges or physiological measurements [82] [78].
- Line Charts: Effective for illustrating trends over time, such as fluctuating CEC concentrations or biological responses across sampling periods [82].
- Boxplots: Superior for comparing distributions across multiple groups while maintaining visibility of potential outliers [77].
Addressing Technical Challenges in CEC Data Interpretation
CEC research presents unique statistical challenges that require specialized approaches:
- Low Concentration Effects: Traditional dose-response relationships may not apply when CECs demonstrate effects at trace levels, necessiting specialized statistical models that account for non-monotonic response curves [3].
- Delayed Manifestation of Effects: Statistical methods must accommodate the temporal disconnect between exposure during early life stages and observed effects in adulthood, requiring longitudinal analysis techniques [3].
- Endocrine-Specific Endpoints: Standard toxicity endpoints may not capture the subtle reproductive and developmental impacts of EDCs, demanding specialized metrics and corresponding statistical approaches [3].
- Multivariate Complexity: The interplay of multiple CECs in environmental mixtures requires advanced multivariate statistical methods to disentangle compound-specific effects from mixture interactions.
Through implementation of these quality assurance measures, visualization techniques, and statistical interpretation frameworks, researchers can effectively navigate data overload challenges in CEC research, transforming complex datasets into actionable scientific insights regarding environmental exposure and effects.
Limitations of Current Wastewater Treatment and Remediation Technologies
The presence of contaminants of emerging concern (CECs) in global water resources represents a critical challenge for modern environmental management and public health protection. These contaminants, including pharmaceuticals, personal care products, per- and polyfluoroalkyl substances (PFAS), microplastics, endocrine disruptors, and antibiotic resistance genes, increasingly bypass conventional wastewater treatment systems designed for traditional pollutants [8] [83] [3]. Their continuous introduction into aquatic environments via wastewater effluent discharge, industrial outputs, and agricultural runoff creates a persistent exposure scenario for ecosystems and humans [8]. This whitepaper examines the technical limitations of existing wastewater treatment and remediation technologies within the context of environmental exposure research, highlighting the critical gaps that hinder effective risk mitigation of CECs.
The environmental persistence of CECs is particularly concerning due to their bioaccumulative potential and transformational products that may exhibit unknown toxicological profiles [83]. Unlike conventional pollutants, many CECs are designed to be biologically active at low concentrations, as in the case of pharmaceuticals, creating potential for unintended ecological consequences including hormonal disruptions in aquatic organisms and the proliferation of antibiotic-resistant bacteria [83] [3]. Understanding the limitations of current treatment approaches is fundamental to developing more effective remediation strategies and framing comprehensive environmental exposure assessments.
Technical Limitations of Conventional Treatment Systems
Inherent Design Deficiencies for Complex Contaminants
Conventional wastewater treatment plants (WWTPs) were principally engineered to remove easily degradable organic matter, nutrients, and suspended solids, not the diverse array of synthetic CECs that now permeate waste streams [8] [84]. The physical and chemical characteristics of many CECs, including their high water solubility and structural complexity, render them resistant to traditional biological degradation processes that form the core of secondary treatment [8]. This fundamental design mismatch results in variable and often insufficient removal efficiencies, allowing CECs to persist through treatment trains and enter receiving waters [84].
The activated sludge process, the most widely implemented secondary treatment technology globally, demonstrates particularly inconsistent performance for CEC removal. Operational parameters such as sludge retention time (SRT) and hydraulic retention time (HRT) significantly influence microbial community composition and metabolic capability, yet most facilities operate at conditions that favor nutrient removal rather than CEC degradation [84]. Furthermore, the transformation products generated through incomplete microbial metabolism of pharmaceuticals may retain biological activity or exhibit increased toxicity compared to parent compounds, creating alternative exposure pathways that are rarely monitored or addressed in conventional systems [83].
Quantitative Assessment of Treatment Inefficiencies
Comprehensive evaluation of WWTP performance data reveals systematic limitations in removing specific contaminant classes. The table below summarizes documented removal efficiencies for major CEC categories across conventional treatment technologies.
Table 1: Documented Removal Efficiencies for Contaminants of Emerging Concern in Conventional Wastewater Treatment Plants
| Contaminant Category | Examples | Typical Removal Efficiency (%) | Primary Removal Mechanism | Key Limitations |
|---|---|---|---|---|
| Pharmaceuticals | Antibiotics, analgesics, antidepressants | Highly variable (0-90%) [84] | Biodegradation, sorption | Structure-dependent removal; transformation products formed |
| Personal Care Products | Synthetic musks, UV filters | 30-80% [83] | Biodegradation, volatilization | Lipophilic compounds accumulate in sludge |
| Per- and Polyfluoroalkyl Substances (PFAS) | PFOA, PFOS | Negligible to low [8] | Sorption (limited) | High persistence; conventional treatments largely ineffective |
| Endocrine Disrupting Compounds | Bisphenol A, natural and synthetic hormones | 20-90% [3] | Biodegradation | Low-dose effects; removal often incomplete |
| Microplastics | Microbeads, fibers | 70-98% [8] | Physical separation | Incomplete removal; nanoplastics bypass treatment |
| Antibiotic Resistance Genes | sul1, tetW, blaTEM | Variable (may increase during treatment) [85] | Not primarily targeted | Biological treatment may select for resistant bacteria |
The data illustrates that removal performance varies significantly across contaminant classes, with particularly concerning persistence observed for PFAS compounds and certain pharmaceutical transformations [8] [84]. This variability stems from both chemical-specific properties (hydrophobicity, functional groups, molecular structure) and system-specific operational conditions that collectively determine contaminant fate [83]. The inability of conventional treatment to consistently address this broad spectrum of CECs creates a complex mixture of residual contaminants in effluents, leading to continuous environmental exposure despite treatment.
Operational and Analytical Challenges
Beyond core technological limitations, WWTPs face significant operational hurdles in addressing CECs. Many facilities, particularly in rapidly urbanizing regions, struggle with equipment malfunctions, influent flow rate fluctuations, and limited hydraulic capacity that compromise even baseline treatment performance [86]. A study of WWTPs in Addis Ababa found that 86.4% of facilities reported flow rate fluctuations while 64.5% acknowledged capacity limitations, creating conditions where basic treatment objectives are challenging, much less the removal of trace contaminants [86].
Analytical limitations further complicate the situation. The detection and quantification of CECs requires sophisticated instrumentation such as liquid chromatography with tandem mass spectrometry (LC-MS/MS), which remains cost-prohibitive for routine monitoring in most operational settings [8]. Additionally, the lack of standardized analytical methods and reference materials for emerging contaminants hampers consistent assessment and comparison of treatment efficacy across different facilities and studies [83]. This analytical gap impedes both performance monitoring and regulatory enforcement, allowing CECs to persist undetected in treatment systems.
Limitations of Advanced Treatment Technologies
Performance Gaps in Engineered Solutions
Advanced treatment technologies offer improved removal capabilities for specific CECs but introduce their own limitations. Advanced oxidation processes (AOPs) utilizing ozone, UV/hydrogen peroxide, or Fenton reactions effectively degrade many recalcitrant compounds but may generate transformation products of unknown toxicity and are compromised by scavenging effects of natural organic matter [85]. Membrane filtration technologies, including nanofiltration and reverse osmosis, achieve high removal rates for many CECs but produce concentrated brine streams that require specialized disposal and may facilitate the accumulation of contaminants in waste fractions [85].
The integration of activated carbon adsorption (powdered or granular) has shown promise for removing a broad spectrum of CECs through physical adsorption, but performance is highly dependent on carbon characteristics, contaminant properties, and water chemistry parameters such as pH and natural organic matter content [85]. Additionally, adsorption merely transfers contaminants from water to solid phase, creating saturated carbon that requires regeneration or disposal, potentially introducing new waste management challenges [84].
Table 2: Limitations of Advanced Treatment Technologies for CEC Removal
| Technology | Target Contaminants | Key Technical Limitations | Operational Constraints |
|---|---|---|---|
| Advanced Oxidation Processes | Pharmaceuticals, pesticides, endocrine disruptors | Formation of toxic transformation products; scavenging by natural water matrix | High energy demand; chemical requirements; skilled operation needed |
| Membrane Filtration | Broad spectrum CECs | Concentrated waste stream production; membrane fouling | High capital and maintenance costs; pre-treatment requirements |
| Activated Carbon Adsorption | Non-polar organic compounds, PFAS (limited) | Selective adsorption; competition from natural organics; early breakthrough | Regeneration energy intensity; performance monitoring complexity |
| Advanced Biological Treatment | Biodegradable pharmaceuticals, personal care products | Long adaptation periods; sensitivity to toxic shocks | Requires specialized microbial cultures; operational parameter precision |
| Hybrid Systems | Multiple CEC classes | Technology integration complexity; synergistic uncertainty | Increased control sophistication; higher capital investment |
Resource Intensiveness and Sustainability Concerns
Advanced treatment technologies typically demand substantial energy inputs, chemical consumption, and specialized operational expertise, creating economic and practical barriers to implementation, particularly in resource-limited settings [86]. The transition toward low-carbon treatment paradigms conflicts with the high energy demands of many advanced technologies, creating sustainability trade-offs that must be carefully balanced [87]. For example, while AOPs effectively degrade many CECs, their energy intensity may significantly increase the carbon footprint of wastewater treatment, potentially offsetting environmental benefits [87].
The financial implications of advanced treatment are particularly prohibitive for small communities and developing regions. A comprehensive study of wastewater treatment challenges identified financial constraints as a significant barrier in 70% of facilities, limiting their ability to implement even essential upgrades, much less advanced CEC-targeted technologies [86]. This economic reality creates a concerning disparity in water quality protection capabilities across different regions and communities.
Experimental Framework for Evaluating Treatment Limitations
Methodologies for Assessing Treatment Performance
Rigorous evaluation of treatment technology limitations requires standardized experimental approaches that simulate real-world conditions while controlling key variables. The following protocols outline methodologies for quantifying CEC removal efficiencies and identifying transformation products across different treatment technologies.
Protocol for Bench-Scale Treatment Performance Assessment
Objective: Quantify removal efficiency of target CECs across treatment technologies under controlled conditions.
- Sample Collection and Preparation: Collect influent wastewater from full-scale treatment plants. Pre-filter through 0.7 μm glass fiber filters to remove particulate matter. Spike with isotopically labeled internal standards for quantification.
- Bench-Scale Reactor Setup: Configure bench-scale systems to simulate target treatment processes (e.g., activated sludge reactors, AOP systems, membrane filtration units). Maintain precise operational control over hydraulic retention time, sludge retention time (for biological systems), and chemical doses.
- Experimental Operation: Operate systems under steady-state conditions (typically 3×HRT for biological systems) before sampling. Conduct time-course sampling at predetermined intervals (e.g., 0, 15, 30, 60, 120 minutes for AOPs; daily for biological systems).
- Sample Analysis: Extract samples using solid-phase extraction. Analyze via LC-MS/MS with simultaneous scanning for predicted transformation products using precursor ion scanning approaches.
- Data Analysis: Calculate removal efficiencies based on concentration differences. Apply data reconciliation techniques to improve data reliability [88].
Protocol for Transformation Product Identification
Objective: Identify and quantify transformation products formed during treatment processes.
- Non-Target Analysis: Employ high-resolution mass spectrometry (HRMS) with reverse-phase chromatography. Use data-dependent acquisition to fragment unknown features.
- Data Processing: Process raw data using non-target screening software (e.g., XCMS, MS-DIAL). Generate molecular formulas from accurate mass measurements.
- Structure Elucidation: Fragment interpretation and comparison with spectral databases (e.g., NIST, MassBank). Employ in-silico fragmentation tools when reference standards are unavailable.
- Confirmation: Synthesize or acquire suspected transformation products when possible for definitive confirmation using retention time and fragmentation pattern matching.
Data Quality Assessment and Reconciliation
Accurate evaluation of treatment limitations requires high-quality data verified through statistical validation techniques. Data reconciliation methods applied to WWTP operations can significantly improve measurement reliability by optimally adjusting variable estimates to satisfy conservation laws and other constraints [88]. Implementation of both linear and bilinear mass balance approaches enhances data quality, with bilinear methods demonstrating superior precision improvement for key wastewater parameters [88].
The experimental workflow below illustrates the integrated approach for evaluating treatment technologies, from initial system operation through data reconciliation and final interpretation.
Diagram 1: Experimental workflow for evaluating treatment limitations, incorporating analytical techniques and data validation methods.
Critical Research Gaps and Future Directions
Scientific and Technological Innovation Needs
Overcoming the limitations of current wastewater treatment technologies requires addressing fundamental research gaps through targeted scientific investigation. Priority areas include:
Advanced Material Development: Creation of selective adsorbents with enhanced affinity for problematic CEC classes, particularly PFAS and hydrophilic pharmaceuticals. Research should focus on molecularly imprinted polymers, surface-modified biochars, and high-capacity ion exchange resins with demonstrated efficacy across diverse water matrices [8].
Transformative Biological Processes: Exploration of novel microbial consortia and enzymatic pathways capable of mineralizing recalcitrant CECs. Investigation of anaerobic membrane bioreactors and metabolic engineering approaches presents promising avenues for enhancing biotransformation without excessive energy inputs [87].
Process Integration and Optimization: Development of intelligent hybrid systems that strategically combine physical, chemical, and biological unit processes to target specific CEC classes while minimizing energy and resource consumption. The LIFE PRISTINE project exemplifies this approach through integration of encapsulated adsorbents, hollow-fiber nanofiltration membranes, and UV-LED advanced oxidation processes [85].
Green Treatment Paradigms: Advancement of treatment technologies that align with circular economy principles, focusing on resource recovery alongside contaminant destruction. Promising approaches include nutrient recovery from wastewater streams and energy-positive treatment configurations that transform WWTPs from pollution control facilities to resource recovery centers [87].
The Researcher's Toolkit: Essential Analytical and Reagent Solutions
Comprehensive evaluation of treatment technologies requires specialized reagents, reference materials, and analytical standards. The following table details essential components of the researcher's toolkit for investigating CEC treatment limitations.
Table 3: Essential Research Reagents and Materials for CEC Treatment Studies
| Reagent/Material Category | Specific Examples | Research Application | Technical Considerations |
|---|---|---|---|
| Isotopically Labeled Standards | ¹³C- or ²H-labeled pharmaceuticals, PFAS, endocrine disruptors | Internal standards for mass spectrometry quantification; isotope dilution methods | Essential for accurate quantification; should be added prior to extraction to correct for losses |
| Solid-Phase Extraction Sorbents | Hydrophilic-lipophilic balanced polymers, mixed-mode cation/anion exchange, molecularly imprinted polymers | Pre-concentration of CECs from aqueous matrices; sample cleanup | Selection depends on target compound properties; required for achieving low detection limits |
| Reference Standards | Pharmaceutical compounds, pesticide metabolites, transformation products | Target compound identification and quantification; method development and validation | Certified reference materials preferred; purity documentation essential |
| Bioassay Kits | Yeast estrogen screen, bacterial luminescence toxicity assays, algal growth inhibition tests | Evaluation of treatment effectiveness based on toxicological endpoints | Assesses cumulative effects of contaminant mixtures; complements chemical-specific analysis |
| Advanced Oxidation Reagents | Hydrogen peroxide (isotopically labeled), sodium persulfate, titanium dioxide catalysts | Mechanism studies; transformation pathway elucidation | Isotopic labeling enables detailed mechanistic studies of radical reactions |
| Microbiological Media | Minimal salts media, specific electron donors/acceptors, inhibitor compounds | Enrichment of specialized degrading cultures; metabolic pathway studies | Allows isolation and characterization of CEC-transforming microorganisms |
The limitations of current wastewater treatment and remediation technologies in addressing contaminants of emerging concern present significant challenges for environmental exposure science and public health protection. Conventional treatment systems, designed for traditional pollutants, demonstrate inconsistent removal efficiencies for many CECs due to inherent design deficiencies, operational constraints, and analytical limitations [8] [84]. While advanced treatment technologies offer improved performance for specific contaminant classes, they introduce new challenges including transformation product formation, resource intensiveness, and economic barriers to implementation [85] [86].
Addressing these limitations requires a multidisciplinary research approach that integrates advanced material science, microbial ecology, process engineering, and data analytics to develop next-generation treatment solutions. Future research should prioritize the development of standardized monitoring protocols, comprehensive risk assessment frameworks that account for transformation products, and sustainable treatment approaches that align with circular economy principles [83] [87]. By systematically addressing these technological gaps through targeted scientific investigation, we can evolve wastewater treatment infrastructure to effectively mitigate the environmental exposure and ecological impacts of contaminants of emerging concern.
Addressing Regulatory Gaps and the Need for Standardized Methods
The rapid proliferation of emerging contaminants (ECs)—including pharmaceuticals, per- and polyfluoroalkyl substances (PFAS), microplastics, and endocrine-disrupting chemicals—has exposed critical vulnerabilities in global environmental governance frameworks. Current regulatory systems cover less than 1% of known environmental chemicals, creating substantial gaps that permit persistent ecological and public health risks [89]. This technical guide examines the scientific and regulatory challenges posed by ECs and proposes a standardized framework for identification, risk assessment, and management. By integrating advanced analytical techniques with predictive toxicology and validated experimental protocols, researchers and regulatory bodies can transition from reactive to proactive contaminant governance. The urgent need for standardized methods stems from the extensive diversity of ECs, their occurrence at low environmental concentrations, complex exposure pathways, and variable hazard profiles that complicate traditional risk assessment approaches [8] [89].
The Scale of the Regulatory Gap
Quantitative Assessment of Unregulated Contaminants
The disparity between the number of chemicals in commerce and those subject to regulatory control represents one of the most significant challenges in environmental science. The following table synthesizes key quantitative indicators of this regulatory gap:
Table 1: Registered vs. Regulated Chemical Substances
| Category | Number of Substances | Data Source | Context |
|---|---|---|---|
| Registered Chemicals | 219 million | Chemical Abstracts Service (CAS) [89] | Includes all chemicals and chemical mixtures recorded in the primary registry |
| Widely Used Chemicals | ~350,000 | Environmental tracking [89] | Substances with significant production volumes and potential environmental release |
| Internationally Regulated | 500-1,000 | International conventions and standards [89] | Represents <1% of widely used chemicals; includes Basel, Stockholm, and Rotterdam conventions |
| PFAS Social Cost | EUR 16 trillion | Socioeconomic impact assessment [89] | Estimated social cost of PFAS management compared to ~USD 4 billion industry profit |
This quantitative disparity demonstrates what researchers have termed the "tip of the iceberg" phenomenon in contaminant regulation, where controlled substances represent only a minute fraction of those potentially present in environmental compartments [89]. The consequences of this gap are profound: studies estimate that approximately 9 million premature human deaths annually can be attributed to global environmental pollution, with toxic chemical exposure contributing to over 1.8 million of these fatalities [89].
Classification and Properties of Emerging Contaminants
ECs encompass a diverse range of substances with varying properties and environmental behaviors. For systematic study and regulation, they can be categorized according to several key characteristics:
Table 2: Major Categories of Emerging Contaminants and Their Properties
| Contaminant Category | Representative Examples | Key Properties | Primary Sources |
|---|---|---|---|
| Per- and Polyfluoroalkyl Substances (PFAS) | PFOA, PFOS, GenX | Extreme persistence, bioaccumulative, mobile in water and soil | Industrial discharge, fire-fighting foams, consumer products |
| Pharmaceuticals and Personal Care Products | Antibiotics, antidepressants, cosmetics | Pseudopersistent, biologically active, resistant to conventional treatment | Wastewater effluents, agricultural runoff, landfill leachate |
| Microplastics and Nanomaterials | Plastic fragments, nanoparticles, plastic additives | Small particle size, large surface area, sorption capacity | Textile fibers, product degradation, industrial processes |
| Endocrine Disrupting Chemicals | Bisphenol A, phthalates, organophosphate esters | Hormone-mimicking, low-dose effects, non-monotonic dose responses | Plastics manufacturing, flame retardants, pesticides |
The environmental persistence and potential toxicity of these contaminants highlight the inadequacy of conventional wastewater treatment plants (WWTPs) in effectively removing ECs, allowing continuous introduction into aquatic systems [8]. This challenge is compounded by the fact that many ECs are not adequately monitored in environmental matrices, creating a cycle of incomplete risk assessment and regulatory inaction.
Critical Methodological Challenges
Analytical Limitations in Detection and Quantification
The accurate detection and quantification of ECs present substantial methodological hurdles due to their occurrence at trace concentrations (parts per trillion to parts per quadrillion) in complex environmental matrices [89]. Current analytical techniques face several limitations:
- Matrix Effects: Complex environmental samples (e.g., wastewater, biosolids, biological tissues) contain interfering substances that impede accurate quantification and require extensive sample clean-up and preconcentration steps [89].
- Lack of Standardized Protocols: Methodologies for detecting contaminants like microplastics vary significantly between studies, with inconsistencies in sampling strategies, material selection, and analytical techniques (e.g., visual microscopy, Fourier-transform infrared spectroscopy, Raman spectroscopy) that hinder cross-study comparisons [89].
- Sensitivity Requirements: Many ECs exert biological effects at concentrations approaching the detection limits of conventional instrumentation, necessitating advanced mass spectrometry-based approaches that may not be widely accessible [8].
Toxicity Assessment and Risk Characterization Barriers
Traditional toxicity assessment frameworks face practical and economic constraints when applied to the vast universe of ECs:
- Economic Burden: Traditional ecotoxicity testing for a single chemical costs approximately USD 118,000 on average, translating to a projected USD 1.18 billion for 10,000 chemicals—a prohibitive expense for comprehensive risk assessment [89].
- Temporal Constraints: Generating toxicity data that satisfies current chemical regulatory frameworks for a single substance requires extensive time investments, creating a critical bottleneck in the regulatory pipeline [89].
- Complex Mixture Effects: Environmental exposure typically involves complex mixtures of ECs, yet risk assessment frameworks predominantly focus on individual compounds, overlooking potential synergistic or antagonistic interactions [8].
The diagram below illustrates the complex workflow and significant time investment required for traditional chemical risk assessment, highlighting why this approach cannot keep pace with the introduction of new environmental contaminants:
Standardized Experimental Frameworks
Analytical Methods for Emerging Contaminant Detection
Robust analytical methods form the foundation for reliable EC monitoring and risk assessment. The following workflow outlines a comprehensive approach for sample processing, analysis, and data interpretation:
Detailed Protocol: Solid-Phase Extraction (SPE) and LC-MS/MS Analysis of PFAS in Water
Sample Collection: Collect water samples in polypropylene containers pre-rinsed with methanol and sample. Preserve with ammonium acetate (0.25% w/v) and store at 4°C until extraction [8].
Sample Preparation: Filter samples through 0.7 μm glass fiber filters to remove particulate matter. Adjust pH to 7.0 ± 0.5 using ammonium hydroxide or acetic acid.
Solid-Phase Extraction:
- Condition SPE cartridges (Oasis WAX or equivalent) with 5 mL methanol followed by 5 mL pH 4.0 Milli-Q water.
- Load 250 mL sample at flow rate of 5-10 mL/min.
- Dry cartridge under vacuum for 30 minutes.
- Elute with 5 mL methanol containing 1% ammonium hydroxide into polypropylene tubes.
Concentration: Evaporate eluent to near dryness under gentle nitrogen stream at 40°C. Reconstitute in 1 mL methanol/water (50:50, v/v) for analysis.
LC-MS/MS Analysis:
- Chromatography: Reverse-phase C18 column (100 × 2.1 mm, 1.8 μm); mobile phase A: 2 mM ammonium acetate in water; B: methanol. Gradient: 10% B to 90% B over 12 minutes.
- Mass Spectrometry: Electrospray ionization in negative mode; multiple reaction monitoring (MRM); optimize source temperature, desolvation gas flow, and collision energies for target analytes.
Quality Assurance: Include procedural blanks, matrix spikes, and duplicate samples with each batch (≤20 samples). Use isotope-labeled internal standards for quantification.
Advanced Tools for Predictive Toxicology
The economic and temporal constraints of traditional toxicity testing necessitate alternative approaches for prioritizing ECs for risk assessment. Quantitative Structure-Activity Relationship (QSAR) models and read-across methodologies provide scientifically valid tools for predicting chemical toxicity:
QSAR Model Validation Framework [90]:
- Defined Endpoint: Clearly specify the toxicological endpoint being predicted (e.g., endocrine disruption, mutagenicity).
- Unambiguous Algorithm: Ensure transparent mathematical representation of the structure-activity relationship.
- Defined Domain of Applicability: Establish boundaries for reliable prediction based on chemical structure.
- Appropriate Measures of Goodness-of-Fit: Validate predictive capability using standardized statistical parameters.
- Mechanistic Interpretation: Where possible, provide biological plausibility for the model predictions.
Read-Across Methodology [91]:
- Qualitative Read-Across: Applied for hazard identification through:
- Identification of chemical substructure or mode of action common to two substances
- Inference of presence/absence of property/activity for target substance from analogous substance
- Quantitative Read-Across: Used for property estimation through:
- Identification of chemical substructure or mode of action common to two substances
- Estimation of unknown property value for target substance from known value of analogous substance
Table 3: Research Reagent Solutions for Emerging Contaminant Analysis
| Reagent/Material | Application | Function in Analysis |
|---|---|---|
| Isotope-Labeled Internal Standards (e.g., 13C-PFOA, 15N-Pharmaceuticals) | Mass Spectrometry Quantification | Correct for matrix effects and analyte loss during sample preparation; enable precise quantification |
| Solid-Phase Extraction Cartridges (Oasis WAX, HLB, C18) | Sample Preparation | Concentrate target analytes from complex matrices; remove interfering compounds |
| Liquid Chromatography Columns (C18, HILIC, PFP) | Compound Separation | Resolve complex mixtures of ECs; reduce ion suppression in MS detection |
| Certified Reference Materials (NIST, ERA) | Quality Assurance | Validate analytical methods; ensure accuracy and comparability across laboratories |
| In Vitro Bioassay Kits (YES, ER-CALUX, Ames MPF) | Toxicity Screening | Rapid screening for specific toxicological endpoints (e.g., endocrine disruption, mutagenicity) |
| QSAR Software Tools (OECD QSAR Toolbox, EPI Suite) | Predictive Toxicology | Estimate physicochemical properties and toxicological hazards based on chemical structure |
Regulatory Integration and Standardization
Framework for Proactive Contaminant Governance
Addressing regulatory gaps requires a systematic approach that integrates scientific research with policy development. The following framework outlines essential components for proactive EC governance:
Prioritization Mechanism: Develop risk-based criteria for identifying high-priority ECs requiring immediate regulatory attention based on persistence, bioaccumulation potential, toxicity, and monitoring data [89].
Standardized Monitoring Programs: Implement consistent analytical methods and reporting requirements for ECs in environmental matrices to ensure data comparability. The U.S. EPA's Unregulated Contaminant Monitoring Rule (UCMR) provides a template for systematic data collection [92].
Treatment Technology Assessment: Evaluate advanced treatment options (e.g., advanced oxidation processes, membrane filtration, adsorption, bioremediation) for EC removal from water and wastewater streams [8].
International Harmonization: Align regulatory standards and testing methodologies across jurisdictions to facilitate global risk management of ECs. The OECD's QSAR Project provides a model for international collaboration on standardized approaches [90] [91].
Implementation Challenges and Research Needs
Despite recent advancements, significant challenges remain in standardizing methods and closing regulatory gaps:
- Analytical Method Standardization: Current methods for contaminants like microplastics lack harmonization, making cross-study comparisons difficult [89].
- Exposure Assessment Limitations: Traditional risk assessment approaches often fail to account for real-world exposure scenarios, such as the complex biosolids matrix addressed in EPA's Draft Sewage Sludge Risk Assessment [93].
- Data Sharing Barriers: Intellectual property concerns and competitive disadvantages may inhibit chemical manufacturers from sharing essential data for risk assessment [89].
Future research should focus on developing high-throughput toxicity testing platforms, validating rapid exposure and dosimetry models, and establishing standardized monitoring guidelines that can keep pace with the continuous introduction of new environmental contaminants [8] [89].
The growing prevalence of emerging contaminants in environmental compartments represents a significant challenge that demands immediate and coordinated scientific and regulatory action. The vast regulatory gap—where less than 1% of widely used chemicals are subject to international control—underscores the urgent need for standardized methods that can accelerate risk assessment and facilitate evidence-based decision making [89]. By implementing validated experimental protocols, leveraging predictive toxicological approaches like QSAR, and establishing harmonized monitoring frameworks, researchers and regulators can transition from reactive to proactive contaminant management. The development of standardized methodologies is not merely an academic exercise but a fundamental prerequisite for protecting ecosystem integrity and human health in the face of continuous chemical innovation and environmental release. Only through integrated scientific and regulatory approaches can we effectively address the complex challenges posed by emerging contaminants and close the critical gaps in our current environmental protection frameworks.
The paradigm of chemical risk assessment is undergoing a fundamental shift, moving from a traditional focus on single chemicals to addressing the complex reality of combined exposures. Contaminants of emerging concern (CECs) represent a diverse group of substances not commonly monitored or regulated in the environment but with potential ecological and human health impacts [26]. Humans and ecosystems are involuntarily exposed to hundreds of these chemicals that contaminate our environment, food, and consumer products [94]. This technical guide examines the current scientific framework for assessing the cumulative risk from multiple contaminants, a critical challenge within environmental exposure research on CECs.
The "mixture effect" refers to the potential for combined toxicological impacts from exposure to multiple contaminants, even when each individual chemical is present at low, seemingly harmless concentrations [95]. Research indicates that evaluating substances individually may lead to a significant underestimation of overall environmental toxicity [95] [94]. The European Union's Green Deal and zero-pollution ambition explicitly acknowledge this challenge, emphasizing the need to address gaps in chemical mixture risk assessment through scientific advancement [94].
Defining the Scope: Contaminants of Emerging Concern
Emerging contaminants (ECs) encompass a heterogeneous group of synthetic or naturally occurring chemicals or biological agents detected in the environment for which the associated risks are not fully understood [96]. They are not newly introduced substances but rather compounds whose persistence and potential risks have only recently been recognized [26]. The table below summarizes the primary categories of CECs and their characteristics.
Table 1: Major Categories of Contaminants of Emerging Concern
| Category | Major Constituents | Primary Sources | Key Concerns |
|---|---|---|---|
| Pharmaceuticals & Personal Care Products (PPCPs) | Prescription/over-the-counter drugs, cosmetics, fragrances, sunscreens [26] | Wastewater effluent, agricultural runoff, improper disposal [95] [96] | Biological activity, endocrine disruption, antibiotic resistance [26] |
| Per- and Polyfluoroalkyl Substances (PFAS) | Thousands of synthetic compounds (e.g., PFOA, PFOS) | Industrial discharge, fire-fighting foams, consumer products | Extreme persistence, bioaccumulation, toxicity [26] [94] |
| Micro- and Nano-Plastics (MNPs) | Plastic fragments (<5 mm and <100 nm) [26] | Plastic waste degradation, wastewater sludge [26] | Mechanical damage, oxidative stress, chemical leaching [26] |
| Endocrine Disrupting Chemicals (EDCs) | Bisphenols, phthalates, natural/synthetic hormones [26] | Plasticizers, pesticides, industrial chemicals [26] | Interference with hormonal systems [26] |
| Other | Pesticides, industrial chemicals, nanomaterials, antibiotic resistance genes [96] | Agricultural/industrial runoff, product use | Diverse toxicological endpoints [96] |
A central challenge is that CECs are not typically included in routine monitoring programs or regulated under current water quality standards, though they may be candidates for future regulation as more data on their (eco)toxicity and occurrence becomes available [26].
Fundamental Concepts in Mixture Risk Assessment (MRA)
From Single-Compound to Mixture Assessment
Traditional chemical risk assessment, as outlined by agencies like the European Medicines Agency (EMA) and the European Chemicals Agency (ECHA), follows a single-compound approach. It involves calculating a Risk Quotient (RQ) as the ratio of the Predicted Environmental Concentration (PEC) to the Predicted No Effect Concentration (PNEC) for individual substances [95]. An RQ > 1 indicates potential risk. However, this method fails to account for potential additive or synergistic effects in mixtures, potentially leading to underestimated risks [95] [94].
Conceptual Models for Mixture Toxicity
Two primary conceptual models form the basis for predicting the combined effects of chemical mixtures:
Concentration Addition (CA): This model assumes that all components in a mixture have similar chemical structures and modes of action. They are considered as dilutions of one another, and their effects are additive [95]. The CA model is often viewed as a worst-case scenario and is widely used due to the relative availability of required data and its generally accurate toxicity predictions [95].
Independent Action (IA): This model applies when the components in a mixture have dissimilar structures and different biological targets or modes of action. Their effects are considered to be independent [95].
In real-world environments, mixtures contain substances acting by both CA and IA. Experimental studies often find that the actual toxicity of heterogeneous mixtures falls between the predictions of the CA and IA models, though it is frequently closer to, or greater than, the CA prediction [95].
Methodological Framework for Mixture Assessment
A tiered approach is recommended for the practical assessment of mixture risks, moving from initial prioritization to comprehensive evaluation.
Prioritization of CECs
The Interstate Technology & Regulatory Council (ITRC) provides a logical process for prioritizing CECs. The evaluation sequence considers Occurrence, Toxicity, and Physical-Chemical Properties to classify CECs as Low, Medium, or High priority [97].
Table 2: CEC Prioritization Framework and Subsequent Actions
| Priority Level | Summary of Current Data | Monitoring Follow-Up | Additional Steps |
|---|---|---|---|
| Low Priority | No significant concern identified | No monitoring at this time | Watch for new information |
| Medium Priority | Additional information needed for further prioritization | Continued monitoring | Seek out new information to inform risk characterization |
| High Priority | Widespread or significant concern identified | Expanded monitoring | Additional risk characterization and potential rulemaking |
When evaluating occurrence, data sufficiency is critical. Key questions include the adequacy of analytical methods, the quantity and quality of data, reproducibility of results, and the media for which data are available [97]. Detection in multiple media (e.g., water, soil, biota) increases concern due to the potential for combined exposures and cross-media transfer [97].
Analytical and Toxicological Workflows
Advanced analytical techniques are essential for characterizing complex, real-life mixtures. The workflow involves several sophisticated steps:
- Sample Collection & Preparation: Samples are collected from relevant environmental matrices (surface water, wastewater), food (fish, milk, water), or human tissues (blood, breast milk) and prepared for analysis [94].
- Chemical Profiling:
- Targeted Analysis: Quantifies a predefined set of known chemicals.
- Suspect Screening (SS): Aims to detect known chemicals that are expected to be present in a sample using high-resolution mass spectrometry (HRMS) and library matching [94].
- Non-Targeted Screening (NTS): Aims to identify previously unknown or unexpected chemicals in a sample, serving as an early warning system [94].
- Toxicological Characterization: The biological impact of the whole mixture or its components is assessed using in vitro bioassays that measure specific toxicological endpoints (e.g., activation of the aryl hydrocarbon receptor, cytotoxicity) [94].
- Effect-Directed Analysis (EDA): This technique couples chemical fractionation with bioassay testing to identify the specific compounds ("mixture drivers") responsible for the observed toxicity [94].
Diagram 1: Integrated Workflow for Mixture Risk Assessment. This diagram outlines the key stages in assessing complex real-life mixtures, integrating exposure and hazard assessment.
The PANORAMIX project exemplifies this approach by characterizing real-life mixtures across the environment-food-human continuum and establishing a high-throughput, whole-mixture-based in vitro strategy for screening [94].
The Scientist's Toolkit: Key Reagents and Methodologies
Research on mixture effects relies on a suite of advanced analytical and biological tools.
Table 3: Essential Research Reagents and Methodologies for Mixture Assessment
| Tool Category | Specific Technology/Reagent | Primary Function in MRA |
|---|---|---|
| Analytical Instrumentation | High-Resolution Mass Spectrometry (HRMS) [94] | Enables suspect and non-targeted screening for comprehensive chemical profiling of complex mixtures. |
| Gas/Liquid Chromatography (GC/LC) coupled to MS or MS/MS [26] [94] | Separates and identifies/quantifies individual components in a mixture. | |
| Bioassay Components | Cell-based in vitro assays (e.g., reporter gene assays) [94] | Assess biological activity (e.g., receptor binding, cytotoxicity) of whole mixtures or fractions. |
| Enzymes, Antibodies (for ELISA) [26] | Detect and quantify specific biologically active contaminants or pathogens. | |
| Computational & Molecular Tools | Chemical Databases (e.g., NORMAN) [96] [94] | Support identification of chemicals in suspect and non-targeted screening. |
| Polymerase Chain Reaction (PCR) assays [26] | Detect biological agents, such as emerging pathogens or antibiotic resistance genes (ARGs). | |
| New Approach Methodologies (NAMs) [94] | In silico and high-throughput in vitro methods to predict hazard without animal testing. |
Computational Modeling and Risk Integration
A critical step in MRA is the integration of exposure and hazard data to produce a quantifiable risk estimate. The Component-Based Approach uses the concepts of CA or IA to sum the risk quotients of individual mixture components [95]. The Mixture Risk Index (or similar cumulative risk indicators) can be calculated by summing the PEC/PNEC ratios (i.e., Risk Quotients) of all components in a mixture [95].
Initiatives like the PANORAMIX project are developing web-based interfaces that integrate hazard and exposure data to enable component-based mixture risk estimation, making MRA more accessible for researchers and regulators [94]. Furthermore, Effect-Based Trigger (EBT) values are being established for in vitro bioassays. An EBT is a response threshold in a bioassay; if a sample's effect exceeds this trigger value, it indicates a potential risk and warrants further investigation [94].
Diagram 2: Computational Integration of Exposure and Hazard Data. This diagram shows how data from exposure and hazard assessments feed into computational models for cumulative risk estimation.
Assessing the cumulative risk from multiple contaminants is a complex but indispensable endeavor for modern environmental science and public health protection. The evidence is clear that a single-contaminant approach is insufficient for evaluating the risks posed by real-world, complex mixtures of CECs [95] [94]. The scientific community is responding with advanced methodologies, including tiered assessment strategies [97], sophisticated analytical techniques like suspect and non-targeted screening [94], and integrated computational tools.
Future progress depends on several key developments:
- Adopting a One Health Perspective: This recognizes the interconnectedness of human, animal, and environmental health and emphasizes collaborative, interdisciplinary efforts to address CECs [96].
- Regulatory Integration: MRA must transcend individual regulatory "silos" (e.g., pesticides, industrial chemicals, pharmaceuticals) to effectively address co-exposures from multiple sources [94].
- Embracing New Approach Methodologies (NAMs): The continued development and validation of high-throughput in vitro assays and in silico models are crucial for providing the necessary hazard data in an efficient and ethical manner [94].
The transition toward sustainable pollution management requires robust, socially equitable policies informed by a comprehensive understanding of the mixture effect. By advancing the framework for mixture risk assessment, researchers and regulators can better safeguard planetary health for future generations [96].
Evaluating Ecological Risk and Validating CEC Assessment Frameworks
Environmental Risk Assessment (ERA) serves as a critical framework for evaluating the potential impact of chemical substances on ecosystems. The risk quotient (RQ), calculated as the ratio of Measured Environmental Concentration (MEC) to Predicted No Effect Concentration (PNEC), provides a foundational deterministic approach for risk characterization [98]. This whitepaper examines the core principles of MEC/PNEC methodology within the context of assessing contaminants of emerging concern (CECs), including pharmaceuticals, personal care products, and industrial chemicals. Moving beyond basic quotient calculations, we explore advanced assessment frameworks that incorporate persistence, bioavailability, and taxonomic sensitivity to deliver more nuanced environmental protection. Recent methodological innovations and their implications for regulatory science and drug development are discussed in depth.
Environmental Risk Assessment (ERA) constitutes a systematic process for evaluating the likelihood and severity of adverse ecological effects resulting from exposure to environmental stressors, including chemical pollutants [99]. The ERA framework has evolved significantly since its origins in natural disaster evaluation in the 1930s, expanding to address complex anthropogenic contaminants [99]. For contaminants of emerging concern (CECs)—substances not commonly monitored but with potential ecological effects—ERA provides essential decision-support tools for environmental managers and regulatory bodies.
The fundamental paradigm for ERA follows a structured approach involving hazard identification, dose-response assessment, exposure assessment, and risk characterization [99]. Within pharmaceutical development and other chemical industries, ERA has become an integral component of regulatory submissions, requiring comprehensive evaluation of an substance's environmental fate and effects prior to approval [100]. This technical guide examines the core principles, advanced methodologies, and future directions in ERA, with particular emphasis on the application of MEC/PNEC ratios and their evolution toward more sophisticated assessment frameworks.
Core Principles of the MEC/PNEC Framework
The Risk Quotient (RQ) Concept
The Risk Quotient (RQ) represents a primary tool in screening-level ecological risk assessments, providing a straightforward ratio for initial risk characterization [98]. The RQ is calculated by comparing environmental exposure levels to toxicity thresholds using the formula:
RQ = PEC/PNEC or RQ = MEC/PNEC [98] [99]
Where:
- PEC (Predicted Environmental Concentration): A modeled or calculated value of a chemical's concentration in the environment based on exposure models [98]
- MEC (Measured Environmental Concentration): An analytically determined concentration of a chemical in environmental samples [100]
- PNEC (Predicted No Effect Concentration): The concentration below which exposure is unlikely to cause adverse effects to the environment [101]
Interpretation follows a binary classification where RQ ≥ 1 suggests appreciable risk is likely, while RQ < 1 indicates minimal risk [102]. Risk can be further categorized as negligible (RQ ≤ 0.01), low (0.01 < RQ < 0.1), medium (0.1 < RQ < 1), or high (RQ ≥ 1) [99].
Key Parameter Definitions and Derivation
Table 1: Core Parameters in ERA Using the MEC/PNEC Framework
| Parameter | Definition | Derivation Methodology | Application Context |
|---|---|---|---|
| PEC (Predicted Environmental Concentration) | Calculated environmental concentration based on modeling | Derived from exposure models (e.g., EU System for Evaluation of Substances); factors in usage patterns, disposal routes, and environmental fate [98] | Chemical Safety Assessments; preliminary risk screening; regulatory submissions |
| MEC (Measured Environmental Concentration) | Analytically determined concentration in environmental samples | Quantified via chemical analysis of field-collected samples (water, sediment, biota) [100] | Refined risk assessment; validation of PEC estimates; post-market environmental monitoring |
| PNEC (Predicted No Effect Concentration) | Protective threshold concentration below which adverse effects are unlikely | Derived from ecotoxicity data (EC50, LC50, NOEC) divided by an Assessment Factor (AF) to account for uncertainties [101] | Risk characterization; regulatory standard setting; environmental quality standard derivation |
The PEC represents an essential preliminary estimation in situations where monitoring data are unavailable. For pharmaceuticals, refined PEC calculations incorporate factors such as consumption patterns, excretion rates, metabolism, and removal in wastewater treatment plants [98]. Comparison between PEC and MEC values reveals important insights into model accuracy and real-world chemical fate, with studies showing approximately 60% agreement between predicted and measured values for certain pharmaceuticals across Europe [98].
The PNEC is derived through two primary approaches. The deterministic method utilizes the most sensitive toxicity endpoint (lowest NOEC, EC50, or LC50) from laboratory tests divided by an Assessment Factor (AF) ranging from 10 to 1000, depending on data quality and completeness [101]. The Species Sensitivity Distribution (SSD) method employs statistical distributions of toxicity data from multiple species to determine the Hazardous Concentration for 5% of species (HC5), which is then divided by a smaller AF (1-5) to derive PNEC [101]. The SSD approach accounts for interspecies variability and is generally preferred when sufficient high-quality data are available.
Experimental Protocols in ERA
Standardized Ecotoxicity Testing
Standardized testing protocols form the foundation of reliable PNEC derivation. Key test guidelines established by the Organisation for Economic Co-operation and Development (OECD), United States Environmental Protection Agency (USEPA), and other regulatory bodies ensure data quality and comparability. These tests span multiple trophic levels and organizational hierarchies:
- Algal growth inhibition tests (OECD 201): Assess impacts on primary producers using parameters like biomass and growth rate
- Daphnia sp. acute immobilization tests (OECD 202): Evaluate effects on aquatic invertebrates
- Fish acute toxicity tests (OECD 203): Determine lethal effects on vertebrate species
- Chronic reproduction tests with crustaceans and fish: Provide data on sublethal effects over complete life cycles
For pharmaceuticals with specific modes of action, additional testing with environmentally relevant species may be necessary when standard test species lack the pharmacological target [100]. Recent advancements include the development of split SSD curves built separately for different taxonomic groups (algae, invertebrates, fish) to account for differential sensitivity across phylogenetic lineages [101].
Environmental Fate and Behavior Testing
Understanding chemical fate in the environment provides critical data for refining PEC estimates:
- Adsorption-desorption screening (OECD 106): Batch equilibrium testing determines substance partitioning to activated sludge and soils [100]
- Ready biodegradability testing (OECD 301): Evaluates potential for microbial degradation in environmental compartments
- Hydrolysis testing (OECD 111): Assesses chemical stability in aqueous systems at different pH values
- Photodegradation testing: Determines susceptibility to light-mediated decomposition in aquatic and terrestrial environments
These fate studies inform mass balance models and predict chemical persistence, a crucial factor in ecological risk that traditional RQ approaches may overlook [99].
Analytical Methods for MEC Determination
Advanced analytical techniques enable precise MEC quantification at environmentally relevant concentrations:
- Liquid chromatography tandem mass spectrometry (LC-MS/MS): Provides sensitive, selective quantification of polar CECs in complex matrices
- Solid-phase extraction (SPE): Pre-concentrates analytes from water samples to achieve low detection limits (ng/L range)
- Quality assurance/quality control protocols: Include surrogate standards, matrix spikes, and procedural blanks to ensure data integrity
Recent monitoring studies report MECs for pharmaceuticals ranging from <0.001 μg/L to 0.656 μg/L in European surface waters [100], with some anti-cancer drugs detected at concentrations 3-20 times higher than the 0.01 μg/L PEC action limit in landfill leachates [98].
Visualization of Core ERA Workflows
The Tiered ERA Approach
Figure 1: Tiered Approach to Environmental Risk Assessment
Relationship Between ERA Parameters
Figure 2: Interrelationship Between Core ERA Parameters
Advanced Concepts: Moving Beyond Basic RQ
Incorporating Persistence and Bioavailability
Traditional RQ methodology has been criticized for overlooking critical factors such as environmental persistence and bioavailability. The Synthetic Risk Factor (SRF) approach addresses these limitations by incorporating persistence coefficients and compartment-specific characteristics [99]:
SRF = MEC/(PNEC × C)
Where C represents the environmental persistence coefficient, calculated as the ratio between the regulatory threshold persistence value and the measured half-life (T₁/₂) of the compound [99]. This approach demonstrates improved risk assessment accuracy for persistent compounds like perfluorinated substances and certain pharmaceuticals that may accumulate in environmental compartments.
Bioavailability adjustments represent another critical refinement, particularly for metals and ionizable organic compounds. Tools such as the Bioavailability Factor (BioF) adjust PNEC values based on local water characteristics including pH, hardness, dissolved organic carbon, and temperature [101]. The Biotic Ligand Model (BLM) and related tools (Bio-met, mBAT) facilitate site-specific risk assessments that account for speciation and biological uptake [101].
Taxonomic Sensitivity and Split SSD Approaches
Conventional PNEC derivation often utilizes pooled toxicity data across taxonomic groups, potentially masking differential sensitivities. Split SSD curves constructed separately for algae, invertebrates, and fish provide more protective and taxonomically relevant thresholds [101]. Research demonstrates that nonsplit SSD curves may produce higher HC5 values (less protective) compared to split curves built with the most sensitive taxonomic groups [101].
For pharmaceuticals with specific molecular targets, the presence or absence of drug targets in environmental organisms creates dramatic differences in sensitivity. Mycophenolic acid, an immunosuppressant that inhibits inosine-5′-monophosphate dehydrogenase (IMPDH), exhibits effects across eukaryotic taxa due to target conservation, but weaker effects in prokaryotes where IMPDH inhibition is less efficient [100].
Probabilistic Methods and Mixture Toxicity
Probabilistic risk assessment moves beyond deterministic RQ ratios by incorporating statistical distributions of both exposure and effects. This approach quantifies uncertainty and provides risk managers with probability estimates of exceeding effects thresholds. For chemical mixtures, which represent the typical environmental exposure scenario, mixture risk assessment methodologies address additive, synergistic, or antagonistic interactions that simple RQ calculations cannot capture.
Case Studies and Applications
Pharmaceutical ERA: Mycophenolic Acid
A comprehensive ERA for mycophenolic acid (MPA), an immunosuppressant pharmaceutical, demonstrates the application of advanced ERA principles [100]. The assessment incorporated:
- Exposure analysis: PEC derivation based on European sales data of MPA and its prodrug mycophenolate mofetil, refined with country-specific dilution factors and wastewater treatment plant removal rates
- Environmental fate: Experimental determination of biodegradation (>80% in activated sludge), adsorption (negligible), and bioaccumulation potential (low based on log DOW)
- Effects characterization: Chronic toxicity testing with cyanobacteria, green algae, daphnids, and fish to derive PNEC values
- Risk characterization: Comparison of both PECs and 110 MECs with PNECs, revealing risk ratios (RQ) <1 in most cases (>90% of instances) but potential risk in specific scenarios
This assessment highlighted critical risk management questions regarding acceptable risk levels for essential pharmaceuticals with limited alternatives [100].
Metals in Freshwater Systems
Novel PNEC values for 14 metals commonly associated with mining activities were derived using split SSD curves for different taxonomic groups [101]. The research demonstrated that:
- Algae and invertebrates typically showed greater sensitivity compared to fish
- Nearly half of the calculated PNEC values were below current protective values in practice in Brazil, United States, Canada, and European Union
- Silver (Ag) showed the lowest acute PNEC values for algae and invertebrates
- Bioavailability adjustments were essential for site-specific risk assessment
This approach underscores the importance of taxonomically stratified assessment and bioavailability considerations for metals [101].
The Researcher's Toolkit
Table 2: Essential Research Tools and Reagents for Advanced ERA
| Tool/Reagent | Function/Application | Regulatory Context |
|---|---|---|
| USEPA ECOTOX Database | Source of ecotoxicity data for PNEC derivation; contains LC50, EC50, NOEC values for aquatic and terrestrial species [99] [101] | Accepted by multiple regulatory agencies worldwide for data compilation |
| OECD Test Guidelines | Standardized protocols for fate and effects testing (e.g., OECD 201, 202, 203 for ecotoxicity; OECD 106 for adsorption) [100] | Gold standard for regulatory testing; GLP compliance required for regulatory submissions |
| SSD Software (e.g., ETX 2.0, Burrlioz) | Statistical analysis for Species Sensitivity Distributions and HC5 derivation | Recommended by EMA, USEPA for PNEC derivation when sufficient data exist |
| Bioavailability Tools (BLM, Bio-met, mBAT) | Adjustment of toxicity thresholds based on water chemistry parameters affecting metal speciation and bioavailability [101] | Required in UK for specific metals; gaining acceptance in EU and North America |
| ePiE (exposure to Pharmaceuticals in the Environment) Model | GIS-based catchment modeling for refined PEC estimation of pharmaceuticals [100] | Used in pharmaceutical ERA for spatially explicit exposure assessment |
The MEC/PNEC framework provides a robust foundation for ecological risk assessment, serving as an essential screening tool for contaminants of emerging concern. However, advancing beyond basic risk quotients to incorporate persistence, bioavailability, taxonomic sensitivity, and probabilistic approaches represents the future of ecological risk assessment. The development of split-SSD methods, synthetic risk factors, and bioavailability-adjusted thresholds enables more accurate and environmentally relevant risk characterization, particularly for substances with specific modes of action like pharmaceuticals.
For researchers and drug development professionals, understanding these evolving methodologies is crucial for both regulatory compliance and environmental stewardship. As analytical capabilities advance and ecological understanding deepens, ERA methodologies will continue to refine their ability to protect ecosystem integrity while accommodating essential chemical use. The ongoing challenge remains balancing protective assessments with practical regulatory frameworks that acknowledge use benefits and risk management options.
The increasing input of anthropogenic contaminants into water systems poses a significant threat to aquatic ecosystem health [103]. This whitepaper, framed within a broader thesis on the environmental exposure and effects of Contaminants of Emerging Concern (CECs), provides a technical guide for comparing the ecotoxicological sensitivity of groundwater and surface water species. Groundwater systems, often perceived as pristine, face contamination from agricultural runoff, landfill leachate, and industrial activity [104] [105] [106]. Conversely, surface waters are directly exposed to a complex mixture of microplastics (MPs) and pharmaceuticals and personal care products (PPCPs) [107] [3]. Assessing the differential sensitivity of the organisms inhabiting these distinct environments is critical for accurate ecological risk assessment and the development of targeted remediation strategies. This document outlines the fundamental differences between these ecosystems, details advanced experimental methodologies, and presents a comparative analysis of organism sensitivity for researchers and environmental professionals.
Fundamental Divergences in Exposure Environments
Groundwater and surface water environments present organisms with vastly different physicochemical and ecological challenges, which in turn shape their toxicological responses. The following table summarizes the key characteristics of these two systems.
Table 1: Comparative characteristics of groundwater and surface water environments relevant to ecotoxicology.
| Characteristic | Groundwater Environment | Surface Water Environment |
|---|---|---|
| Light & Temperature | Constant darkness, highly stable temperatures [103] | Light/dark cycles, variable temperatures [103] |
| Hydraulic Dynamics | Very low flow rates, limited mixing | High flow rates, wind-driven and current-driven mixing |
| Contaminant Dilution | Limited dilution potential; contaminants can persist at high concentrations for long periods [108] | High dilution potential, though episodic contamination occurs (e.g., stormwater runoff) [103] |
| Contaminant Type | Often geogenic (e.g., Arsenic, Lead) or from persistent, mobile sources (e.g., agricultural nitrates) [105] [106] | Complex mixtures of CECs, including MPs/NPs, PPCPs, and endocrine disruptors [3] [26] |
| Nutrient Availability | Typically oligotrophic (nutrient-poor) | Ranges from oligotrophic to eutrophic (nutrient-rich) |
| Bioavailable Oxygen | Often hypoxic or anoxic | Generally oxygenated |
A critical difference is the behavior of contaminants. In surface water, micro- and nano-plastics (MNPs) can act as vectors for hazardous chemicals like polyaromatic hydrocarbons (PAHs) and polychlorinated biphenyls (PCBs), transferring them into organisms upon ingestion [107]. In contrast, contaminated groundwater can discharge into surface water, creating a continuous exposure pathway for surface species to groundwater pollutants like polyaromatics, as noted in assessments of old coal gas facilities [108]. The diagram below illustrates the primary exposure pathways and environmental factors for groundwater and surface water species.
Advanced Methodologies for Comparative Assessment
A robust comparison of species sensitivity requires an integrated approach that moves beyond traditional chemical analysis to include advanced biomonitoring and controlled bioassays.
Integrated Chemical and Biological Toxicity Assessment
A powerful combined methodology involves pairing analytical chemistry with in vivo bioassays to link specific contaminants to observed ecological effects. A recent study on industrial park groundwater exemplifies this protocol [109].
Experimental Protocol: Integrated Groundwater Assessment
- Sample Collection: Collect groundwater samples from monitoring wells or hand pumps, purging the well for 2-3 minutes prior to sampling to stabilize physical parameters [106] [109]. Preserve samples for specific analyses (e.g., adding boric acid for nitrate measurement) [106].
- Chemical Analysis: Analyze samples for a broad suite of inorganic and organic contaminants. Standard parameters include pH, Total Dissolved Solids (TDS), and specific chemicals like heavy metals (Arsenic, Lead), nitrate, sulfate, and organic pollutants such as pyrethroids, volatile phenols, and polychlorinated biphenyls (PCBs) [106] [109]. Techniques like high-performance liquid chromatography (HPLC) and mass spectrometry (MS) are central to identifying and quantifying CECs [26].
- Biological Toxicity Testing: Subject the whole water samples to zebrafish (Danio rerio) embryo toxicity tests (ZFET) [109].
- Exposure: Expose embryos to various concentrations of the groundwater sample.
- Endpoint Measurement: Record lethal and sublethal endpoints, including:
- Mortality rate
- Hatching rate
- Malformation incidence (e.g., pericardial edema, spinal curvature)
- Behavioral toxicity (e.g., reduced movement)
- Data Integration: Correlate toxicological outcomes from the bioassay with chemical analysis data to identify contaminants driving the observed toxicity [109].
Biomarker-Based Biomonitoring
Biomarkers are detectable molecular, biochemical, cellular, or physiological changes that indicate altered physiology due to contaminant exposure [103] [110]. They provide a sensitive measure of exposure and early biological effects, even at low contaminant concentrations.
Table 2: Key biomarker classes and their application in aquatic ecotoxicology.
| Biomarker Class | Specific Example | Indicator For | Typical Organism |
|---|---|---|---|
| Exposure Biomarkers | Cytochrome P4501A (CYP1A) / EROD activity | Exposure to oil and other aryl hydrocarbon receptor agonists [103] | Fish, Bivalves |
| Vitellogenin (Vtg) | Exposure to estrogenic compounds (Endocrine Disruptors) [103] | Fish | |
| Metallothioneins | Exposure to specific metals (Cd, Hg) [103] | Aquatic Invertebrates, Fish | |
| Effect Biomarkers | Oxidative Stress Biomarkers (e.g., Lipid Peroxidation) | General cellular damage from reactive oxygen species [107] | Crustaceans, Fish, Bivalves |
| Genotoxicity (e.g., DNA strand breaks) | Damage to genetic material [107] | Various Aquatic Species | |
| Acetylcholinesterase (AChE) Inhibition | Exposure to organophosphate and carbamate pesticides [110] | Fish, Invertebrates |
The workflow below outlines the process of designing a biomarker-based monitoring study, from sentinel species selection to data interpretation.
Comparative Sensitivity Analysis
The sensitivity of aquatic organisms to contaminants is not merely a function of intrinsic toxicity but is profoundly modulated by their environmental context and evolutionary adaptations.
Sensitivity of Surface Water Species
Surface water species are exposed to a dynamic and complex cocktail of contaminants. Micro- and nano-plastics (MNPs) are a pervasive stressor, with studies showing they can cause oxidative stress, digestive impairment, and molecular damage in organisms like crustaceans, bivalves, and fish [107] [26]. Endocrine Disrupting Chemicals (EDCs), a class of CECs found in PPCPs, are particularly concerning as they can impair reproduction and cause physiological alterations at very low concentrations, effects which may not be detected by traditional toxicity tests [3]. Furthermore, the dynamic nature of surface water systems means organisms may face episodic exposures, such as pulses of contaminants from stormwater runoff, which can have significant impacts on health and fitness [103].
Sensitivity of Groundwater Species
Groundwater species (stygobites) are typically highly specialized K-strategists, adapted to stable, oligotrophic conditions. This evolutionary path often results in traits that confer heightened toxicological sensitivity, including:
- Slow metabolic and reproductive rates, prolonging exposure and limiting population recovery.
- Evolution in a low-stress environment, potentially reducing the selection for robust detoxification systems. Evidence from biomarker studies in humans shows that even low concentrations of contaminants like arsenic and lead in groundwater can lead to significant bioaccumulation and health risks over the long term due to continuous exposure [105]. This principle applies to groundwater fauna; their constant exposure to contaminants, with limited potential for dilution or dispersal, makes them vulnerable even to levels of pollution considered low-risk in surface waters. Studies classifying groundwater with a "poor" Water Quality Index (WQI) have linked it to serious health challenges, underscoring the sensitivity of the biological systems dependent on this resource [106].
The Imperative of an Integrated Approach
A critical finding in modern ecotoxicology is the discrepancy between chemical and biological risk assessments. Groundwater classified as "low-risk" based on chemical analysis alone has been shown to induce significant toxicological effects, including mortality, malformations, and behavioral toxicity in zebrafish embryos [109]. This underscores a fundamental limitation of relying solely on chemical benchmarks and highlights the need for the integrated methodologies described in Section 3. The Adverse Outcome Pathway (AOP) framework is a valuable conceptual model for linking molecular-level biomarker responses (a molecular initiating event) to higher-order effects on growth, reproduction, and survival, thereby providing a mechanistic understanding of sensitivity differences [110].
The Scientist's Toolkit: Essential Research Reagents & Materials
The following table details key reagents and materials essential for conducting the experiments and analyses described in this guide.
Table 3: Essential research reagents and solutions for comparative aquatic ecotoxicology studies.
| Reagent/Material | Function/Application | Example Use Case |
|---|---|---|
| Zebrafish Embryo Test System | A standardized model organism for in vivo toxicity testing of whole water samples or specific chemicals. | Testing groundwater samples for lethal and sublethal effects (malformations, behavioral changes) [109]. |
| Enzyme-Linked Immunosorbent Assay (ELISA) Kits | Quantification of specific biomarker proteins (e.g., Vitellogenin, Metallothionein) in tissue or plasma samples. | Measuring exposure to endocrine disruptors or metals in caged fish or wild-caught specimens [103] [110]. |
| PCR & qRT-PCR Reagents | Gene expression analysis to measure the transcriptional response of biomarker genes (e.g., CYP1A, heat-shock proteins). | Molecular-level assessment of exposure to specific contaminant classes in sentinel species [110]. |
| Chemical Standards for CECs | Analytical reference materials for quantifying contaminants via HPLC, GC-MS, or LC-MS/MS. | Identifying and quantifying specific PPCPs, PFAS, or pesticide residues in water samples [26]. |
| Boric Acid Solution | A preservative used to stabilize water samples for specific anion analysis, such as nitrate. | Added to water samples immediately after collection to prevent further biological reaction before nitrate measurement [106]. |
| CDNB (1-chloro-2,4-dinitrobenzene) | A substrate for measuring the activity of glutathione S-transferase (GST), an enzyme involved in detoxification. | Assessing oxidative stress response in invertebrate or fish tissue homogenates as a biomarker of effect [110]. |
The ecotoxicological sensitivity of groundwater and surface water species is a function of the complex interplay between their distinct evolutionary adaptations and the unique characteristics of their respective environments. Surface water species face a dynamic and complex mixture of emerging contaminants like MNPs and PPCPs, while the specialized, stable ecology of groundwater species renders them particularly vulnerable to persistent groundwater pollutants. A definitive comparative assessment cannot rely on traditional chemical analysis alone. The most robust and protective approach integrates advanced chemical screening with biomarker-based biomonitoring in sentinel species and controlled biological toxicity tests. This integrated methodology is essential for identifying true ecological risk, clarifying the mechanisms behind differential sensitivity, and informing effective, evidence-based environmental management policies to protect both groundwater and surface water resources.
Validating Biomarker Utility for Human Health Risk Projection
The escalating prevalence of contaminants of emerging concern (CECs), from pharmaceuticals to industrial chemicals, in environmental matrices poses a significant threat to public health [111]. Within this context, the accurate validation of biomarkers—measurable indicators of exposure, effect, or susceptibility—has become a cornerstone for reliable human health risk projection [112]. This process transforms observational data into actionable evidence, enabling the projection of health risks associated with environmental exposures. The paradigm is shifting from traditional risk assessment, heavily reliant on animal studies and overt toxicity endpoints, towards a proactive health management framework [112]. This new approach leverages advances in molecular detection, computational toxicology, and data science to enable early intervention and personalized risk assessment [113] [112].
The validation of biomarkers ensures they are not merely correlated with an event but are predictively useful and causally informative within a defined biological context. For environmental contaminants, this involves establishing a quantifiable relationship between the external dose of a contaminant, its internal concentration (biomarker of exposure), the early biological perturbations it causes (biomarker of effect), and the eventual adverse health outcome [114]. The integration of New Approach Methodologies (NAMs), including in vitro assays and in silico models, is central to modernizing this validation pipeline, reducing ethical and logistical burdens while improving human relevance [113]. This guide provides a technical roadmap for researchers and drug development professionals to navigate the complex process of rigorously validating biomarkers for human health risk projection within environmental health research.
Foundational Framework for Biomarker Validation
A validated biomarker must fulfill specific criteria across its lifecycle, from discovery to clinical application. The framework below outlines the core phases and key performance characteristics that must be established.
Table 1: Core Validation Characteristics for Biomarkers
| Characteristic | Technical Definition | Assessment Method |
|---|---|---|
| Analytical Validity | The accuracy, precision, sensitivity, and specificity with which the biomarker is measured in a specific matrix. | Inter- and intra-laboratory reproducibility studies using spiked samples and reference materials [114]. |
| Biological Validity | The extent to which the biomarker reflects a biological process, pathogenic state, or response to an environmental exposure. | Cross-sectional studies comparing exposed and unexposed populations; dose-response relationships in model systems [114] [111]. |
| Clinical/Utility Validity | The ability of the biomarker to reliably inform about the risk, presence, or future course of a disease or health condition. | Prospective cohort studies evaluating the biomarker's predictive power for a specific health endpoint [115] [116]. |
| Generalizability | The performance of the biomarker across different populations, demographics, and exposure scenarios. | External validation on independent datasets collected from different institutions or populations [115] [117]. |
A critical distinction in validation is between internal and external validation. Internal validation, involving techniques like cross-validation or bootstrapping on the original dataset, is a necessary first step to assess model performance and avoid overfitting [115]. However, it is insufficient alone. External validation is a more rigorous requirement for establishing generalizability, where the predictive model incorporating the biomarker is tested on a completely separate dataset, collected by different investigators and from a different population [115] [117]. This step is crucial for verifying that the biomarker's utility is not an artifact of a specific study cohort.
Furthermore, the Adverse Outcome Pathway (AOP) framework provides a structured conceptual model for organizing knowledge about the mechanistic connections between a direct molecular initiating event (e.g., a chemical binding to a receptor) and an adverse outcome at the organism or population level [113]. Validating a biomarker's position within an AOP strengthens its biological plausibility and utility for risk assessment. For instance, an omics-based biomarker might represent a key event in an AOP, linking exposure to a contaminant with a potential health outcome like immunotoxicity [113].
Computational and In Silico Validation Methodologies
Computational methods are indispensable for biomarker discovery and validation, especially for handling high-dimensional data and predicting the behavior of thousands of environmental contaminants.
Machine Learning for Biomarker Discovery and Risk Prediction
Machine learning (ML) models can identify complex, non-linear patterns in multi-modal data that traditional statistical methods might miss. A robust ML workflow for biomarker validation involves several stages, as shown in the diagram below.
A key step is model interpretation to identify the most predictive features. Techniques like Shapley Additive Explanations (SHAP) quantify the contribution of each variable (e.g., a specific protein or genetic variant) to the individual risk prediction [117]. For example, a study predicting osteoarthritis risk integrated clinical, lifestyle, and biomarker data, using SHAP analysis to identify that age, BMI, and prescription of non-steroidal anti-inflammatory drugs were top predictors, thereby validating their utility as risk biomarkers [117].
Table 2: Machine Learning Models for Biomarker Validation
| Model Type | Application in Biomarker Validation | Strengths | Limitations |
|---|---|---|---|
| eXtreme Gradient Boosting (XGBoost) | Integrating multi-modal data (e.g., clinical, omics) to predict disease risk and identify key biomarkers [117]. | Handles complex interactions and missing data well; provides feature importance scores. | Can be prone to overfitting without careful tuning; less interpretable than linear models. |
| Knowledge-Guided Graph Transformer (KPGT) | Predicting the carcinogenicity of environmental pollutants based on molecular structure [118]. | Incorporates molecular fingerprints and descriptors; superior performance on complex chemical data. | "Black box" nature; requires large, curated datasets for training. |
| Penalized Regression (LASSO, Ridge) | Selecting a parsimonious set of biomarkers from a high-dimensional panel (e.g., transcriptomic data) [115]. | Reduces overfitting by penalizing coefficient size; more interpretable than complex ML models. | Assumes linear relationships; may exclude biomarkers with weak but real synergistic effects. |
Molecular Modeling and Cheminformatics
For environmental contaminants, in silico methods can predict the potential of a chemical to act as a hazard, thereby guiding the selection of biomarkers for the molecular initiating event in an AOP. Techniques include:
- Molecular Docking and Dynamics: Used to predict the binding affinity and interaction between a contaminant and a biological target (e.g., a protein receptor), helping to identify a potential molecular initiating event [113] [118].
- Quantitative Structure-Activity Relationship (QSAR): Models that relate a chemical's structural features to its biological activity or toxicity. These are used for read-across, where data from a well-studied chemical is used to predict the toxicity of a structurally similar, data-poor chemical [113].
The validation of these computational models themselves is critical. Performance is measured using metrics like the Area Under the Receiver Operating Characteristic Curve (AUC-ROC), and models must be tested on external chemical sets to ensure their predictions are generalizable [118].
Experimental and Analytical Protocols
Translating computational findings into validated biomarkers requires rigorous analytical chemistry and controlled in vitro experimentation.
Analytical Method Validation for Biomarker Quantification
The quantification of biomarkers, whether the parent compound, its metabolite, or an adduct, in biological matrices requires rigorously validated analytical methods. Liquid chromatography coupled with tandem mass spectrometry (LC-MS/MS) is the gold standard for this purpose [114].
Table 3: Key Parameters for Analytical Method Validation
| Validation Parameter | Protocol and Acceptance Criteria |
|---|---|
| Accuracy & Precision | Analyze replicate samples (n≥5) at low, medium, and high concentrations across multiple days. Accuracy (relative error) should be ±15%; precision (coefficient of variation) should be <15% [114]. |
| Sensitivity (LOD/LOQ) | Limit of Detection (LOD): Signal-to-noise ratio ≥ 3. Limit of Quantification (LOQ): Signal-to-noise ratio ≥ 10, with accuracy and precision meeting criteria at this level [114] [111]. |
| Matrix Effects | Compare the analytical response of a biomarker spiked into a biological matrix (e.g., plasma, urine) to the response in a pure solvent. Signal suppression/enhancement should be characterized and corrected for [114]. |
| Specificity | The method should be able to distinguish the analyte from other interfering components in the sample matrix. This is confirmed by analyzing blank samples from multiple sources [114]. |
In Vitro and Omics Approaches in a NAMs Framework
New Approach Methodologies (NAMs) leverage in vitro systems and high-throughput omics to provide human-relevant data for biomarker development without animal testing.
- Advanced In Vitro Models: 3D cell cultures, organoids, and microphysiological systems (MPS or "organs-on-chips") more accurately mimic human tissue complexity and in vivo responses compared to traditional 2D cultures. These can be used to identify early biomarkers of effect, such as the release of specific cytokines or changes in gene expression following exposure to a contaminant [113].
- Omics Pipelines (Transcriptomics, Proteomics, Metabolomics): High-throughput omics technologies can identify global molecular changes. To be validated for risk assessment, omics data must adhere to standardized reporting frameworks like the OECD OMICS Reporting Framework (OORF) to ensure reproducibility [113]. Data analysis often involves Benchmark Dose (BMD) modeling to calculate the point of departure (PoD) for toxicity, providing a quantitative link between exposure and a molecular biomarker of effect [113].
The workflow below illustrates a typical integrated approach for experimental biomarker validation.
Application and Translation in Risk Assessment
Validated biomarkers are integrated into higher-level frameworks to enable quantitative human health risk projection.
- Integrating Biomarkers into AOPs and IATA: A validated biomarker can be positioned as a Key Event within an Adverse Outcome Pathway (AOP). This mechanistic framework then supports an Integrated Approach for Testing and Assessment (IATA), which combines multiple sources of evidence (in silico, in vitro, in chemico) for regulatory decision-making [113]. For example, a biomarker of oxidative stress could be a key event in an AOP for liver toxicity, and its measurement in an in vitro liver model could be used within an IATA to prioritize chemicals for further testing.
- Physiologically Based Pharmacokinetic (PBPK) Modeling: These models simulate the absorption, distribution, metabolism, and excretion (ADME) of a contaminant in the human body. Validated biomarkers of exposure (e.g., parent compound or metabolite concentration in blood) are crucial for calibrating and validating PBPK models. A validated model can then be used to translate an external exposure dose (e.g., mg/kg/day) into a target tissue dose, which is more mechanistically linked to a biomarker of effect [113]. The European Food Safety Authority (EFSA) used a PBPK model for 4 PFAS chemicals, incorporating immunotoxicity biomarker data, to derive a tolerable weekly intake [113].
The Scientist's Toolkit: Essential Research Reagents and Materials
Table 4: Key Reagent Solutions for Biomarker Validation Studies
| Research Reagent / Material | Function in Validation | Example Application |
|---|---|---|
| Certified Reference Materials (CRMs) | To calibrate instruments and verify the accuracy and precision of analytical methods for biomarker quantification. | Quantifying perfluorinated compounds (PFCs) in human serum [114]. |
| Stable Isotope-Labeled Internal Standards | To account for matrix effects and losses during sample preparation in mass spectrometry, improving quantitative accuracy. | Measuring phthalate metabolites in urine samples [114]. |
| High-Affinity Antibodies | For developing highly specific and sensitive immunoassays (e.g., ELISA) to detect protein biomarkers. | Detecting CRTAC1 or COL9A1, potential protein biomarkers for osteoarthritis [117]. |
| Pre-characterized Biobank Samples | For use as quality control materials and in external validation sets to test the generalizability of a biomarker model. | Validating a multi-omics prediction model for disease risk in cohort studies [117] [112]. |
| Molecular Probes (e.g., for qPCR, NGS) | To specifically target and quantify genomic, transcriptomic, or epigenomic biomarkers. | Profiling gene expression changes in response to pollutant exposure [118] [112]. |
| Validated In Vitro Models (e.g., Organoids) | To study the biological effect of a contaminant and identify mechanistic biomarkers in a human-relevant system. | Investigating hepatotoxicity of environmental chemical mixtures [113]. |
The increasing detection of contaminants of emerging concern (CECs), including pharmaceuticals, personal care products, and industrial chemicals, in water sources raises significant environmental and public health issues [3]. These substances, often characterized by their persistence, low acute toxicity but significant reproductive effects at very low concentrations, and potential to act as endocrine disruptors, challenge conventional wastewater treatment paradigms [3] [119]. Effective management of water resources necessitates the development and implementation of advanced treatment technologies capable of ensuring water security and environmental safety. This review evaluates the efficacy of three prominent advanced water treatment technologies—adsorption, advanced oxidation processes (AOPs), and forward osmosis (FO)—within the context of mitigating the environmental exposure and effects of CECs. The analysis focuses on removal efficiencies, operational parameters, and practical implementation considerations, providing a technical foundation for researchers and professionals engaged in environmental exposure science and water treatment innovation.
Adsorption
Adsorption is a physical separation process where contaminants accumulate on the surface of a solid material (adsorbent) via physical or chemical interactions. Its efficacy stems from its operational simplicity, cost-effectiveness, and high efficiency for a broad spectrum of contaminants, including heavy metals and organic pollutants [120]. The process is highly dependent on the properties of the adsorbent, such as its surface area, pore structure, and the functional groups present.
Recent research focuses on developing and optimizing novel adsorbents. For instance, reduced graphene oxide/Fe₃O₄ (rGO@Fe₃O₄) magnetic nanocomposites have demonstrated exceptional effectiveness for removing hexavalent chromium (Cr(VI)), a highly toxic and carcinogenic heavy metal, from wastewater [121]. The adsorption behavior of Cr(VI) onto these nanocomposites aligns well with the Freundlich isotherm model, indicating heterogeneous adsorption, and follows pseudo-second-order kinetics, suggesting that the rate-limiting step is chemisorption [121]. Similarly, modified natural materials, such as clay treated with sodium carbonate and thermally activated at 750°C, have achieved remarkably high adsorption capacities—up to 1199.93 mg g⁻¹ for Crystal Violet dye—as described by the Langmuir isotherm, pointing to monolayer coverage [120].
Experimental Protocol: Adsorption of Cr(VI) onto rGO@Fe₃O₄
Objective: To determine the adsorption capacity and kinetics of hexavalent chromium removal using rGO@Fe₃O₄ magnetic nanocomposites.
- Materials Synthesis: Graphene oxide (GO) is first synthesized from graphite powder via the modified Hummers method [121]. The rGO@Fe₃O₄ nanocomposites are then prepared through chemical co-precipitation: an aqueous suspension of GO is mixed with a solution of Fe³⁺ and Fe²⁺ salts (in a 2:1 molar ratio), followed by the addition of ammonia solution to precipitate Fe₃O₄ nanoparticles. Hydrazine is introduced to reduce the GO, and the resulting magnetic nanocomposites are separated, washed, and dried [121].
- Batch Adsorption Experiments: Experiments are performed by mixing a known mass of the rGO@Fe₃O₄ adsorbent with a specific volume of Cr(VI) solution (prepared from K₂Cr₂O₇) in batch reactors. The influence of critical parameters such as pH, initial Cr(VI) concentration, adsorbent dose, and contact time is investigated [121].
- Analysis: Samples are withdrawn at predetermined time intervals, and the nanocomposites are separated using an external magnet. The remaining Cr(VI) concentration in the supernatant is quantified, typically using UV-Vis spectroscopy. The adsorption capacity at time t, qt (mg g⁻¹), is calculated as qt = (C₀ - Ct)V/m, where C₀ and Ct are the initial and at-time-t concentrations (mg L⁻¹), V is the solution volume (L), and m is the adsorbent mass (g) [121].
- Isotherm and Kinetics Modeling: Equilibrium data are fitted to linear and nonlinear forms of Langmuir and Freundlich isotherm models to understand the adsorption mechanism. Kinetic data are analyzed using pseudo-first-order and pseudo-second-order models [121].
Figure 1: Adsorption Experimental Workflow.
Research Reagent Solutions
Table 1: Key Research Reagents for Adsorption Studies
| Reagent/Material | Function in Experiment |
|---|---|
| Graphite Powder | Starting material for the synthesis of graphene oxide (GO) [121]. |
| Reduced Graphene Oxide/Fe₃O₄ (rGO@Fe₃O₄) | Magnetic nanocomposite adsorbent for heavy metal removal; enables easy magnetic separation [121]. |
| Potassium Dichromate (K₂Cr₂O₇) | Source of hexavalent chromium (Cr(VI)) ions in synthetic wastewater [121]. |
| Natural Clay | Low-cost, naturally occurring adsorbent; often chemically or thermally modified to enhance capacity [120]. |
| Crystal Violet (CV) Dye | Model organic pollutant (cationic dye) for evaluating adsorbent performance [120]. |
Advanced Oxidation Processes (AOPs)
AOPs are a class of chemical treatment methods designed to remove organic pollutants by oxidizing them with highly reactive, non-selective hydroxyl radicals (HO•), which have a redox potential of 2.7 V [122]. These processes are particularly effective for the degradation of persistent and bio-recalcitrant organic compounds that are not removed by conventional treatment.
UV-based AOPs are among the most widely studied. These processes involve the generation of HO• through the irradiation of water containing oxidants like H₂O₂ or O₃ with UV light, sometimes in the presence of a catalyst such as TiO₂ [123] [122]. A review of UV-based AOPs found they can degrade over 90% of various contaminants, including pharmaceuticals and dyes [123]. Integrated systems, such as the TiO₂/UV/O₃/H₂O₂ process, have demonstrated superior performance, achieving up to 92% degradation of a mixture of volatile organic compounds (VOCs) in model wastewater [122]. A promising development is the integration of hydrodynamic cavitation (HC) with UV, catalysts, and oxidants, which creates synergistic effects, generates multiple radical species, and accelerates contaminant breakdown while reducing chemical and energy demands [123]. Challenges remain, including the potential formation of toxic by-products and reduced efficiency in water with high turbidity [123].
Experimental Protocol: Integrated Photocatalytic AOP (TiO₂/UV/O₃/H₂O₂)
Objective: To evaluate the degradation efficiency of a hybrid AOP for a mixture of VOCs in a model wastewater matrix.
- Reactor Setup: A photocatalytic reactor is set up, equipped with a UV light source and provisions for introducing gases (e.g., O₃) and liquids (e.g., H₂O₂ solution) [122].
- Experimental Procedure: A model wastewater containing a defined mixture of VOCs (e.g., toluene, phenol, naphthalene) is prepared. The catalyst, typically TiO₂ (e.g., AEROXIDE P-25), is added to the wastewater and maintained in suspension through stirring. The system is then operated under various conditions:
- With UV irradiation alone.
- With oxidants alone (O₃, H₂O₂, or O₃/H₂O₂).
- With combined UV and oxidants (UV/O₃, UV/H₂O₂, UV/O₃/H₂O₂).
- With photocatalysis (TiO₂/UV) combined with oxidants (TiO₂/UV/O₃, TiO₂/UV/H₂O₂, TiO₂/UV/O₃/H₂O₂) [122].
- Analysis and Monitoring: Samples are taken at regular intervals during the treatment. The concentration of each target VOC is quantified, typically using gas chromatography (GC). The chemical oxygen demand (COD) is also measured before and after treatment to assess the overall reduction in the pollution load and the degree of mineralization [122].
- Efficiency Calculation: The degradation efficiency for each VOC and the overall COD removal are calculated to determine the most effective combination of processes.
Figure 2: Advanced Oxidation Process Experimental Workflow.
Research Reagent Solutions
Table 2: Key Research Reagents for Advanced Oxidation Processes
| Reagent/Material | Function in Experiment |
|---|---|
| Titanium Dioxide (TiO₂) P-25 | Widely used semiconductor photocatalyst; generates electron-hole pairs under UV light that produce hydroxyl radicals [122]. |
| Hydrogen Peroxide (H₂O₂) | Oxidant precursor; under UV light or with catalysts, it decomposes to yield hydroxyl radicals [122]. |
| Ozone (O₃) | Powerful oxidant; can directly oxidize pollutants or decompose in water to form hydroxyl radicals [122]. |
| Volatile Organic Compounds (VOCs) | Model pollutants (e.g., phenol, toluene, naphthalene) used to test AOP efficacy in synthetic wastewater [122]. |
Forward Osmosis (FO)
Forward osmosis is an osmotically driven membrane process where water naturally diffuses from a feed solution (FS) across a semi-permeable membrane into a more concentrated draw solution (DS), effectively concentrating the FS and diluting the DS [124] [125]. Its key advantages include low hydraulic pressure operation, low fouling propensity, and high rejection of a wide range of contaminants, making it promising for wastewater treatment and resource recovery [126] [125].
FO performance is often limited by factors like concentration polarization, membrane fouling, and reverse salt flux (the diffusion of draw solutes into the feed) [125]. Recent innovations focus on module configuration to maintain driving force. A conventional multi-stage serial FO system achieved an enrichment ratio (concentration factor) of 2.5 for brackish water feed [124]. In contrast, a novel draw solution split distribution (DSSD) configuration, where the DS is supplied in parallel to each module, significantly boosted the enrichment ratio to 12.5 while reducing energy consumption (0.137 kWh/m³) compared to the serial design [124]. This configuration mitigates the decline in osmotic driving force that plagues serial systems. FO has been successfully applied to concentrate valuable compounds, such as phenolic antioxidants from mandarin wastewater, achieving a concentration factor of approximately 2 [127].
Experimental Protocol: Concentration of Pollutants via FO
Objective: To concentrate target compounds (e.g., phenolic antioxidants) from a wastewater stream and evaluate FO performance.
- System Setup: A laboratory-scale FO system is assembled, typically comprising a membrane cell (e.g., flat-sheet or spiral-wound module), peristaltic pumps for circulating the FS and DS, and balances for continuously monitoring the mass (and thus volume) of the FS and DS tanks [127].
- Membrane Orientation: The FS is typically directed against the active layer of the membrane, with the DS on the support layer side. This "AL-FS" orientation is often preferred to mitigate internal concentration polarization [127].
- Operational Procedure: The experiment is initiated by circulating the wastewater FS (e.g., ultrafiltered mandarin wastewater) and a concentrated DS (e.g., 50 g/L NaCl solution) through the membrane module in counter-current flow. The experiment runs until a target volume reduction factor (VRF) is achieved [127].
- Data Collection and Analysis: The permeate water flux (Jw) is calculated based on the weight change of the DS tank over time. The reverse salt flux (Js) is determined by tracking the increase in conductivity/salinity in the FS tank over time [127]. Samples of the FS are taken at the beginning and end of the experiment to measure the concentration of the target compounds (e.g., via Folin-Ciocalteu method for polyphenols) and calculate the concentration factor [127].
Research Reagent Solutions
Table 3: Key Research Reagents for Forward Osmosis Studies
| Reagent/Material | Function in Experiment |
|---|---|
| Cellulose Triacetate (CTA) FO Membrane | A common semi-permeable membrane material for FO, offering good water permeability and solute rejection [127]. |
| Sodium Chloride (NaCl) Draw Solution | A widely used, high-osmotic-pressure draw solute to create the driving force for water permeation [127]. |
| Model Wastewater/Real Effluent | Feed solution containing target contaminants or valuable compounds to be concentrated or removed [127]. |
Comparative Efficacy and Application
Table 4: Comparative Summary of Removal Technologies
| Technology | Typical Contaminants Targeted | Reported Removal/Efficiency | Key Advantages | Key Challenges |
|---|---|---|---|---|
| Adsorption | Heavy metals (e.g., Cr(VI)), dyes, pharmaceuticals [121] [120] | >1199 mg g⁻¹ for dye on modified clay [120]; Mechanism follows Freundlich/Pseudo-second-order for Cr(VI) [121] | Simplicity, use of low-cost materials, high capacity for specific pollutants [120] | Adsorbent regeneration, disposal of spent adsorbent, selective to certain pollutants |
| Advanced Oxidation (AOPs) | Pharmaceuticals, VOCs, endocrine disruptors [123] [122] | >90% degradation of pharmaceuticals and dyes; 92% VOC removal with TiO₂/UV/O₃/H₂O₂ [123] [122] | Broad-spectrum degradation, potential for complete mineralization [122] | Formation of toxic by-products, high energy/chemical input, scavenging effects [123] |
| Forward Osmosis (FO) | Broad contaminant rejection, water recovery, nutrient concentration [124] [127] [125] | Enrichment ratio of 12.5 with DSSD configuration; high rejection of CECs [124] [125] | Low fouling, high rejection, operates at low/no hydraulic pressure [125] | Reverse salt flux, concentration polarization, draw solute regeneration energy [124] [125] |
The efficacy of adsorption, advanced oxidation, and forward osmosis in removing contaminants of emerging concern from water is well-documented, yet each technology presents a unique profile of strengths and limitations. Adsorption excels with its high capacity for specific pollutants using low-cost materials, while AOPs offer powerful, non-selective degradation pathways. Forward osmosis provides high-quality separation and concentration with low fouling potential. The evolution of these technologies points toward hybrid systems (e.g., cavitation-AOP [123], FO-RO [124]) that synergize their individual advantages to address complex wastewater challenges. Future research should prioritize minimizing energy and chemical consumption, ensuring the sustainability of material synthesis (e.g., for nanocomposites), and comprehensively assessing the formation and toxicity of transformation by-products. For FO, developing advanced draw solutes and energy-efficient regeneration methods remains critical [124] [125]. Ultimately, the selection and optimization of these technologies are paramount for advancing the core objectives of environmental exposure science: to understand, mitigate, and prevent the adverse health and ecological impacts of contaminants of emerging concern.
The global management of contaminants of emerging concern (CECs) represents a critical challenge for environmental protection and public health. These substances, which include a diverse range of synthetic and naturally occurring chemicals, have attracted growing scientific attention due to their potential ecological and human health impacts, coupled with advances in analytical methods that now allow detection at trace levels [26]. The term "contaminants of emerging concern" refers to "substances and microorganisms including physical, chemical, biological, or radiological materials known or anticipated in the environment, that may pose newly identified risks to human health or the environment" [128]. This in-depth technical guide examines the complex regulatory frameworks governing CECs worldwide, providing researchers and drug development professionals with a comprehensive analysis of current approaches, methodological considerations, and future directions within the broader context of environmental exposure and effects research.
Defining Contaminants of Emerging Concern
Classification and Categories
Contaminants of emerging concern encompass a heterogeneous group of synthetic or naturally occurring chemicals or microorganisms that are not commonly monitored in the environment but have the potential to cause known or suspected adverse ecological and/or health effects [26]. According to scholarly literature, CECs can be divided into three distinct categories based on their environmental history and recognition:
- Category 1: Chemicals recently introduced into the environment (e.g., industrial additives and nanomaterials)
- Category 2: Chemicals present in the environment for a long time, but whose persistence and potential risks were only recently recognized (e.g., certain pharmaceuticals)
- Category 3: Chemicals known for a long time but whose potential negative impact was only recently discovered (e.g., hormones and endocrine disruptors) [26]
Major Classes of CECs
The widely accepted classification of emerging contaminants includes, but is not limited to, the following major classes:
- Pharmaceuticals and Personal Care Products (PPCPs): Including antidepressants, blood pressure medications, over-the-counter drugs like ibuprofen, bactericides like triclosan, sunscreens, antifungal agents, and hormones [26].
- Persistent Organic Pollutants (POPs): Such as polybrominated diphenyl ethers (PBDEs) used in flame retardants and perfluorinated organic acids (PFAS) [129] [26].
- Endocrine-Disrupting Chemicals (EDCs): Both natural and synthetic hormones that interfere with endocrine systems [129] [26].
- Micro and Nano-Plastics (MNPs): Plastic fragments smaller than 5 mm that can bioaccumulate and biomagnify along the food chain [26].
- Nanomaterials: Including carbon nanotubes and nano-scale titanium dioxide particles with limited understanding of their environmental fate and effects [26].
Comparative Analysis of Global Regulatory Frameworks
United States Regulatory Approach
The United States employs a multifaceted approach to CEC regulation, characterized by evolving methodologies and framework development. The Environmental Protection Agency (EPA) has developed specific analytical methods to identify and measure certain CECs, though these methods have not undergone multi-laboratory validation and have not been approved for NPDES compliance monitoring purposes [129].
Key EPA Analytical Methods for CECs:
| Method Number | Method Title | Target Compounds |
|---|---|---|
| 1694 | Pharmaceuticals and Personal Care Products in Water, Soil, Sediment, and Biosolids by HPLC/MS/MS (2007) | Suite of 74 pharmaceuticals and personal care products |
| 1698 | Steroids and Hormones in Water, Soil, Sediment, and Biosolids by HRGC/HRMS (2007) | Suite of 27 steroids and hormones |
| 1614A | Brominated Diphenyl Ethers in Water, Soil, Sediment and Tissue by HRGC/HRMS (2010) | Polybrominated diphenyl ethers (PBDEs) |
| 1699 | Pesticides in Water, Soil, Sediment, Biosolids, and Tissue by HRGC/HRMS (2007) | Organochlorine pesticides |
The U.S. approach also includes the Contaminants of Emerging Concern Framework developed by the Interstate Technology and Regulatory Council (ITRC), which helps environmental regulatory agencies and stakeholders identify CEC monitoring programs, evaluate potential hazards, and communicate risks to the public [128].
For specific CEC classes like PFAS, the U.S. has implemented significant regulatory updates in 2025, including:
- Significant New Use Rule (SNUR): Prevents manufacturing or processing of inactive PFAS without EPA review and risk determination [130]
- Enhanced TRI Reporting: Nine additional PFAS added to Toxics Release Inventory reporting requirements, bringing total reportable PFAS to 205 [130]
- TSCA Section 8(a)(7): Requires manufacturers and importers to report on PFAS use since 2011 [130]
European Union Regulatory Framework
The European Union has adopted a comprehensive and often precautionary approach to CEC regulation, with several significant developments in 2025:
Updated Toy Safety Requirements: The Council of the EU and European Parliament reached a provisional agreement that expands the ban on carcinogenic, mutagenic, and toxic for reproduction chemicals (CMR) to include endocrine disruptors, skin sensitizers, and introduces a limited ban on intentional use of PFAS in toys [131].
Ecodesign for Sustainable Products Regulation (ESPR): The 2025-2030 working plan prioritizes steel and aluminum, textiles, furniture, tires, and mattresses for ecodesign requirements, focusing on minimum durability, resource efficiency, and recycled content [131].
Proposed Hexavalent Chromium Restrictions: The European Chemicals Agency (ECHA) has concluded that EU-wide restrictions for hexavalent chromium substances are justified as they represent "among the most potent workplace carcinogens" [131].
Comparative Analysis: U.S. vs. China
Research comparing risk regulation in the United States and China reveals selective variations rather than sharp contrasts. A quantitative study comparing the relative stringency of federal/central level written rules for 45 randomly selected environmental risks found that overall environmental risk regulation is somewhat more stringent in the United States, but the difference is much smaller than conventional impressions would suggest [132] [133].
Comparative Stringency of U.S. vs. Chinese Environmental Regulations [132] [133]:
| Regulatory Aspect | United States | China |
|---|---|---|
| Overall Stringency Score (0 = equivalent) | +0.06 | - |
| Number of Risks More Stringently Regulated (out of 45) | 27 | 13 |
| Risks with Equivalent Stringency | 5 | 5 |
| Sectoral Strengths | Toxic chemicals, most air pollutants, environmental, energy, manufacturing, and chemicals sectors | Agriculture, transportation sectors |
| International Trade Implications (out of 45 risks) | 25 more stringent | 12 more stringent |
This research demonstrates that neither country dominates relative regulatory stringency, with each regulating some risks more stringently than the other. The pattern reveals selective variation across particular risks rather than sharp contrasts in national stances [132].
Analytical Methodologies for CEC Detection and Quantification
Advanced Analytical Techniques
The detection and quantification of CECs require sophisticated analytical approaches due to their typically low environmental concentrations and complex matrices. The following techniques have become central to CEC identification and quantification:
Chromatographic Techniques:
- High-Performance Liquid Chromatography (HPLC)
- Gas Chromatography (GC)
- High-Resolution Gas Chromatography (HRGC)
Mass Spectrometric Techniques:
- Mass Spectrometry (MS)
- High-Resolution Tandem Techniques (LC-MS/MS)
- High-Resolution Accurate-Mass (HRAM) Mass Spectrometry
Molecular and Biochemical Tools:
Experimental Workflow for CEC Analysis
The following diagram illustrates the comprehensive analytical workflow for identifying and quantifying contaminants of emerging concern in environmental samples:
CEC Analytical Workflow
Research Reagent Solutions and Essential Materials
The analysis of CECs requires specialized reagents and materials to ensure accurate identification and quantification. The following table details key research solutions and their applications in CEC analysis:
| Research Reagent / Material | Function in CEC Analysis | Application Examples |
|---|---|---|
| HPLC/MS/MS Grade Solvents | High-purity mobile phases for chromatographic separation | EPA Method 1694 for PPCPs [129] |
| Solid-Phase Extraction (SPE) Cartridges | Concentration and cleanup of trace contaminants from water matrices | Isolation of pharmaceuticals and steroids [129] |
| Isotope-Labeled Internal Standards | Quantification and compensation for matrix effects | Accurate quantification of target analytes [134] |
| Derivatization Reagents | Enhance volatility and detection for GC-based methods | Analysis of steroids and hormones (EPA Method 1698) [129] |
| Quality Control Materials | Verify method accuracy, precision, and recovery | Ongoing data quality assessment [128] |
| Certified Reference Materials | Method validation and calibration | Quantification of PBDEs (EPA Method 1614A) [129] |
Regulatory Implementation and Quality Infrastructure
Quality Infrastructure Systems
Effective regulation of CECs depends on robust quality infrastructure (QI) systems, defined as "the organizations (public and private) together with the policies, relevant legal and regulatory framework, and practices needed to support and enhance the quality, safety and environmental soundness of goods, services and processes" [135]. The core pillars of QI systems include:
- Standardization: Development of documents providing rules, guidelines, or characteristics for products or processes [135]
- Metrology: The science of measurement and its application, including scientific, legal, and industrial metrology [135]
- Accreditation: Third-party attestation that a conformity assessment body is competent to carry out specific assessment activities [135]
- Conformity Assessment: Procedures used to determine that relevant requirements in technical regulations or standards are fulfilled [135]
- Market Surveillance: Measures authorities take to ensure products comply with legislation's operational requirements [135]
Strategic Approaches for Emerging Contaminants
Public health organizations like the National Institute of Environmental Health Sciences (NIEHS) have developed strategic approaches to address CECs, including:
- Horizon-Scanning Activities: Proactive identification of emerging contaminants and issues of concern [119]
- Rapid Response Mechanisms: Capabilities for timely response to public health emergencies involving toxicological hazards [119]
- Fit-for-Purpose Research Responses: Leveraging capabilities to address emerging contaminants, diseases, and disasters [119]
The NIEHS Division of Translational Toxicology employs these approaches for various CECs, including glyphosate, microcystin-LR, sulfolane, and chemicals from environmental disasters like the East Palestine, Ohio train derailment [119].
Global Trends and Future Directions
Increasing Regulatory Coordination
The global regulatory landscape for CECs shows increasing coordination through mechanisms such as:
- International Standardization: Growing alignment on testing methodologies and risk assessment frameworks [135]
- Information Sharing: Enhanced data exchange on chemical hazards and exposures [119]
- Policy Learning: Transnational emulation of effective regulatory approaches [132]
Sector-Specific Regulations
Different sectors face varying regulatory challenges for CECs:
Textiles and Apparel:
- California's AB-1817 prohibiting regulated PFAS in textile articles [130]
- Colorado's phase-out of PFAS in outdoor apparel [130]
Consumer Products:
- EU restrictions on PFAS in toys with exemptions for electronic components [131]
- Minnesota's Amara's Law restricting PFAS in numerous consumer product categories [130]
Pharmaceuticals:
- EU pharmaceutical package focusing on regulatory data protection and supply obligations [131]
Scientific and Technological Advancements
Future regulatory frameworks will be shaped by ongoing scientific and technological developments:
- Advanced Monitoring Technologies: Improved sensitivity and specificity for CEC detection [26] [134]
- Computational Toxicology: Enhanced prediction of chemical hazards and risks [119]
- Alternative Assessment Methods: Development of non-animal testing approaches for ecological and human health effects [119]
The policy and regulatory landscape for contaminants of emerging concern represents a dynamic and evolving field characterized by significant international variation yet growing coordination. The comparative analysis reveals that while regulatory stringency differs between major economies like the United States, European Union, and China, these differences are selective and risk-specific rather than systematic. Effective management of CECs requires a multidimensional approach involving advanced analytical science, environmental monitoring, policy action, and public awareness. As detection capabilities continue to improve and scientific understanding of the ecological and health impacts of CECs advances, regulatory frameworks will need to remain adaptive and responsive to emerging threats. The ongoing development of quality infrastructure systems, international standardization, and collaborative research initiatives will be crucial for crafting effective regulatory responses and sustainable management strategies to mitigate the rising threat of emerging contaminants globally.
Conclusion
The study of Contaminants of Emerging Concern represents a critical frontier in environmental health, demanding an integrated approach that spans molecular biology, advanced analytics, and proactive regulation. Key takeaways include the confirmed role of CECs in inducing epigenetic changes and chronic diseases, the powerful yet challenging capabilities of modern detection technologies, and the significant gaps in current risk assessment frameworks, particularly for chemical mixtures. For biomedical and clinical research, future directions must prioritize the development of high-throughput, real-time biosensors, the deep integration of exposomics and epigenetics to understand long-term health effects, and the establishment of robust, health-based regulatory standards. Collaborative efforts across disciplines are essential to translate scientific understanding into effective public health interventions and environmental protection policies, ultimately mitigating the risks posed by these pervasive contaminants.
References
- 1. CEC White Paper - Contaminants of Emerging Concern - ITRC [https://cec-1.itrcweb.org/1-cec-white-paper/]
- 2. Contaminants of Emerging Concern (CECs): Occurrence and ... [https://pmc.ncbi.nlm.nih.gov/articles/PMC8705372/]
- 3. Contaminants of emerging concern (CECs), including ... [https://www.epa.gov/wqc/contaminants-emerging-concern-including-pharmaceuticals-and-personal-care-products]
- 4. Understanding CECs in the Environment - EHSLeaders [https://ehsleaders.org/2013/11/understanding-cecs-in-the-environment/]
- 5. Addressing the global data imbalance of contaminants of ... [https://pubs.rsc.org/en/content/articlehtml/2025/su/d5su00144g]
- 6. Emerging Contaminants Research Plan [https://www.sccwrp.org/about/research-areas/research-plan/emerging-contaminants-research-plan/]
- 7. Analytical method to monitor contaminants of emerging ... [https://www.sciencedirect.com/science/article/abs/pii/S0021967322002047]
- 8. Understanding emerging contaminants in water and ... [https://www.sciencedirect.com/science/article/pii/S2772416625001664]
- 9. Agricultural Runoff: Causes, Effects, and Solutions for ... [https://krakensense.com/blog/agricultural-runoff]
- 10. Sources and Solutions: Agriculture | US EPA [https://www.epa.gov/nutrientpollution/sources-and-solutions-agriculture]
- 11. Nonpoint Source: Agriculture | US EPA [https://www.epa.gov/nps/nonpoint-source-agriculture]
- 12. Sources and Solutions: Wastewater [https://www.epa.gov/nutrientpollution/sources-and-solutions-wastewater]
- 13. Exposure to environmental pollutants: A mini-review on the ... [https://pmc.ncbi.nlm.nih.gov/articles/PMC11180043/]
- 14. Urban Stormwater: An Overlooked Pathway of Extensive ... [https://pmc.ncbi.nlm.nih.gov/articles/PMC7370854/]
- 15. The pollution conveyed by urban runoff: A review of sources [https://www.sciencedirect.com/science/article/pii/S0048969719361212]
- 16. Phthalates and epigenetics: An emerging public health concern [https://pmc.ncbi.nlm.nih.gov/articles/PMC12639268/]
- 17. Gene-Environment Interactions in the Development of ... [https://www.mdpi.com/1660-4601/5/1/4]
- 18. Gene-environment interactions within a precision ... [https://pmc.ncbi.nlm.nih.gov/articles/PMC11293590/]
- 19. Predicting Human Health Effects from Environmental Exposures [https://www.ncbi.nlm.nih.gov/books/NBK564101/]
- 20. The emerging intertwined activities of metabolism and ... [https://www.nature.com/articles/s12276-025-01537-7]
- 21. Immune-Epigenetic Effects of Environmental Pollutants [https://pubmed.ncbi.nlm.nih.gov/41020825/]
- 22. G × E interactions as a basis for toxicological uncertainty [https://pmc.ncbi.nlm.nih.gov/articles/PMC10256652/]
- 23. Biomarkers in environmental and human health risk ... [https://www.sciencedirect.com/science/article/abs/pii/S0025326X06002979]
- 24. Biomarkers of Exposure, Effect and Susceptibility to ... [https://www.frontiersin.org/research-topics/10926/biomarkers-of-exposure-effect-and-susceptibility-to-environmental-and-occupational-chemicals/magazine]
- 25. Time to strengthen the governance of new contaminants in ... [https://www.nature.com/articles/s41467-025-63217-4]
- 26. A comprehensive review of emerging environmental ... [https://link.springer.com/article/10.1007/s44274-025-00259-x]
- 27. Contaminants of Emerging Concern - ITRC [https://cec-1.itrcweb.org/]
- 28. A comprehensive review of emerging environmental ... [https://communities.springernature.com/posts/a-comprehensive-review-of-emerging-environmental-contaminants-of-global-concern]
- 29. RNA-seq reveals potential gene biomarkers in Pimephales ... [https://pmc.ncbi.nlm.nih.gov/articles/PMC12424080/]
- 30. News - Community Engagement Core (CEC) [https://www.urmc.rochester.edu/environmental-health-sciences/community-engagement-core/news?start=01-01-2025&end=12-31-2025]
- 31. About the Center for Leadership in Environmental Awareness [https://clear.wayne.edu/about]
- 32. Novel biomarkers of fetal and neonatal environmental ... [https://www.nature.com/articles/s41390-025-03816-5]
- 33. Our Current Understanding of the Human Health and ... [https://www.epa.gov/pfas/our-current-understanding-human-health-and-environmental-risks-pfas]
- 34. PFAS Molecules: A Major Concern for the Human Health ... [https://pmc.ncbi.nlm.nih.gov/articles/PMC8878656/]
- 35. Occurrence and risk assessment of different cyanotoxins ... [https://www.sciencedirect.com/science/article/abs/pii/S0013935125004359]
- 36. Cyanotoxins in Bloom: Ever-Increasing Occurrence and ... [https://pmc.ncbi.nlm.nih.gov/articles/PMC9029585/]
- 37. Metabolomic analysis reveals contrasting effects of PFOS ... [https://www.sciencedirect.com/science/article/abs/pii/S0269749125007134]
- 38. Environmental and Exposure Pathways - NCBI - NIH [https://www.ncbi.nlm.nih.gov/books/NBK225345/]
- 39. How PFAS Impacts Your Health | ATSDR [https://www.atsdr.cdc.gov/pfas/about/health-effects.html]
- 40. HPLC 2025 Preview: Prioritization Strategies in Non-Target ... [https://www.chromatographyonline.com/view/hplc-2025-preview-prioritization-strategies-in-non-target-screening-of-environmental-samples-by-chromatography-with-high-resolution-mass-spectrometry]
- 41. Environmental Applications of Mass Spectrometry for ... [https://pubmed.ncbi.nlm.nih.gov/39860232/]
- 42. High resolution mass spectrometry-based screening for the ... [https://www.sciencedirect.com/science/article/pii/S0048969724014323]
- 43. Emerging Contaminants Analysis [https://www.thermofisher.com/ipac-other/en/home/industrial/environmental/environmental-learning-center/contaminant-analysis-information/emerging-contaminants-analysis.html]
- 44. A Practical Method for Trace Level Analysis of Chlorinated ... [https://www.chromatographyonline.com/view/practical-method-trace-level-analysis-chlorinated-organic-pesticides-gas-chromatography-mass-spectro]
- 45. Assessment of environmental pollutants at trace levels using ... [https://pmc.ncbi.nlm.nih.gov/articles/PMC10446945/]
- 46. Molecularly Imprinted Plasmonic Sensors for the ... [https://www.mdpi.com/2227-9040/11/6/318]
- 47. Recent advances in illicit drug detection sensor technology ... [https://www.sciencedirect.com/science/article/abs/pii/S0165993623003825]
- 48. Advancements in nanomaterials for nanosensors [https://pmc.ncbi.nlm.nih.gov/articles/PMC11304082/]
- 49. Comparison of Performance Parameters of Conventional ... [https://link.springer.com/article/10.1007/s11468-007-9026-y]
- 50. Colorimetric Plasmonic Nanosensors for Environmental ... [https://www.sciltp.com/journals/mi/articles/2507000937]
- 51. Assessing Environmental Risks during the Drug Development ... [https://pmc.ncbi.nlm.nih.gov/articles/PMC11019539/]
- 52. Biomonitoring and Biomarkers: Exposure Assessment Will ... [https://pmc.ncbi.nlm.nih.gov/articles/PMC1552022/]
- 53. About the Biomonitoring Data Tables | National Exposure ... [https://www.cdc.gov/environmental-exposure-report/data-tables/index.html]
- 54. Biomarkers, matrices and analytical methods targeting ... [https://www.sciencedirect.com/science/article/pii/S0160412020320377]
- 55. Occurrence, bioaccumulation, and ecological risk ... [https://www.sciencedirect.com/science/article/pii/S2405665025000678]
- 56. Immune–Epigenetic Effects of Environmental Pollutants [https://pmc.ncbi.nlm.nih.gov/articles/PMC12468955/]
- 57. What is Grab Sampling [https://www.swagelok.com/en/blog/introduction-grab-sampling]
- 58. vs. Active Air Passive ... - Tisch Sampling Environmental [https://tisch-env.com/difference-between-passive-and-active-air-sampling/]
- 59. Combination of passive and grab sampling strategies ... [https://www.sciencedirect.com/science/article/abs/pii/S0048969718336477]
- 60. Comparison of Auto Sampling and Passive ... [https://pmc.ncbi.nlm.nih.gov/articles/PMC8955177/]
- 61. ASSESSING ACTIVE AND PASSIVE SAMPLING ... [https://riversymposium.scholar.bucknell.edu/2025/11/05/assessing-active-and-passive-sampling-techniques-for-emerging-contaminants-using-nested-watershed-monitoring/]
- 62. [Research Progress on Passive Technology for Emerging...] Sampling [https://pubmed.ncbi.nlm.nih.gov/41093399/]
- 63. From capture to detection: A critical review of passive ... [https://www.sciencedirect.com/science/article/pii/S0043135424009242]
- 64. 4. Data Comparison Methods [https://psu-1.itrcweb.org/4-data-comparison-methods/]
- 65. Future of Environmental Research in the Age ... [https://pmc.ncbi.nlm.nih.gov/articles/PMC5346048/]
- 66. Merging the exposome into an integrated framework for ... [https://pmc.ncbi.nlm.nih.gov/articles/PMC8924626/]
- 67. Using Exposomics to Assess Cumulative Risks and Promote ... [https://pmc.ncbi.nlm.nih.gov/articles/PMC4636923/]
- 68. Comprehensive Transcriptomic and Epigenomic Insights ... [https://pmc.ncbi.nlm.nih.gov/articles/PMC12324268/]
- 69. A precision environmental health approach to prevention of ... [https://www.nature.com/articles/s41467-023-37626-2]
- 70. Insights from in vitro, in vivo, and population studies [https://www.sciencedirect.com/science/article/abs/pii/S0957582025013291]
- 71. Integration of “Omics”-Based Approaches in Environmental ... [https://pmc.ncbi.nlm.nih.gov/articles/PMC12473558/]
- 72. Chemical and climatic environmental exposures ... [https://www.sciencedirect.com/science/article/pii/S0013935125005985]
- 73. Strategies for the Detection and Elimination of Matrix ... [https://www.chromatographyonline.com/view/strategies-detection-and-elimination-matrix-effects-quantitative-lc-ms-analysis]
- 74. Py–GC–MS analysis for microplastics: Unlocking matrix ... [https://www.sciencedirect.com/science/article/pii/S0043135424009552]
- 75. Integrated computational and experimental pipeline for ... [https://www.nature.com/articles/s41598-021-95935-2]
- 76. Protocol for the quantitative characterization of cell ... [https://pmc.ncbi.nlm.nih.gov/articles/PMC12336826/]
- 77. 14 Comparing quantitative data between individuals [https://bookdown.org/pkaldunn/SRM-Textbook/BetweenQuantData.html]
- 78. Presenting Quantitative Data Graphically [https://courses.lumenlearning.com/waymakermath4libarts/chapter/presenting-quantitative-data-graphically/]
- 79. Text has enhanced contrast | ACT Rule | WAI [https://www.w3.org/WAI/standards-guidelines/act/rules/09o5cg/]
- 80. Text has enhanced contrast - Rules - Siteimprove [https://alfa.siteimprove.com/rules/sia-r66]
- 81. Elements must meet minimum color contrast ratio thresholds [https://dequeuniversity.com/rules/axe/4.8/color-contrast]
- 82. 7 Best Comparison Charts for Effective Data Visualization [https://ninjatables.com/types-of-comparison-charts/?srsltid=AfmBOoqjj-UvD_3dEGBBIY_d_75k_QWon3gp68lVlP7hB5eDItvOWzZd]
- 83. Comprehensive review of emerging contaminants [https://www.sciencedirect.com/science/article/pii/S0147651324004962]
- 84. Challenges and Solutions in 2024 - Water & Wastewater [https://www.waterandwastewater.com/pharmaceutical-wastewater-management-challenges-and-solutions-in-2024/]
- 85. Boosting Pristine water in treatment systems [https://environment.ec.europa.eu/news/life-pristine-protecting-environment-through-contaminant-removal-2025-02-11_en]
- 86. Evaluation of operational challenges and technological ... [https://www.nature.com/articles/s41598-025-17945-8]
- 87. Wastewater treatment in 2050: Challenges ahead and ... [https://pmc.ncbi.nlm.nih.gov/articles/PMC9488100/]
- 88. Data evaluation for wastewater treatment plants: Linear vs ... [https://www.sciencedirect.com/science/article/abs/pii/S009813542500016X]
- 89. Time to strengthen the governance of new contaminants in ... [https://pmc.ncbi.nlm.nih.gov/articles/PMC12367988/]
- 90. Guidance Document on the Validation of (Quantitative) ... [https://www.oecd.org/en/publications/guidance-document-on-the-validation-of-quantitative-structure-activity-relationship-q-sar-models_9789264085442-en.html]
- 91. Quantitative Structure-Activity Relationships Project [https://www.oecd.org/en/topics/sub-issues/assessment-of-chemicals/quantitative-structure-activity-relationships-project.html]
- 92. EPA Sharpens the Focus of Its PFAS Regulatory Framework ... [https://pfas.pillsburylaw.com/epa-pfas-regulatory-framework-october-2025-update/]
- 93. May/June 2025 Regulatory Update [https://www.nacwa.org/news-publications/news-detail/2025/07/01/may-june-2025-regulatory-update]
- 94. Mixture Risk Assessment of Complex Real-Life ... [https://www.mdpi.com/1660-4601/19/20/12990]
- 95. Risk assessment of a mixture of emerging contaminants in ... [https://www.sciencedirect.com/science/article/abs/pii/S0304389418306587]
- 96. Emerging contaminants: A One Health perspective - PMC [https://pmc.ncbi.nlm.nih.gov/articles/PMC11096751/]
- 97. Identification of Key CEC Variables Fact Sheet [https://cec-1.itrcweb.org/identification-of-key-cec-variables-fact-sheet/]
- 98. Predicted Environmental Concentration - an overview [https://www.sciencedirect.com/topics/pharmacology-toxicology-and-pharmaceutical-science/predicted-environmental-concentration]
- 99. A New Method for Environmental Risk Assessment of ... [https://www.mdpi.com/2305-6304/10/11/659]
- 100. Environmental Risk Assessment for the Active Pharmaceutical ... [https://academic.oup.com/etc/article/38/10/2259/7737066]
- 101. Proposal of novel Predicted No Effect Concentrations ... [https://www.nature.com/articles/s41598-025-92692-4]
- 102. Ecological risk assessment of the presence ... [https://pubmed.ncbi.nlm.nih.gov/24768990/]
- 103. The Role of Biomarkers in the Assessment of Aquatic ... [https://pmc.ncbi.nlm.nih.gov/articles/PMC4750648/]
- 104. Assessment of surface water quality using advanced ... [https://www.sciencedirect.com/science/article/pii/S2590252025000510]
- 105. Human biomarkers associated with low concentrations of ... [https://www.nature.com/articles/s41598-021-93337-y]
- 106. Evaluating groundwater quality through contaminant ... [https://www.frontiersin.org/journals/environmental-science/articles/10.3389/fenvs.2025.1636843/full]
- 107. Environmental fate, ecotoxicity biomarkers, and potential ... [https://www.sciencedirect.com/science/article/abs/pii/S0304389420318999]
- 108. Ground Water to Surface Water Component [https://www.epa.gov/superfund/section-15-surface-water-ground-water-surface-water-component]
- 109. A combined approach of chemical analysis and zebrafish ... [https://pubmed.ncbi.nlm.nih.gov/40315748/]
- 110. Integrating Bioindicators and Biomarkers in Aquatic ... [https://www.mdpi.com/2076-3417/13/21/11920]
- 111. potential risks for aquatic ecosystems and human health [https://link.springer.com/article/10.1007/s42452-025-07716-5]
- 112. Applications and challenges of biomarker-based predictive ... [https://www.frontiersin.org/journals/public-health/articles/10.3389/fpubh.2025.1633487/full]
- 113. Advancing human health risk assessment: the role of new ... [https://pmc.ncbi.nlm.nih.gov/articles/PMC12537679/]
- 114. Methods for the determination of biomarkers of exposure ... [https://pmc.ncbi.nlm.nih.gov/articles/PMC4687402/]
- 115. Validation of Biomarker-based risk prediction models - PMC [https://pmc.ncbi.nlm.nih.gov/articles/PMC3896456/]
- 116. Biomarker-enhanced cardiovascular risk prediction in ... [https://www.sciencedirect.com/science/article/pii/S1538783624004367]
- 117. Data-driven identification of predictive risk biomarkers for ... [https://www.nature.com/articles/s41467-024-46663-4]
- 118. Computational insights into exploring the potential effects ... [https://www.nature.com/articles/s41598-025-96193-2]
- 119. Emerging Contaminants and Issues of Concern [https://www.niehs.nih.gov/research/atniehs/dtt/strategic-plan/responsive/emerging]
- 120. Improving the adsorption efficiency of a low-cost natural ... [https://pubs.rsc.org/en/content/articlehtml/2025/ma/d5ma00253b]
- 121. Study of linear and nonlinear isotherm and kinetic ... [https://www.nature.com/articles/s41598-025-97588-x]
- 122. Integrated photocatalytic advanced oxidation system (TiO 2 ... [https://www.sciencedirect.com/science/article/abs/pii/S1383586619305052]
- 123. A review of UV-based advanced oxidation processes in ... [https://www.sciencedirect.com/science/article/pii/S1944398625004047]
- 124. Energy Efficient Forward Osmosis to Maximize Dewatering ... [https://pmc.ncbi.nlm.nih.gov/articles/PMC12195207/]
- 125. Application for the Forward of Emerging... Osmosis Removal [https://pmc.ncbi.nlm.nih.gov/articles/PMC10384920/]
- 126. Emerging membrane technologies for sustainable water treatment... [https://pubs.rsc.org/en/content/articlehtml/2025/va/d4va00378k]
- 127. Forward Osmosis and Membrane Distillation [https://link.springer.com/article/10.1007/s11947-025-03930-6]
- 128. Contaminants of Emerging Concern Framework [https://itrcweb.org/cec-framework-guide/]
- 129. CWA Analytical Methods: Contaminants of Emerging ... [https://www.epa.gov/cwa-methods/cwa-analytical-methods-contaminants-emerging-concern]
- 130. New Global PFAS Regulations: How to Remain Compliant in ... [https://blog.sourceintelligence.com/pfas-regulations-how-to-remain-compliant]
- 131. Global Environmental Regulatory Development Update for ... [https://natlawreview.com/article/global-regulatory-developments-june-2025]
- 132. Comparing U.S. and Chinese Environmental Risk Regulation [https://www.theregreview.org/2021/12/20/xu-wiener-comparing-us-chinese-environmental-risk-regulation/]
- 133. Comparing Environmental Risk Regulations in China and ... [https://pubmed.ncbi.nlm.nih.gov/34387891/]
- 134. Emerging Contaminants Analysis [https://www.thermofisher.com/us/en/home/industrial/environmental/environmental-learning-center/contaminant-analysis-information/emerging-contaminants-analysis.html]
- 135. Reinforcing Regulatory Frameworks through Standards ... [https://www.oecd.org/en/publications/reinforcing-regulatory-frameworks-through-standards-measurements-and-assurance_f398be90-en/full-report/reader-s-guide_8b21170b.html]