Greener Chromatography: How In Silico Modeling is Reducing Environmental Impact in Analytical Labs
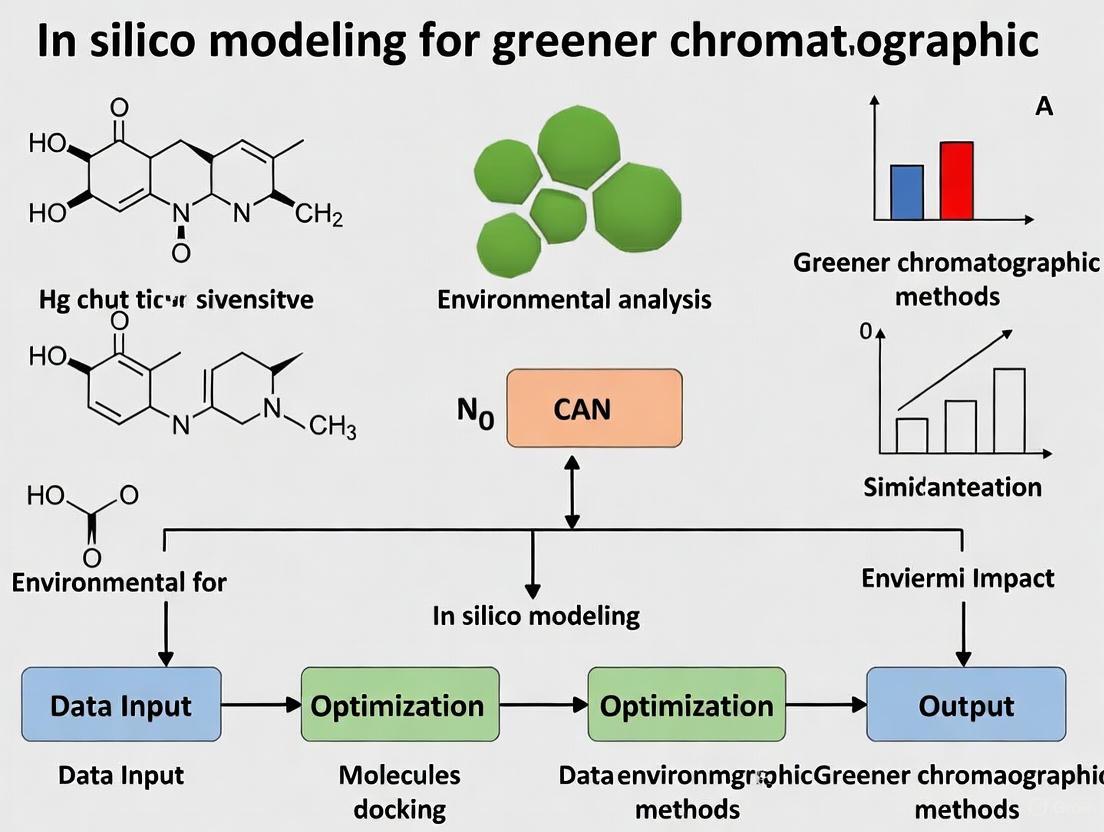
This article explores the transformative role of in silico modeling in developing greener chromatographic methods for environmental analysis.
Greener Chromatography: How In Silico Modeling is Reducing Environmental Impact in Analytical Labs
Abstract
This article explores the transformative role of in silico modeling in developing greener chromatographic methods for environmental analysis. It establishes the environmental challenges of traditional chromatography, detailing the significant solvent consumption and waste generation. The piece then provides a practical guide to the foundational principles, software tools, and methodologies—including Quantitative Structure-Retention Relationship (QSRR) and Design of Experiments (DoE)—that enable scientists to replace hazardous solvents, optimize separations, and prevent waste through computer simulation. Further, it addresses troubleshooting and optimization strategies for robust method development and examines critical validation frameworks and comparative studies that prove the real-world efficacy and regulatory credibility of these in silico approaches. Aimed at researchers, scientists, and drug development professionals, this article serves as a comprehensive resource for leveraging computational power to achieve sustainability goals without sacrificing analytical performance.
The Green Imperative: Why Chromatography Needs In Silico Solutions
Chromatography is a cornerstone analytical technique in environmental, pharmaceutical, and biotechnological research. However, conventional methodologies carry a significant environmental burden, primarily due to high consumption of hazardous solvents and substantial energy demands [1]. The principles of Green Analytical Chemistry seek to redefine these practices by minimizing the ecological footprint of analytical methods [2]. This application note details the environmental impact of traditional chromatography and provides validated, greener protocols centered on in silico modeling to reduce solvent waste and energy consumption without compromising analytical performance. These protocols are designed for integration into a broader research thesis on sustainable analytical techniques.
Quantifying the Environmental Impact
The environmental impact of traditional chromatography can be categorized into solvent-related waste and energy consumption. The tables below summarize core issues and quantitative comparisons between traditional and alternative techniques.
Table 1: Environmental Concerns of Traditional Chromatography Practices
| Aspect | Traditional Practice | Primary Environmental Concern |
|---|---|---|
| Mobile Phase | High volumes of acetonitrile/methanol [1] | Pollution, hazardous waste, high disposal costs [1] [3] |
| Stationary Phase | Silica or polymer-based columns [1] | Intensive chemical processing for production [1] |
| Energy Consumption | High-temperature GC operation; long LC run times [1] | High electricity use for temperature control, solvent delivery, and instrument operation [3] [4] |
| Method Development | Trial-and-error experimentation [5] [3] | Generates significant unnecessary solvent and sample waste [5] [4] |
Table 2: Solvent and Energy Consumption: Traditional vs. Green Alternatives
| Chromatography Technique | Typical Solvent Consumption per Run | Estimated Energy Consumption | Key Environmental Advantages |
|---|---|---|---|
| Traditional HPLC | High (e.g., 2-5 mL/min) [1] | High | Baseline for comparison |
| UHPLC | Significantly less (e.g., <1 mL/min) [1] | Lower due to shorter run times [3] | Reduced solvent purchase and disposal; faster analysis [1] |
| Supercritical Fluid Chromatography (SFC) | Primarily CO₂ with minor organic modifier [1] [6] | Moderate | CO₂ is non-toxic, recyclable, and waste is minimal [1] [6] |
| Microfluidic/Lab-on-a-Chip | Ultra-low volumes (µL-scale) [1] | Very Low | Drastic reduction in all chemical consumption [1] |
In Silico Modeling for Greener Method Development
A pivotal strategy for enhancing sustainability is employing in silico modeling and computer-assisted method development. This approach uses predictive algorithms to simulate chromatographic separations, drastically reducing the need for physical experimentation [5] [4].
The workflow below illustrates how in silico modeling integrates into greener method development.
Key Outcomes of the In Silico Approach
- Solvent Replacement: A study demonstrated the use of in silico modeling to replace a fluorinated mobile phase additive with a chlorinated alternative, reducing the Analytical Method Greenness Score (AMGS) from 9.46 to 4.49 while improving resolution from fully overlapped peaks to a resolution of 1.40 [5].
- Solvent Reduction: The same approach facilitated the replacement of acetonitrile with more environmentally friendly methanol, reducing the AMGS from 7.79 to 5.09 while preserving critical resolution [5].
- Waste Prevention: By predicting optimal conditions upfront, in silico modeling minimizes trial-and-error experiments, directly reducing solvent waste, instrument time, and energy use [3] [4].
Detailed Protocols for Greener Chromatographic Analysis
Protocol 1: Transitioning from HPLC to a Greener UHPLC Method Using In Silico Simulation
Objective: Migrate an existing HPLC method for contaminant analysis to a faster, lower-solvent UHPLC method using in silico modeling software (e.g., AutoChrom, ACD/Labs, or DryLab).
The Scientist's Toolkit:
| Item | Function in Protocol |
|---|---|
| UHPLC System | Enables operation at higher pressures with narrower bore columns, reducing flow rates and solvent consumption [1]. |
| C18 Column (e.g., 100 x 2.1 mm, 1.7-1.8 µm) | The stationary phase for separation. Smaller particle size increases efficiency, allowing for shorter column lengths and faster runs [1]. |
| In Silico Modeling Software | Predicts chromatographic outcomes under different conditions (gradient, temperature, pH), identifying optimal parameters with minimal lab experiments [5] [3] [4]. |
| Methanol (HPLC Grade) | A greener solvent alternative to acetonitrile, as classified in several solvent selection guides [5] [3]. |
Procedure:
- Data Input: Enter the original HPLC method parameters (column dimensions, particle size, gradient profile, flow rate, temperature) into the modeling software.
- Column Scaling: Use the software's column scaling function to translate the original method to the new UHPLC column geometry. The software will automatically adjust the flow rate and gradient volume to maintain linear velocity and separation quality.
- Gradient Optimization: Employ the software's modeling capabilities to simulate the separation across a range of gradient times and slopes. The goal is to identify the shortest possible runtime that maintains baseline resolution (>1.5) for all critical peak pairs.
- Solvent Replacement Simulation: Model the separation using methanol as the organic modifier instead of acetonitrile. Adjust the gradient profile as needed to achieve comparable selectivity and resolution.
- Experimental Verification: Execute the in silico-optimized method on the physical UHPLC system. Inject the sample and compare the results with the software's prediction. Fine-tune the method if necessary.
Protocol 2: Implementing Supercritical Fluid Chromatography (SFC) for Natural Product Analysis
Objective: Develop a green SFC method for the separation of flavonoids from a plant extract, utilizing carbon dioxide as the primary mobile phase.
The Scientist's Toolkit:
| Item | Function in Protocol |
|---|---|
| SFC System | Chromatography system designed to handle supercritical CO₂, including a pump for CO₂, a co-solvent pump, and a backpressure regulator. |
| 2-Ethylpyridine Column | A common stationary phase for SFC, providing good selectivity for a wide range of natural products. |
| Supercritical CO₂ | The primary mobile phase. It is non-toxic, non-flammable, and largely recyclable, drastically reducing organic solvent waste [1] [6]. |
| Food Grade CO₂ Supply | Source of the primary mobile phase. |
| Methanol (with 0.1% Formic Acid) | The co-solvent (modifier) used to fine-tune the elution strength and selectivity of the supercritical CO₂ mobile phase. |
Procedure:
- System Equilibration: Set the system backpressure to 150 bar and the column temperature to 40 °C. Begin a flow of 95% CO₂ and 5% methanol at 2.0 mL/min until a stable baseline is achieved.
- Initial Scouting: Perform an initial isocratic run at 5% co-solvent for 5 minutes, followed by a gradient from 5% to 40% co-solvent over 10 minutes. This helps determine the approximate retention window of the analytes.
- Gradient Optimization: Based on the scouting run, design a shallower gradient to improve resolution of critical pairs. For example, use a gradient from 10% to 30% methanol over 12 minutes.
- Fraction Collection (Optional): If purifying a specific compound, connect a fraction collector. Set collection time windows based on the UV trace of the analytical run.
- Solvent Recovery: At the end of the run, the majority of the CO₂ mobile phase vaporizes and can be vented or captured for reuse, leaving a highly concentrated solution of the analyte in the organic modifier [1].
The environmental footprint of traditional chromatography, characterized by excessive solvent waste and high energy consumption, is a significant challenge that the scientific community must address. The protocols and data presented herein demonstrate that sustainable alternatives are not only feasible but also analytically superior. The integration of in silico modeling is a transformative force, enabling the development of methods that are greener by design—reducing solvent use, replacing hazardous chemicals, and minimizing energy-intensive trial-and-error. By adopting these principles and protocols, researchers and drug development professionals can lead the transition towards a more sustainable and responsible analytical future.
Principles of Green Analytical Chemistry Applied to Separation Science
The field of separation science, particularly chromatography, is undergoing a significant transformation driven by the principles of Green Analytical Chemistry (GAC). Modern laboratories are increasingly focused on sustainability and environmental responsibility, integrating green practices as a key driver of innovation and efficiency [7]. The core objective of GAC is to optimize analytical processes to ensure they are safe, non-toxic, environmentally friendly, and efficient in their use of materials, energy, and waste generation [8]. This is particularly relevant in separation science, where methods have traditionally relied on large volumes of organic solvents, energy-intensive equipment, and procedures that generate significant hazardous waste [9] [6].
The adoption of GAC principles represents both a practical and philosophical shift, encouraging laboratories to challenge long-held assumptions and leverage modern technologies to achieve more sustainable operations [7]. The foundational framework for this transition is provided by the 12 principles of Green Analytical Chemistry, which adapt the original concepts of green chemistry to the specific needs of analytical methodologies [10] [11]. These principles prioritize direct analytical techniques, minimal sample and reagent use, integration of processes, automation, and proper waste management, providing a comprehensive strategy for reimagining separation science to meet the demands of sustainability, safety, and environmental responsibility [10].
The 12 Principles of Green Analytical Chemistry
The 12 principles of Green Analytical Chemistry provide a definitive framework for designing and implementing environmentally benign analytical techniques [10] [11]. When applied to separation science, these principles drive the development of methodologies that are safer, more efficient, and have a reduced ecological footprint. The following table summarizes these principles and their core objectives.
Table 1: The 12 Principles of Green Analytical Chemistry and Their Core Objectives
| Principle Number | Principle Name | Core Objective in Separation Science |
|---|---|---|
| 1 | Direct Techniques | Apply direct analytical techniques to avoid sample treatment [10]. |
| 2 | Minimal Sample Size | Use minimal sample size and number of samples [10]. |
| 3 | In Situ Measurements | Perform in-situ measurements [10]. |
| 4 | Process Integration | Integrate analytical processes and operations to save energy and reagents [10]. |
| 5 | Automation & Miniaturization | Select automated and miniaturized methods [10]. |
| 6 | Avoid Derivatization | Avoid derivatization [10]. |
| 7 | Waste Avoidance | Avoid generation of large waste volumes; proper management [10]. |
| 8 | Multi-Analyte Assays | Choose multi-analyte or multi-parameter methods [10]. |
| 9 | Energy Minimization | Minimize energy consumption [10]. |
| 10 | Natural Reagents | Use reagents from natural sources [10]. |
| 11 | Toxicity Reduction | Use reagents with low toxicity [10]. |
| 12 | Safety Enhancement | Increase operator's safety [10]. |
The key goals in greening analytical methods are the elimination or reduction of chemical substances (solvents, reagents), minimization of energy consumption, proper management of analytical waste, and increased safety for the operator [10]. Most of these issues require reductions in sample number, size, and the amount of chemicals used, alongside the replacement of toxic reagents with less harmful alternatives [10].
Green Chromatography: Strategies and Metrics
Core Greening Strategies
Chromatography, a cornerstone of separation science, has been a major focus for the implementation of GAC principles. Several key strategies have emerged to reduce its environmental impact while maintaining, and often enhancing, analytical performance.
- Reducing Solvent Consumption: A primary environmental concern in liquid chromatography is solvent consumption. Traditional methods rely heavily on organic solvents like acetonitrile and methanol. A primary strategy is the adoption of Ultra-High-Performance Liquid Chromatography (UHPLC), which uses columns with smaller particle sizes and lower mobile phase flow rates, thereby using less solvent while maintaining or improving separation quality [9].
- Adopting Green Solvents: The shift toward green solvents is crucial. This includes exploring alternatives like ethanol, or switching techniques entirely to methods like Supercritical Fluid Chromatography (SFC), which uses supercritical CO₂ as a non-toxic and reusable mobile phase, drastically minimizing the use of harmful organic solvents [9] [6]. Micellar Liquid Chromatography (MLC) also gains popularity for its ability to minimize solvent use [6].
- Enhancing Energy Efficiency: Chromatography instruments can be significant energy consumers. Using instruments with built-in energy-saving features, such as standby modes, and reducing analysis times through optimized workflows or higher-efficiency columns help minimize energy use [9].
- Improving Waste Management: Labs are adopting waste minimization strategies, including recycling or reusing solvents where possible, to drastically reduce the amount of hazardous waste produced [9].
Assessing Greenness: Analytical Metrics
To quantitatively evaluate and compare the environmental friendliness of analytical methods, several metric tools have been developed. Their application is crucial for a objective assessment of a method's greenness.
Table 2: Greenness Assessment Tools for Analytical Methods
| Tool Name | Description | Key Output |
|---|---|---|
| Analytical Method Greenness Score (AMGS) | A metric used to score and compare the greenness of chromatographic methods, allowing for mapping across the entire separation landscape [5]. | Numerical score |
| Analytical GREEnness (AGREE) Tool | A software tool that offers a holistic evaluation of a method's greenness based on the 12 GAC principles, providing an easy-to-interpret score [8]. | Pictorial output with overall score |
| Green Analytical Procedure Index (GAPI) | A tool that assesses the greenness of an analytical method using a color-coded system, considering the entire life cycle of the method [8]. | Color-coded pictogram |
The application of these tools is exemplified in recent research, where a method was transitioned from a fluorinated to a chlorinated mobile phase additive using in silico modeling, reducing the AMGS from 9.46 to 4.49 while improving resolution [5]. In another case, acetonitrile was replaced with more environmentally friendly methanol, reducing the AMGS from 7.79 to 5.09 while preserving critical resolution [5].
In Silico Modeling for Greener Chromatographic Method Development
The Role of In Silico Platforms
A transformative approach to developing greener chromatographic methods is the use of in silico modeling and computer-assisted method development. This technique addresses the traditional, labor-intensive process of method development, which involves significant analyst time for experimentation and refinement and consequently, high consumption of reagents and energy [5]. In silico modeling is presented as a rapid, accurate, and robust green technique to overcome these hurdles.
These platforms leverage Quantitative Structure–Retention Relationships (QSRR), which correlate molecular descriptors of analytes with their chromatographic retention times, to predict separation outcomes under various conditions without physical experimentation [12]. When combined with Design of Experiments (DoE) and the Monte Carlo method (MCM) for simulating chromatographic responses, these tools can predict chromatographic profiles with high accuracy, providing an overview of retention behavior across a wide range of chromatographic conditions prior to any wet lab work [12].
Workflow for In Silico Greening of Chromatographic Methods
The following diagram illustrates the logical workflow for applying in silico modeling to develop greener chromatographic methods, integrating the GAC principles and assessment tools.
Experimental Protocol: In Silico Method Transition from Acetonitrile to Methanol
Objective: To reduce environmental impact and cost by replacing toxic and expensive acetonitrile with greener methanol in a reversed-phase HPLC method, using an in silico platform to maintain chromatographic performance.
Materials & Software Requirements:
- In Silico Platform: ChromSimulator or equivalent chromatographic modeling software [12].
- Molecular Modeling Software: To calculate molecular descriptors (e.g., Dragon, PaDEL).
- Statistical Software: For QSRR model development and DoE (e.g., Minitab, R) [12].
- Analytical Method Greenness Score (AMGS) Calculator: Spreadsheet or script for calculation [5].
- AGREE or GAPI Software: For final greenness assessment [8].
Procedure:
- Data Collection & Model Calibration:
- Input the molecular structures of all analytes into the software.
- The platform will calculate relevant molecular descriptors (e.g., Wlambda3.unity, ATSc5, geomShape) [12].
- Using a historical dataset or a minimal initial DoE, calibrate the QSRR model to correlate the descriptors and chromatographic conditions (e.g., %organic, pH, temperature) with retention time.
Separation Landscape Simulation:
- Define the scope of the simulation. Set the mobile phase composition to scan from 5% to 95% methanol in water/buffer, across a pH range of 2.0 to 8.0, and a temperature range of 25°C to 60°C.
- Run the simulation to predict the retention times and resolutions for all critical pairs of analytes across this multi-dimensional "separation landscape."
AMGS Mapping & Green Condition Identification:
- The software calculates the AMGS for each set of conditions within the landscape. The AMGS incorporates factors like solvent toxicity and energy consumption [5].
- Visualize the data to identify regions where the resolution of the critical analyte pair is ≥ 1.5 and the AMGS is minimized. This identifies conditions that are both analytically successful and environmentally optimal.
Virtual Method Validation:
- From the identified optimal region, select a specific condition (e.g., 65% Methanol, 35% 20mM Phosphate Buffer pH 3.0, Column Temp 40°C, Flow Rate 1.0 mL/min).
- The in silico platform will generate a simulated chromatogram. Confirm that all peaks are resolved and the analysis time is acceptable.
Greenness Assessment:
- Input the final method parameters (solvent type/volume, energy consumption, waste generation) into the AGREE or GAPI tool to obtain a formal greenness assessment and pictogram [8].
Limited Wet-Lab Verification:
- In the laboratory, execute the method predicted by the in silico platform using a standard mixture. A minimal number of verification runs is typically required.
- Compare the experimental retention times and resolution with the predicted values. The model described in the search results achieved a determination coefficient (R²) of over 99.8% and a prediction coefficient (R²pred) of 99.71% in external validation, indicating high reliability [12].
Expected Outcome: The method successfully transitions to using methanol, reducing the AMGS (e.g., from 7.79 with acetonitrile to 5.09 with methanol, as demonstrated in the literature) while preserving the critical resolution of the separation [5].
Essential Reagents and Materials for Green Separation Science
The implementation of GAC principles relies on a suite of specialized reagents and materials designed to reduce environmental impact.
Table 3: Research Reagent Solutions for Green Separation Science
| Reagent/Material | Function | Green Alternative & Rationale |
|---|---|---|
| Mobile Phase Solvent | Dissolves and carries analytes through the chromatographic system. | Supercritical CO₂ (in SFC): Non-toxic, reusable, eliminates vast majority of organic solvents [6]. Ethanol or Methanol: Less toxic and more biodegradable than acetonitrile [9] [5]. |
| Extraction Solvent | Isolates and pre-concentrates analytes from sample matrices. | Natural Deep Eutectic Solvents (NADES): Biodegradable, low toxicity, from renewable sources [6]. Ionic Liquids: Low volatility, reducing inhalation hazards [11]. |
| Sorbent Material | Selectively captures target analytes during sample preparation. | Fabric Phase Sorptive Extraction (FPSE) Membranes: Efficient, minimize solvent use [13]. Solid Phase Microextraction (SPME) Fibers: Solventless extraction, minimal waste [6] [13]. |
| Chromatography Column | Separates analyte mixtures based on chemical interactions. | Durable UHPLC Columns: Withstand higher pressures, longer lifespans, reduced waste [9]. Column Recycling Programs: Vendor programs to repurpose used columns, reducing landfill waste [9]. |
| In Silico Modeling Software | Predicts chromatographic behavior and optimizes methods virtually. | ChromSimulator / QSRR Platforms: Drastically reduces reagent and energy consumption during method development by minimizing lab trials [5] [12]. |
The application of the principles of Green Analytical Chemistry to separation science is an essential and viable pathway toward sustainable laboratory practices. By embracing strategies such as solvent reduction, adoption of alternative solvents, energy efficiency, and—most pivotally—the integration of in silico modeling, separation scientists can significantly reduce the environmental footprint of their work. The framework provided by the 12 GAC principles, supported by quantitative assessment tools like AGREE, GAPI, and AMGS, offers a clear roadmap for this transition. The protocols and reagents outlined in this application note demonstrate that green methods do not necessitate a compromise in analytical performance. Instead, they represent an evolution of the field, aligning scientific rigor with ecological stewardship and economic efficiency, thereby paving the way for more responsible and innovative research in environmental analysis and drug development.
The development of chromatographic methods, long characterized by resource-intensive trial-and-error experimentation, is undergoing a fundamental transformation. The emergence of in silico modeling represents a paradigm shift from empirical optimization to predictive, computer-assisted design. This approach utilizes computational simulations to predict chromatographic behavior, significantly accelerating method development while aligning with the pressing need for greener analytical practices in environmental and pharmaceutical research [4]. By transitioning experiments from the laboratory to the computer, scientists can now explore separation landscapes virtually, minimizing solvent consumption, hazardous waste generation, and overall environmental footprint without sacrificing analytical performance [5] [4].
The core value of in silico modeling lies in its ability to map the complex relationship between chromatographic parameters (e.g., mobile phase composition, temperature, pH) and separation outcomes (e.g., resolution, retention time) [14]. This capability is crucial for implementing Green Analytical Chemistry principles, as separation sciences are notably resource-intensive [5]. Demonstrating this utility, a 2025 study showed that in silico modeling facilitated the replacement of a fluorinated mobile phase additive with a chlorinated alternative, reducing the Analytical Method Greenness Score (AMGS) from 9.46 to 4.49 while simultaneously improving the resolution of a critical pair from fully overlapped to 1.40 [5].
Key Applications and Experimental Protocols
Greener Solvent Replacement and Optimization
Objective: To reduce the environmental impact of a chromatographic method by replacing hazardous solvents with greener alternatives and optimizing conditions in silico.
- Step 1: Define Baseline Method and Greenness Metric Establish the original chromatographic method as a baseline. Calculate its initial Analytical Method Greenness Score (AMGS) or a similar metric to quantify improvement [5].
- Step 2: In Silico Solvent Screening Use predictive software to simulate the separation using alternative, greener solvents. Common substitutions include replacing acetonitrile with methanol or ethanol [5] [15]. Model the retention behavior of all analytes using Quantitative Structure-Retention Relationship (QSRR) calculations or other algorithms [12] [4].
- Step 3: Multi-Parameter Optimization Virtually adjust other critical parameters—such as gradient profile, temperature, and pH—to compensate for any loss of resolution caused by the solvent switch. Generate a resolution map to visualize the entire separation landscape and identify optimal conditions that balance greenness and performance [5] [14].
- Step 4: Experimental Validation Physically execute the top-performing, in silico-identified method. Compare the experimental results with the predictions to validate the model's accuracy.
- Success Criteria: The final validated method should demonstrate a significantly improved greenness score (e.g., reduced AMGS) while maintaining or improving critical resolution compared to the original method [5].
Predictive Method Development for Biomolecules
Objective: To develop a robust reversed-phase liquid chromatography (RPLC) method for proteins or peptides by accurately modeling their complex retention behavior.
- Step 1: Initial Scouting Experiments Perform a limited set of initial experiments using different gradient slopes (e.g., 10-70% B in 10, 20, and 30 minutes) at multiple temperatures (e.g., 20°C, 40°C, 60°C). This data is essential for calibrating the retention model [14].
- Step 2: Selection of Retention Model
Input the experimental data into chromatography simulation software. For biomolecules, which can undergo conformational changes, selecting the correct mathematical model is critical.
- In the absence of strong chaotropic agents, use a second-degree polynomial fit for the relationship between ln k (retention factor) and 1/T (inverse temperature) [14].
- In the presence of strong denaturants (e.g., perchloric acid), a first-degree polynomial (linear) fit may be sufficient, though a second-degree fit often provides superior accuracy [14].
- Step 3: Generation of 3D Resolution Maps Use the calibrated model to simulate the separation across the entire design space of gradient time and temperature. The software will generate a 3D resolution map highlighting regions where critical pair resolution is maximized [14].
- Step 4: Identification of Optimal Conditions and Verification Select the optimal method conditions from the resolution map. First, run the method experimentally and compare the actual chromatogram with the simulated one to verify prediction accuracy (e.g., ∆tR < 0.1%) [14].
- Success Criteria: The predicted and experimental retention times for all analytes show excellent correlation, confirming the model's reliability for method optimization.
In Silico Optimization of Comprehensive 2D-LC (RPLCxRPLC)
Objective: To develop an efficient method for comprehensive two-dimensional liquid chromatography (LCxLC) using a computational shortcut model, avoiding lengthy experimental screening.
- Step 1: Column Pair Selection For the sample mixture, evaluate all possible combinations of available reversed-phase columns. Calculate the Kendall's correlation coefficient for each pair based on the hydrophobic-subtraction model (HSM). Select the column pair with the lowest correlation coefficient, indicating the highest orthogonality and greatest peak capacity for the separation [16].
- Step 2: Multi-Objective Stochastic Optimization
Using a shortcut model that predicts retention time and peak width, perform a computational optimization of key design variables. The model should consider constraints from sample volume, undersampling, and system pressure [16].
- The optimization algorithm simultaneously adjusts the flow rate, mobile phase pH, and sample loop volume.
- The goal is to maximize the overall 2D resolution while minimizing the total analysis time [16].
- Step 3: Model Validation and Robustness Assessment The optimized method conditions obtained in silico are then experimentally implemented. The reliability of the method is assessed by testing its robustness against minor, deliberate variations in flow rate and temperature [16].
- Success Criteria: The in silico-developed LCxLC method achieves baseline separation of all target analytes in a complex mixture, with the entire optimization process completed in minutes rather than days [16].
Quantitative Data and Performance Metrics
The effectiveness of in silico modeling is demonstrated by tangible improvements in both environmental and performance metrics. The following tables summarize key outcomes from recent studies.
Table 1: Environmental and Performance Benefits of In Silico Modeling
| Application | Traditional Approach | In Silico Approach | Improvement | Source |
|---|---|---|---|---|
| Solvent Replacement | Fluorinated additive (AMGS: 9.46), critical pair co-elution | Chlorinated additive (AMGS: 4.49), Resolution: 1.40 | 55% reduction in AMGS, achieved baseline separation | [5] |
| Solvent Replacement | Acetonitrile in mobile phase (AMGS: 7.79) | Methanol in mobile phase (AMGS: 5.09), critical resolution preserved | 35% reduction in AMGS | [5] |
| Method Efficiency | Laborious, trial-and-error experimentation | Predictive modeling and simulation | 40-80% reduction in experiments needed | [17] |
| Process Characterization | Extensive lab-based parameter screening | Mechanistic modeling | ~75% reduction in experimental effort | [18] |
Table 2: Impact of Instrument and Column Selection on Solvent Consumption
| Parameter | Standard Configuration | Green(er) Configuration | Solvent Savings | Source |
|---|---|---|---|---|
| Column Internal Diameter | 4.6 mm | 2.1 mm | ~80% reduction | [15] |
| Particle Technology | 5 µm Fully Porous Particle (FPP) | 1.7 µm UHPLC Particle | ~85% reduction (with time savings) | [15] |
| Particle Architecture | 5 µm FPP | 5 µm Superficially Porous Particle (SPP) | >50% reduction | [15] |
Workflow Visualization
The following diagram illustrates the generalized in silico method development workflow, which can be adapted for various chromatographic applications.
In Silico Method Development Workflow: This flowchart outlines the iterative process of using predictive models to develop chromatographic methods, from initial setup to final validation.
Successful implementation of in silico modeling relies on a combination of software, hardware, and experimental components.
Table 3: Essential Components for an In Silico Modeling Workflow
| Tool Category | Specific Item / Technique | Function & Application |
|---|---|---|
| Predictive Software | Chromatography Simulation Software (e.g., ACD/LC Simulator, GoSilico) | Predicts retention times, models peak shapes, and generates resolution maps under various conditions [14] [18]. |
| Modeling Approach | Quantitative Structure-Retention Relationship (QSRR) | Correlates molecular descriptors with chromatographic retention to enable predictions without physical standards [12]. |
| Modeling Approach | Mechanistic Modeling (e.g., General Rate Model) | Uses physicochemical principles to describe mass transport and adsorption, providing deep process understanding [18]. |
| Modeling Approach | Artificial Neural Networks (ANNs) / Hybrid Models | Data-driven surrogate models that can accelerate optimization, often used alongside mechanistic models [19] [18]. |
| Data Management | Centralized, Standardized Data Platform | Manages historical experimental data in a searchable format, which is crucial for training and validating predictive models [4]. |
| Experimental Calibration | Design of Experiments (DoE) | Plans efficient, minimal experiments for robust model calibration and validation [12]. |
| Column Selection | Hydrophobic-Subtraction Model (HSM) | Aids in selecting orthogonal column pairs for 2D-LC by quantifying column selectivity differences [16]. |
In the modern analytical laboratory, reducing environmental impact is no longer an optional consideration but a critical component of sustainable scientific practice. The Analytical Method Greenness Score (AMGS) has emerged as a quantitative metric to assess and minimize the environmental footprint of chromatographic methods, which traditionally consume large volumes of solvents and generate significant waste [5]. This scoring system enables separation scientists to objectively evaluate and improve the environmental profile of their analytical and preparative methods while maintaining—or even enhancing—chromatographic performance.
The drive toward greener analytical chemistry aligns with the broader adoption of the 12 Principles of Green Chemistry across industrial and research laboratories [4]. Within this framework, chromatography presents a particular challenge due to its extensive solvent consumption, energy requirements, and waste generation. The AMGS provides a standardized approach to quantify these factors, creating a clear pathway for laboratories to decrease their environmental footprint without sacrificing analytical precision or accuracy [5].
Calculating and Applying the AMGS
Core Components of the AMGS Calculation
The AMGS quantifies the environmental impact of chromatographic methods by evaluating multiple parameters, with particular emphasis on solvent selection and consumption. While the precise algorithm may vary based on specific implementation, the score fundamentally assesses:
- Solvent volume per analysis: Total volume of mobile phase consumed during a single analytical run
- Solvent toxicity and environmental impact: Hazard classification of solvents used, with fluorinated compounds typically penalized more heavily
- Energy consumption: Indirect measurement through analysis time and instrument requirements
- Waste generation: Total volume of solvent waste produced per analysis
A lower AMGS indicates a greener method, with optimal scores approaching zero for theoretical ideal methods with minimal environmental impact [5].
Quantitative Examples of AMGS Improvement
The following table summarizes documented AMGS reductions achieved through strategic method modifications:
Table 1: AMGS Reduction Through Method Optimization
| Modification Type | Original AMGS | Optimized AMGS | Performance Change | Environmental Impact |
|---|---|---|---|---|
| Fluorinated to chlorinated mobile phase additive [5] | 9.46 | 4.49 | Resolution improved from fully overlapped to 1.40 | >50% reduction in AMGS |
| Acetonitrile to methanol replacement [5] | 7.79 | 5.09 | Critical resolution preserved | ~35% reduction in AMGS |
| Preparative purification optimization [5] | Not specified | Not specified | 2.5× increased loading capacity | 2.5× fewer replicates required |
These examples demonstrate that significant environmental improvements can be achieved while maintaining or enhancing analytical performance, particularly through solvent substitution and method optimization.
Experimental Protocols for AMGS Assessment and Improvement
Protocol 1: AMGS Mapping Across Separation Landscapes
Objective: To map the AMGS across the entire separation landscape to identify optimal conditions that balance performance and greenness [5].
Materials:
- Chromatography system (HPLC or UHPLC)
- In silico modeling software with method prediction capabilities
- Standard analyte mixture representative of target applications
- Alternative solvent systems (methanol, ethanol, water, etc.)
Procedure:
- Define Method Parameters: Establish critical separation parameters including pH range, gradient profile, temperature, and stationary phase options.
- Initial Experimental Design: Conduct a limited set of physical experiments to validate in silico predictions.
- In Silico Modeling: Input experimental data into modeling software to predict separation outcomes across the entire parameter space.
- AMGS Calculation: Compute the AMGS for each predicted method condition based on solvent volumes, toxicity factors, and energy consumption.
- Resolution Mapping: Simultaneously calculate predicted resolution for all critical peak pairs under each condition.
- Greenness-Performance Optimization: Identify method conditions that meet minimum resolution requirements (typically >1.5) while minimizing AMGS.
- Experimental Verification: Validate top candidate methods through physical experimentation.
Validation: Compare predicted versus experimental retention times, resolution values, and peak symmetry. Methods with >90% prediction accuracy for critical peak pairs are considered validated.
Protocol 2: Solvent Replacement Strategy for AMGS Reduction
Objective: To systematically replace hazardous solvents with greener alternatives while maintaining chromatographic performance [5] [4].
Materials:
- Chromatography system with compatible solvent delivery system
- Solvent selection guide (e.g., ACS GCI Pharmaceutical Roundtable Guide)
- Alternative solvents (methanol, ethanol, acetone, ethyl acetate)
- Waste collection containers for solvent disposal
Procedure:
- Baseline Establishment: Run current method with original solvents to establish baseline performance (retention times, resolution, peak shape).
- Solvent Assessment: Evaluate current solvents against green chemistry principles using established solvent selection guides [4].
- In Silico Screening: Use predictive software to model method performance with alternative solvent systems.
- Gradient Adjustment: Compensate for solvent strength differences by adjusting gradient profiles in silico.
- Selectivity Evaluation: Assess predicted selectivity changes for critical peak pairs with alternative solvents.
- Method Refinement: Fine-tune temperature, pH, and gradient conditions to optimize separation with the greener solvent system.
- Experimental Validation: Conduct physical experiments to verify predicted performance with the optimized method.
- AMGS Calculation: Compute final AMGS for the modified method and compare to original score.
Troubleshooting: If resolution degrades with alternative solvents, consider:
- Adjusting temperature to modify selectivity
- Fine-tuning pH for ionizable compounds
- Implementing segmented gradients to improve specific peak pair separation
- Exploring alternative stationary phases with different selectivity
Protocol 3: Preparative Method Optimization Through Peak Crossover
Objective: To increase loading capacity in preparative chromatography by strategically exploiting peak crossover, thereby reducing solvent consumption through fewer purification replicates [5].
Materials:
- Preparative chromatography system
- In silico modeling software with resolution mapping capabilities
- Target compound for purification
- Collection apparatus
Procedure:
- Analytical Scale Modeling: Develop a high-resolution analytical method for the target mixture using Protocols 1 and 2.
- Loading Study: Conduct small-scale loading studies to determine capacity limits while maintaining resolution.
- Resolution Mapping: Create a comprehensive resolution map showing how peak resolution changes with increasing sample load.
- Crossover Identification: Identify peak pairs that exhibit crossover (co-elution) at specific loading conditions.
- Method Adjustment: Intentionally adjust method conditions to exploit beneficial crossover that increases target compound purity upon collection.
- Scale-Up Prediction: Use in silico modeling to predict preparative-scale performance from analytical data.
- Purification Validation: Execute preparative runs using optimized method and measure yield and purity.
- Environmental Impact Assessment: Calculate total solvent savings achieved through reduced replication requirements.
The Scientist's Toolkit: Essential Research Reagents and Materials
Table 2: Research Reagent Solutions for Green Chromatographic Method Development
| Item | Function | Green Considerations |
|---|---|---|
| Methanol | Replacement for acetonitrile in reversed-phase chromatography [5] | Lower environmental impact, better safety profile, biodegradable |
| Ethanol | Bio-derived solvent for normal and reversed-phase chromatography | Renewable source, low toxicity, biodegradable |
| Water | Primary green solvent for chromatographic mobile phases | Non-toxic, non-flammable, readily available |
| In Silico Modeling Software | Computer-assisted method development to minimize physical experiments [5] [4] | Reduces solvent waste and energy consumption by up to 90% during development |
| UHPLC Systems | High-pressure chromatography instrumentation [4] | Reduces solvent consumption by 60-80% compared to conventional HPLC |
| Solvent Selection Guides | Framework for evaluating solvent environmental impact [4] | Enables informed solvent choices based on comprehensive life-cycle assessment |
| Stationary Phase Selection Tools | In silico prediction of column chemistry suitability [4] | Minimizes experimental column screening, reducing waste |
Workflow Visualization for AMGS-Optimized Method Development
In Silico AMGS Optimization Workflow
Solvent Replacement Strategy for AMGS Reduction
From Theory to Practice: Tools and Techniques for Virtual Method Development
The integration of in silico modeling into chromatographic science represents a paradigm shift, enabling the development of more sustainable and efficient analytical methods. These computational tools align with the principles of Green Analytical Chemistry (GAC) by reducing the need for extensive laboratory experimentation, thereby minimizing solvent consumption, waste generation, and energy usage [6] [20]. In the context of environmental analysis, where methods must be both robust and environmentally responsible, predictive algorithms and simulators offer a pathway to accelerate method development while significantly lowering its ecological footprint.
The transition from traditional, trial-and-error based chromatography optimization to computer-assisted strategies is foundational to modern sustainable research. These approaches are particularly valuable for environmental research, where analysts often deal with complex samples containing numerous unknown contaminants that require precise separation and identification [18] [21].
Fundamental Modeling Approaches
Chromatographic modeling leverages different computational strategies, each with distinct strengths for predicting separation behavior and optimizing method parameters.
Table 1: Core Chromatographic Modeling Approaches
| Model Type | Fundamental Principle | Key Applications | Advantages | Limitations |
|---|---|---|---|---|
| Mechanistic Models | Based on physicochemical principles of mass transport and protein sorption [18]. | Late-stage downstream process characterization; predicting effects of parameter changes on purification [18]. | Provides deep process understanding; suitable for a priori predictions [18]. | Requires significant computational power; complex model calibration [18]. |
| Data-Driven Models | Built using machine learning (ML) and statistical regression without prior mechanistic knowledge [18]. | Poorly characterized settings; optimization of chromatography conditions with minimal experimental data [18]. | No need for explicit equations describing all proteins in a separation [18]. | Dependent on quality and quantity of experimental training data [18]. |
| Quantitative Structure–Retention Relationship (QSRR) | Connects experimental retention behavior to physiochemical properties of molecules [22]. | Prediction of protein retention in ion-exchange and hydrophobic interaction chromatography [22]. | Powerful for predicting chromatographic behavior and biophysical properties [22]. | Requires descriptors derived from molecular structure [22]. |
| Hybrid Models | Combine mechanistic and data-driven approaches [18]. | Forming the basis for digital twins and model-predictive control [18]. | Augments scale-down model data; incorporates real-time process analytical technologies [18]. | Implementation complexity; requires interdisciplinary expertise [18]. |
Essential Software and Algorithms
Retention Modeling and Simulation
Accurate retention time prediction is crucial for effective in silico method development. For small molecules, retention modeling has reached a mature stage, but biomolecules require more sophisticated approaches due to conformational changes under chromatographic conditions [14]. The choice of polynomial fit significantly impacts prediction accuracy:
- For proteins in the absence of strong chaotropic or denaturing reagents, second-degree polynomial fits of ln k vs. 1/T demonstrate superior correlation between experimental and predicted retention times (ΔtR < 0.1%) [14].
- In the presence of chaotropic reagents (e.g., perchloric acid), the accuracy of retention time modeling using a first-degree fit is significantly enhanced, though second-degree fits still provide better prediction [14].
Commercial software such as ACD/LC Simulator enables the construction of linear and polynomial regression retention models as functions of gradient slope, column temperature, and mobile phase composition, facilitating the generation of 3D resolution maps for optimal separation condition identification [14].
Specialty Predictive Tools
- BeeTox Model: A graph attention convolutional neural network (GACNN) model capable of distinguishing bee-toxic chemicals with a prediction accuracy of 0.837, specificity of 0.891, and sensitivity of 0.698 [21].
- AGDISP: Used for predicting pesticide deposition and spray drift, successfully monitoring atrazine drift up to 400 meters from application sites [21].
- Agent-Based Models (ABMs): Simulate complex interactions within systems, such as Listeria dynamics in food facility environments, enabling virtual evaluation of sampling schemes [23].
Experimental Protocols
Protocol: In Silico Optimization of Protein Separation
This protocol details the computer-assisted method development for separating a mixture of six proteins (Cytochrome C, Ribonuclease A, Apomyoglobin, Albumin chicken egg, y-globulin, and Thyroglobulin bovine) using reversed-phase liquid chromatography [14].
Materials and Equipment
Table 2: Research Reagent Solutions and Essential Materials
| Item | Specification | Function/Application |
|---|---|---|
| Column | 2.1 mm × 75 mm, 2.7-µm particles, 1000 Å Halo C4 | Stationary phase for biomolecule separation [14]. |
| Mobile Phase A | 0.1% Trifluoroacetic acid (TFA) in water | Aqueous component providing ion-pairing and pH control [14]. |
| Mobile Phase B | Acetonitrile (Optima-grade) | Organic modifier for gradient elution [14]. |
| Chaotropic Reagent | 0.1 M Perchloric acid | Strong chaotrope for protein denaturation; enhances prediction accuracy [14]. |
| Software | ACD/LC Simulator 2015 Release (Version L10R41) | Chromatographic modeling and simulation platform [14]. |
| Protein Standards | Cytochrome C (~12.4 kDa) to Thyroglobulin bovine (~670 kDa) | Test mixture for method development and validation [14]. |
Computational Method Development Procedure
Experimental Design Input:
- Program three eluent gradients (10–70% B in 10, 20, and 30 minutes) at a flow rate of 0.5 mL/min.
- Execute each gradient at three different temperatures (20, 40, and 60°C) to build a comprehensive dataset [14].
Retention Model Calibration:
- Input experimental retention time data into the simulation software.
- For methods using TFA as mobile phase modifier, apply a second-degree polynomial fit for the ln k vs. 1/T relationship.
- For methods using perchloric acid as a stronger chaotrope, both first and second-degree polynomial fits may be evaluated [14].
Resolution Mapping:
- Allow the software to generate a 3D resolution map based on the input data and selected retention model.
- Identify the global resolution maximum within the parameter space. In the referenced study, this was 10–70%B in 30 minutes at 50°C [14].
Model Validation:
- Compare predicted retention times against experimental results under the identified optimal conditions.
- For the second-degree polynomial fit with TFA, deviations should be minimal (ΔtR < 0.1%) [14].
- If using a first-degree polynomial fit with TFA, significant discrepancies between predicted and experimental retention times will be observed, confirming the inadequacy of this model for proteins under non-denaturing conditions [14].
In Silico Chromatography Optimization Workflow
Protocol: Mechanistic Modeling for Biopharmaceutical Purification
This protocol outlines the establishment of a mechanistic modeling workflow for optimizing protein purification in biopharmaceutical production, which can reduce experimental effort by approximately 75% compared to traditional laboratory-based process characterization [18].
Prerequisites and System Characterization
Experimental Characterization:
- Determine column porosity parameters.
- Conduct resin-specific gradient elution experiments.
- Generate breakthrough curves for model calibration [18].
Model Selection:
- Implement the General Rate Model for mass transport.
- Apply the Steric Mass Action (SMA) model for protein sorption [18].
Model Calibration and Validation Procedure
Parameter Fitting:
- Use experimental data to calibrate model parameters.
- Employ cross-validation techniques to prevent overfitting [18].
Hybrid Model Implementation:
- Combine mechanistic models with data-driven approaches where mechanistic understanding is incomplete.
- Incorporate real-time data from Process Analytical Technologies (PAT) for model refinement [18].
Process Optimization:
- Use the calibrated model to predict optimal resin matrix, pore size, ligand type and density, pH, flow rate, temperature, and conductivity.
- Simulate consecutive, orthogonal purification steps to ensure compatibility between elution conditions of the first step and loading conditions of the next [18].
Greenness Assessment Metrics
The sustainability benefits of in silico method development must be quantified using standardized metrics. Several tools are available to evaluate the environmental impact of chromatographic methods:
- Analytical Method Greenness Score (AMGS): Evaluates environmental impact across multiple dimensions, including energy consumed in solvent production and disposal, safety/toxicity, and instrument energy consumption [24].
- AGREE (Analytical GREEnness): Integrates all 12 GAC principles into a holistic algorithm, providing a single-score evaluation supported by intuitive graphic output [25].
- Analytical Eco-Scale: Provides a penalty-point-based system that quantifies deviation from an ideal green method based on solvent toxicity, energy consumption, and waste generation [25].
A case study on rosuvastatin calcium illustrates the significant environmental impact of analytical methods at scale: with approximately 1,000 batches produced globally each year, chromatographic analysis consumes approximately 18,000 liters of mobile phase annually for a single active pharmaceutical ingredient [24].
Sustainability Benefits of In Silico Modeling
Applications in Environmental Analysis
In silico chromatographic tools find particular utility in environmental risk assessment, where they improve efficiency for pesticide safety management and contaminant analysis:
- Pesticide Risk Assessment: Computational tools can reduce the number of test animals by 0.1–0.15 million and save $50–70 billion compared to conventional testing methods [21].
- Exposure Modeling: Tools like AGDISP successfully monitor pesticide drift, enabling prediction of environmental concentrations and potential exposure routes [21].
- Transformation Pathway Prediction: Molecular modeling can predict pesticide transformation pathways and products in environmental systems, though this remains an emerging application [26].
The integration of in silico tools in environmental analysis supports the transition from a linear "take-make-dispose" model to a Circular Analytical Chemistry (CAC) framework, which minimizes waste and keeps materials in use for as long as possible [20].
Predictive algorithms and chromatographic simulators represent essential tools for developing sustainable analytical methods in environmental research. By leveraging mechanistic models, data-driven approaches, and QSRR principles, researchers can significantly reduce the environmental impact of method development while accelerating the optimization process. The integration of these in silico tools with greenness assessment metrics creates a powerful framework for advancing the goals of Green Analytical Chemistry, particularly in complex application domains such as environmental contaminant analysis and biopharmaceutical purification. As these technologies continue to mature, their ability to predict retention behavior under various conditions will further minimize the need for resource-intensive experimental screening, supporting the scientific community's transition toward more sustainable laboratory practices.
Leveraging Quantitative Structure-Retention Relationship (QSRR) for Retention Prediction
Quantitative Structure-Retention Relationship (QSRR) is a computational approach that establishes mathematical models between molecular descriptors derived from chemical structures and chromatographic retention times (tR) [27] [28]. Since its introduction by Kaliszan in 1977, QSRR has evolved into a powerful tool for predicting retention behavior, elucidating separation mechanisms, and supporting the development of greener analytical methods in environmental science [27] [28]. For research focused on in silico modeling for greener chromatographic methods in environmental analysis, QSRR offers a pathway to significantly reduce experimental trial-and-error, thereby minimizing solvent consumption and waste generation—core principles of Green Analytical Chemistry (GAC) [29] [30].
The fundamental premise of QSRR is that a molecule's retention in a chromatographic system is governed by its inherent physicochemical properties, which can be numerically encoded and modeled [28]. These models enable analysts to predict the chromatographic behavior of known and newly identified compounds, such as environmental contaminants, prior to laboratory analysis, streamlining method development and enhancing the identification confidence in non-targeted screening [31].
Theoretical Background and Key Concepts
The QSRR Workflow
The development and application of a QSRR model follow a structured workflow comprising several key stages [27]:
- Database Curation: Compiling a dataset of chemical structures and their experimentally measured retention times under defined chromatographic conditions.
- Molecular Representation and Descriptor Calculation: Translating chemical structures into numerical representations (descriptors) that encode structural and physicochemical information.
- Feature Selection: Identifying the most relevant and non-redundant molecular descriptors that significantly influence retention behavior.
- Model Building and Training: Using machine learning algorithms to establish a mathematical relationship between the selected descriptors and retention times.
- Model Validation: Rigorously assessing the model's predictive performance and reliability using internal and external validation sets.
- Prediction and Application: Deploying the validated model to predict the retention times of new compounds.
This workflow is depicted in the following diagram:
Molecular Descriptors in QSRR
Molecular descriptors are numerical values that characterize aspects of a molecule's structure and properties. The selection of appropriate descriptors is critical for building interpretable and robust QSRR models [27] [28].
Table 1: Common Categories of Molecular Descriptors in QSRR
| Descriptor Category | Description | Examples | Relevance to Retention |
|---|---|---|---|
| 1D Descriptors | Derived from molecular formula; simplest form. | Molecular weight, atom counts. | Provides basic structural information. |
| 2D Descriptors | Based on molecular topology (2D structure). | Topological indices, connectivity indices. | Encodes molecular branching and shape. |
| 3D Descriptors | Represent 3D geometry and conformation. | Molecular volume, surface area, steric parameters. | Crucial for modeling steric interactions and separating stereoisomers [29] [30]. |
| Physicochemical | Describe physical and chemical properties. | logP/logD (lipophilicity), pKa, hydrogen bonding capacity [27]. | Directly related to hydrophobic and polar interactions in reversed-phase LC [27] [32]. |
QSRR Application Protocols
This section provides detailed methodologies for developing and applying QSRR models, with a focus on environmental analysis.
Protocol 1: QSRR Model Development for Pesticide Screening
This protocol is adapted from a study predicting the retention of 823 pesticides in fruits and vegetables, utilizing the Monte Carlo technique with CORAL software [33].
- Objective: To develop a robust QSRR model for predicting the HPLC retention times (tR) of diverse pesticide residues.
- Software: CORAL-2023 software (available at http://www.insilico.eu/coral).
- Dataset:
- Source: 823 pesticide residues analyzed by UHPLC/ESI Q-Orbitrap MS [33].
- Preprocessing: Data is partitioned into four subsets: active training, passive training, calibration, and validation sets across five random splits.
- Descriptor Calculation:
- Use the Simplified Molecular Input Line Entry System (SMILES) notation of each pesticide to represent its structure.
- CORAL software computes a hybrid optimal descriptor combining SMILES attributes and hydrogen-suppressed graph (HSG) invariants.
- The descriptor of correlation weight (DCW) is calculated for each compound.
- Model Building and Optimization:
- Utilize the Monte Carlo optimization algorithm within CORAL.
- Apply the TF2 target function (which incorporates the Index of Ideality of Correlation (IIC) and Correlation Intensity Index (CII)) for optimization, as it has been shown to yield models with superior predictive quality [33].
- Run five independent iterations for robust statistical evaluation.
- Model Validation:
- Assess model performance using the external validation set.
- Key statistical metrics to report: Determination coefficient (R²), IIC, CII, Concordance Correlation Coefficient (CCC), and Q² [33].
- A successful model from this approach achieved R² = 0.842 and Q² = 0.835 on the external validation set [33].
Protocol 2: QSRR-Assisted Identification of Leachables from Food Packaging
This protocol leverages a multi-column QSRR approach to reduce false positives in non-targeted analysis of plastic food packaging leachables, a significant concern in environmental and food safety [31].
- Objective: To use QSRR models to filter out false-positive identifications during non-targeted LC-MS analysis of leachables from plastic food packaging materials.
- Chromatography:
- Columns: Use at least two chromatographic columns with different selectivity (e.g., C18, phenylhexyl, pentafluorophenyl (PFP), and cyano) [31].
- Instrument: LC-Q-TOF-MS (Liquid Chromatography-Quadrupole Time-of-Flight Mass Spectrometry).
- Standards: Analyze 178 pure chemical standards in both solvent and food packaging extract matrices to build the models.
- Descriptor Calculation and Feature Selection:
- Calculate a pool of 2D molecular descriptors using software such as AlvaDesc or Dragon.
- Use Random Forest (RF) or Support Vector Machine (SVM) for feature selection to identify descriptors with the highest importance for predicting retention time.
- Model Building:
- Construct a separate QSRR model for each chromatographic column.
- The study found that the non-linear Random Forest (RF) model demonstrated significantly better predictive capacity (average PVE of 0.89) compared to linear models [31].
- Application in Identification:
- For an unknown feature detected in a sample, obtain its proposed identity from MS/MS libraries and calculate its molecular descriptors.
- Input the descriptors into the QSRR models for all columns used.
- Compare the predicted retention times with the experimentally measured ones. A proposed identity is considered a false positive if its experimental retention time falls outside the 95% prediction band of the QSRR model for that column [31].
- Applying multiple QSRR models from different columns increases the capacity to filter false positives [31].
The logical process of this protocol is summarized below:
The Scientist's Toolkit: Essential Research Reagents and Materials
Table 2: Key Materials and Software for QSRR Experiments
| Item Name | Function/Description | Example Use Case |
|---|---|---|
| CORAL Software | Software utilizing Monte Carlo algorithm to build QSAR/QSRR models based on SMILES notation [33]. | Protocol 1: Prediction of pesticide retention times [33]. |
| AlvaDesc, Dragon, PaDEL-Descriptor | Software for calculating thousands of molecular descriptors from chemical structures [27] [28] [32]. | General: Generating input variables for QSRR models from a library of compounds. |
| Immobilized Artificial Membrane (IAM) Column | A biomimetic stationary phase that models cell membrane permeability and phospholipid affinity [32]. | Protocol 3: Characterizing the affinity of organophosphate pesticides to phospholipids [32]. |
| Human Serum Albumin (HSA) Column | A stationary phase with immobilized HSA to model plasma protein binding (PPB) [32]. | Protocol 3: Predicting the protein-binding potential of environmental contaminants [32]. |
| Genetic Algorithm (GA) | A nature-inspired optimization technique used for selecting the most relevant molecular descriptors from a large pool [34] [32]. | Protocol 3: Feature selection during the development of a QSRR model for organophosphates [32]. |
| Random Forest (RF) Algorithm | A machine learning algorithm based on ensemble decision trees, effective for building non-linear QSRR models [31] [27]. | Protocol 2: Building a highly predictive model for leachables with an average PVE of 0.89 [31]. |
Data Presentation and Model Validation
Robust validation is paramount to ensure the reliability and applicability of any QSRR model. Key validation parameters and their accepted criteria are summarized in the table below [33] [32].
Table 3: Key Statistical Metrics for QSRR Model Validation
| Metric | Description | Acceptance Criteria | Exemplary Values from Literature |
|---|---|---|---|
| R² | Coefficient of determination for the training set. | > 0.6 | 0.813 - 0.842 (External set) [33] |
| Q² (or Q²LOO) | Cross-validated R² (e.g., Leave-One-Out). | > 0.5 | 0.835 [33] |
| R²EXT | Coefficient of determination for the external test set. | > 0.5 | 0.696 - 0.898 [32] |
| RMSE | Root Mean Square Error. | As low as possible. | Reported in [31] [32] |
| CCC | Concordance Correlation Coefficient; measures agreement. | Close to 1. | 0.915 [33] |
Furthermore, defining the Applicability Domain (AD) is critical. The AD is the chemical space within which the model makes reliable predictions. Predictions for compounds structurally different from those in the training set are less reliable. The Williams plot is a common tool to visualize the AD, helping to identify outliers and structurally influential compounds [32].
Design of Experiments (DoE) and Multivariate Analysis for Systematic Exploration
The development of greener chromatographic methods represents a critical advancement in environmental analysis, aligning analytical practices with the principles of sustainability and environmental safety. Traditional chromatography methods, while reliable, often depend heavily on toxic organic solvents and energy-intensive procedures, posing significant ecological and health risks [6]. A systematic, knowledge-based approach is required to overcome these challenges without compromising analytical performance. The framework of Quality by Design (QbD) provides a structured foundation for this, emphasizing the need for thorough process understanding and control [35]. Within this framework, Design of Experiments (DoE) and Multivariate Analysis emerge as powerful, synergistic methodologies. They enable researchers to move beyond inefficient one-variable-at-a-time (OVAT) experimentation, instead facilitating a systematic exploration of the complex parameter interactions that define chromatographic separation. This approach is perfectly suited for optimizing new green methods utilizing techniques like Supercritical Fluid Chromatography (SFC) or Micellar Liquid Chromatography (MLC), with the ultimate goal of establishing a robust, sustainable, and effective analytical process [6].
The core limitation of traditional univariate approaches is the definition of a Proven Acceptable Range (PAR), which is established by changing a single parameter while holding all others constant. This method fails to account for synergistic or antagonistic effects between parameters [35]. In contrast, a multivariate strategy aims to define a Multivariate Acceptable Range (MAR)—a parameter space within which any combination of inputs yields the desired product quality and process performance [35]. For environmental analysis, this translates to a method that consistently meets accuracy, precision, and sensitivity criteria while minimizing environmental impact through reduced solvent consumption, energy use, and waste generation [6] [9].
Application Note: Protocol for DoE in Green Chromatography Method Development
This protocol outlines a systematic procedure for applying DoE to optimize a green chromatography method, using SFC as a primary example. SFC utilizes supercritical CO₂ as the primary mobile phase, drastically reducing the need for hazardous organic solvents [6] [9].
Phase 1: Pre-Experimental Planning and Risk Assessment
Objective: To define the scope of the study and identify critical process parameters (CPPs) and critical quality attributes (CQAs) through prior knowledge and risk assessment.
Procedure:
- Define the Analytical Problem: Clearly state the goal (e.g., "Optimize a SFC method for the separation of 10 priority pollutant phenols in water samples").
- Identify Critical Quality Attributes (CQAs): Determine the measurable outputs that define a successful method. These are typically:
- Chromatographic Resolution (Rs) of the critical pair.
- Analysis Time (tₘₐₓ).
- Peak Asymmetry Factor (As).
- Signal-to-Noise Ratio (S/N) for sensitivity.
- Environmental Impact Score (EIS): A calculated metric based on solvent consumption and waste generation [9].
- Identify Potential Process Parameters: Brainstorm all factors that can influence the CQAs.
- Perform a Risk Assessment: Use a Failure Mode and Effects Analysis (FMEA) to score and rank parameters based on their potential impact on CQAs and the probability of occurrence. This prioritizes factors for experimental investigation [35].
- Select Factors for DoE: Choose the parameters with the highest risk scores as the independent variables for your experimental design.
Table 1: Example Risk Assessment and Factor Selection for a SFC Method
| Process Parameter | Potential Impact on CQAs | Risk Score | Selected for DoE |
|---|---|---|---|
| Column Temperature | High impact on retention, selectivity | High | Yes |
| Back Pressure | Modulates solvent strength | High | Yes |
| Gradient Slope | Directly affects resolution and time | High | Yes |
| Co-solvent Type (e.g., MeOH vs. EtOH) | Affects greenness and selectivity | Medium | Yes (Categorical) |
| Flow Rate | Affects pressure, time, and solvent use | Medium | Yes |
| Detector Wavelength | Affects sensitivity only | Low | No |
Phase 2: Experimental Design and Execution
Objective: To select and execute an efficient experimental design that will generate sufficient data for building a predictive statistical model.
Procedure:
- Choose an Experimental Design:
- Screening Designs: For evaluating 5 or more factors, use a Resolution IV or Plackett-Burman (PB) design to identify the most influential factors. While Resolution V designs capture more information, they require more experimental runs [36].
- Optimization Designs: For the 3-4 most critical factors identified from screening, use a Response Surface Methodology (RSM) design such as a Central Composite Design (CCD) or Box-Behnken Design (BBD) to model curvature and find the optimum [35].
- Define Factor Levels: Set appropriate low, middle, and high levels for each continuous factor based on instrument constraints and preliminary experiments.
- Randomize Runs: Execute the experimental runs in a randomized order to minimize the effects of uncontrolled variables and bias.
- Record Responses: For each run, meticulously record all pre-defined CQAs (Rs, tₘₐₓ, As, etc.).
Table 2: Example of a Central Composite Design (CCD) Matrix and Responses
| Run Order | Temp. (°C) | Back Pressure (bar) | %Co-solvent | Resolution (Rs) | Analysis Time (min) | Env. Impact Score |
|---|---|---|---|---|---|---|
| 1 | 35 | 120 | 5 | 4.5 | 12.5 | 0.15 |
| 2 | 45 | 120 | 5 | 3.8 | 10.1 | 0.15 |
| 3 | 35 | 150 | 5 | 5.1 | 14.0 | 0.15 |
| 4 | 45 | 150 | 5 | 4.2 | 11.2 | 0.15 |
| ... | ... | ... | ... | ... | ... | ... |
| 15 | 40 | 135 | 10 | 2.5 | 8.5 | 0.30 |
Phase 3: In-silico Modeling and Multivariate Analysis
Objective: To build mathematical models that describe the relationship between process parameters and CQAs, and to identify the optimal operational region.
Procedure:
- Model Building: Use Multiple Linear Regression (MLR) or Partial Least Squares (PLS) Regression to fit the experimental data. The model will generate equations for each response (e.g., Rs = β₀ + β₁(Temp) + β₂(Pressure) + β₁₂(Temp*Pressure)...).
- Model Diagnostics: Check the statistical significance of the model (p-value, R², adjusted R²) and the individual model terms. Use analysis of variance (ANOVA) for this purpose.
- Generate Contour Plots: Visualize the relationship between two factors on a specific response while holding other factors constant. Overlaying contour plots for multiple CQAs (e.g., Rs and Analysis Time) is a powerful way to identify a region that satisfies all criteria simultaneously [35].
- Define the Multivariate Acceptable Range (MAR): Using the models and visualizations, define the multi-dimensional space where all CQAs meet their acceptance criteria. For instance, the MAR would be the combination of Temperature, Pressure, and %Co-solvent ranges that guarantees Rs > 2.0, Analysis Time < 15 min, and EIS < 0.25 [35].
- Monte Carlo Simulation (Optional): To further verify robustness, perform a Monte Carlo simulation within the defined MAR. This uses random sampling to predict the probability of future runs meeting all CQA specifications, accounting for normal process variability [35].
Workflow for DoE-based Green Method Development
The Scientist's Toolkit: Essential Reagents and Materials
The successful implementation of greener chromatographic methods relies on a specific set of reagents and materials designed to reduce environmental impact while maintaining high analytical performance [6] [9].
Table 3: Essential Research Reagent Solutions for Green Chromatography
| Item | Function/Description | Green Advantage |
|---|---|---|
| Supercritical CO₂ | Primary mobile phase in Supercritical Fluid Chromatography (SFC). | Non-toxic, non-flammable, and reusable. Drastically reduces organic solvent consumption [6] [9]. |
| Ethanol | Green organic co-solvent (modifier) for SFC or replacement for acetonitrile/MeOH in HPLC. | Biodegradable, less toxic, and often derived from renewable resources [9]. |
| Natural Deep Eutectic Solvents (NADES) | Solvents formed from natural primary metabolites for extraction and sample preparation. | Biodegradable, low toxicity, and sourced from renewable materials [6]. |
| Micellar Eluents | Aqueous surfactants used as mobile phases in Micellar Liquid Chromatography (MLC). | Minimize or eliminate the use of organic solvents [6]. |
| UHPLC Columns | Columns packed with sub-2µm particles. | Enable higher efficiency separations at lower flow rates, reducing solvent consumption and analysis time [9]. |
| Solid Phase Microextraction (SPME) | Solvent-free extraction and pre-concentration technique. | Eliminates the need for large volumes of organic solvents in sample preparation [6]. |
Advanced Protocol: Establishing a Multivariate Acceptable Range (MAR)
Objective: To provide a detailed, step-by-step protocol for calculating and validating a Multivariate Acceptable Range based on DoE data and in-silico modeling.
Principles: A MAR is the parameter space where any combination of input variables yields the desired product quality and process performance, unlike a univariate PAR [35].
Procedure:
- Input the Fitted Models: Load the statistical models for each CQA (e.g., Resolution, Analysis Time, Environmental Impact Score) into a computational environment (e.g., R, Python, or dedicated DoE software).
- Set Acceptance Criteria: Define the minimum and/or maximum acceptable values for each CQA.
- Resolution (Rs) ≥ 1.8
- Analysis Time ≤ 15 minutes
- Environmental Impact Score ≤ 0.25
- Define the Parameter Space: Set the boundaries for the exploration, typically the range of each parameter studied in the DoE.
- Perform a Grid Search: Algorithmically evaluate thousands of parameter combinations within the defined space. For each combination, use the models to predict all CQAs.
- Filter and Identify the MAR: Filter the results to retain only the parameter sets where all predicted CQAs simultaneously meet their acceptance criteria. The remaining combinations constitute the MAR.
- Visualize the MAR: Create an overlay plot (or a 3D model for three factors) to graphically represent the MAR. This plot is the direct, multi-dimensional analogy to a univariate PAR.
- Confirm the MAR Experimentally: Conduct 3-5 confirmation runs at different locations within the MAR (e.g., at the center, and near the edges). Compare the experimental results with the model predictions to validate the accuracy and robustness of the defined MAR [35].
MAR Establishment and Validation Workflow
The adoption of Green Analytical Chemistry (GAC) principles is increasingly critical for reducing the environmental footprint of chromatographic methods in environmental and pharmaceutical research [6]. Solvent selection is a major contributor to this footprint, with acetonitrile (ACN) being a particular concern due to its toxicity and environmental impact [37]. This application note details a systematic, in silico-assisted methodology for replacing ACN with greener methanol (MeOH) in reversed-phase liquid chromatography (RPLC), aligning with the broader thesis that computational modeling is a powerful enabler for sustainable environmental analysis.
Replacing ACN with MeOH enhances method greenness by addressing key environmental and safety issues. Methanol presents a lower ecological risk profile and is more readily biodegradable than acetonitrile [37]. From an operator safety perspective, MeOH is less toxic than ACN, which can form cyanide upon metabolism [37]. Furthermore, the Analytical Method Greenness Score (AMGS) provides a quantitative metric to validate this improvement; a demonstrated case shows that switching from ACN to MeOH reduced the AMGS from 7.79 to 5.09, confirming enhanced environmental sustainability [5] [38].
Key Differences Between Methanol and Acetonitrile
Successful replacement requires understanding their distinct physicochemical properties, which directly influence chromatographic performance. Elution strength is a primary difference; ACN is stronger than MeOH at the same ratio in water. For instance, a mobile phase of ACN/water 50/50 (v/v) has roughly equivalent eluting power to MeOH/water 60/40 (v/v) [39]. The table below summarizes critical differences that must be considered during method translation.
Table 1: Key Chromatographic Differences Between Methanol and Acetonitrile
| Property | Methanol | Acetonitrile | Impact on Method Development |
|---|---|---|---|
| Elution Strength | Lower | Higher | A higher percentage of MeOH is needed to achieve equivalent retention times [39]. |
| Column Backpressure | Higher | Lower | Higher viscosity of MeOH/water mixtures increases system pressure, requiring pressure resistance checks [39]. |
| UV Cut-Off | Higher (~205 nm) | Lower (~190 nm) | MeOH is less suitable for very low-wavelength UV detection; may increase baseline noise [39]. |
| Solvent Chemistry | Protic | Aprotic | Differing hydrogen-bonding capabilities can significantly alter selectivity and elution order [39]. |
| Buffer Compatibility | Better | Good | MeOH is less prone to causing buffer salt precipitation when mixed with water [39]. |
| Mixing with Water | Exothermic | Endothermic | MeOH/water mixing has a degassing effect, while ACN/water requires care to avoid bubble formation [39]. |
A crucial advantage of MeOH is its ability to modify separation selectivity. As a protic solvent, MeOH can engage in different intermolecular interactions with analytes and the stationary phase compared to the aprotic ACN. This can be exploited to resolve co-eluting peaks, as the elution order of compounds like phenol and benzoic acid can change depending on the organic solvent used [39].
In Silico Modeling for Greener Method Development
Traditional method development is labor-intensive and generates significant solvent waste. In silico modeling offers a rapid, accurate, and inherently greener alternative by using computer simulations to map the separation landscape [5] [38].
Software tools leverage pre-existing chromatographic data and physicochemical models to predict retention and resolution under various conditions (e.g., gradient time, temperature, mobile phase composition). This allows scientists to optimize methods virtually before any laboratory experimentation. A key innovation is the ability to map the Analytical Method Greenness Score (AMGS) across the entire predicted separation space. This enables simultaneous optimization for both chromatographic performance (e.g., resolution) and environmental impact, ensuring the final method is not only effective but also sustainable [38].
Table 2: Benefits of In Silico Modeling for Green Method Development
| Feature | Description | Green Benefit |
|---|---|---|
| Separation Modeling | Predicts retention and resolution for different gradient times, temperatures, and mobile phases [38]. | Drastically reduces the number of physical experiments needed, saving solvents, time, and energy [4]. |
| AMGS Mapping | Calculates and visualizes the greenness score across all possible method conditions [38]. | Allows for the direct selection of high-performance methods with the lowest environmental footprint [5]. |
| Solvent Replacement Simulation | Accurately models the chromatographic outcome of replacing ACN with MeOH, including selectivity changes [38]. | Facilitates a successful solvent switch without iterative, waste-generating lab trials. |
| Peak Tracking | Uses UV spectra and retention models to reliably identify peaks across different method conditions [4]. | Ensures method robustness during solvent replacement, preventing misidentification. |
The workflow for an in silico-assisted solvent replacement project is visualized below.
Case Study: Protocol for Methanol Replacement
This protocol outlines the steps for translating an existing RPLC-UV method from an ACN-based to a MeOH-based mobile phase, using a combination of in silico modeling and laboratory validation for the analysis of common pesticides in water samples [40].
The Scientist's Toolkit: Research Reagent Solutions
Table 3: Essential Materials and Reagents
| Item | Function | Example/Note |
|---|---|---|
| HPLC/UHPLC System | Liquid chromatograph with binary pump, autosampler, and column oven. | Must be compatible with higher backpressures from MeOH. |
| MS-Compatible Detector | Diode Array Detector (DAD) or Mass Spectrometer (MS). | DAD is used for peak tracking via spectral confirmation [40]. |
| C18 Reversed-Phase Column | Stationary phase for separation. | e.g., 100 mm x 3.0 mm, 3.0 μm particles [38]. |
| Methanol (HPLC/MS Grade) | Green organic modifier for mobile phase. | Lower toxicity, preferred replacement for ACN [37]. |
| Water (HPLC/MS Grade) | Aqueous component of mobile phase. | |
| Formic Acid (MS Grade) | Mobile phase additive to improve ionization in MS. | A greener alternative to trifluoroacetic acid (TFA) [41]. |
| Analyte Standards | For system suitability testing and peak tracking. | e.g., Pesticide mix (carbaryl, diuron, etc.) [40]. |
| In Silico Modeling Software | Predicts chromatographic behavior for method translation. | e.g., ACD/Labs LC Simulator, DryLab [4]. |
Experimental Protocol
Step 1: In Silico Model Setup and Initial Conversion
- Gather Data: Input the parameters of the original ACN method (column dimensions, particle size, gradient profile, temperature, and flow rate) into the modeling software.
- Establish Baseline: Simulate the original ACN method chromatogram to validate the model's accuracy against known experimental data.
- Solvent Replacement: Replace ACN with MeOH in the software's mobile phase definition.
- Apply Elution Strength Correction: Use a nomogram or the software's internal functions to adjust the initial MeOH percentage. A starting point is to increase the MeOH concentration by 10-15% absolute versus ACN (e.g., for an ACN gradient of 20-80% B, try a MeOH gradient of 30-90% B) [39].
- Initial Simulation: Run a simulation with the corrected MeOH gradient. The software will predict a new chromatogram, highlighting potential co-elutions and changes in elution order.
Step 2: In Silico Optimization
- Optimize Gradient and Temperature: Use the software's optimization features to create a resolution map by varying gradient time and temperature. The goal is to find a condition where the critical resolution (resolution between the two closest peaks) is ≥ 1.5.
- Assess Greenness: Review the AMGS calculated by the model for the optimized MeOH method. The score should be lower than the original ACN method [38].
- Finalize Virtual Method: Select the optimal conditions that provide sufficient resolution and a lower AMGS. The software will output a detailed method (gradient table, flow rate, temperature).
Step 3: Laboratory Validation
- System Preparation: Equilibrate the HPLC system with the new MeOH-based mobile phase. Use the predicted starting percentage of MeOH for the initial isocratic hold.
- Pressure Check: Monitor system pressure. Expect a 1.5- to 2-fold increase compared to the ACN method due to MeOH's higher viscosity [39]. Ensure pressure remains within instrument and column limits.
- Analyte Analysis: Inject the standard mixture and run the predicted gradient method.
- Peak Tracking and Identification: Use DAD to collect UV spectra for each peak. Compare the spectra and relative elution order with those from the original ACN method to confirm peak identities [40].
- Performance Verification: Measure the retention time stability, peak symmetry, and resolution of the critical pair. Compare these results with the in-silico predictions.
Step 4: Addressing Adsorption and Matrix Effects (for LC-MS/MS)
When analyzing aqueous environmental samples (e.g., filtered water) by LC-MS/MS, adding MeOH not only enables the green mobile phase but also improves data quality. Late-eluting hydrophobic analytes can adsorb to surfaces in the vial and LC flow path, causing poor linearity and signal loss [40].
- Diagnose Adsorption: Compare the signal intensity of a pure aqueous standard with a standard in a water/MeOH mixture. A significantly lower signal in the aqueous sample indicates adsorption.
- Optimize MeOH Addition: Prepare calibration standards in water with increasing amounts of MeOH (e.g., 0%, 10%, 20%, 30% v/v). The signal intensity for late-eluting analytes will increase with MeOH percentage until an optimum is reached, after which dilution lowers the signal.
- Implement Modified Method: Use the determined optimal MeOH percentage (e.g., 20%) in all samples and calibration standards to simultaneously eliminate adsorption losses and reduce matrix effects in the MS ion source [40].
The logical decision process for this specific application is summarized below.
Results and Discussion
The successful implementation of this protocol yields multiple benefits. The primary outcome is a reduction in environmental impact, quantified by a lower AMGS [38]. Furthermore, the use of MeOH can enhance operational safety and reduce costs due to its lower toxicity and price compared to ACN.
The case study also demonstrates that a minor loss in efficiency can be offset by the green advantages and additional benefits. For instance, while the efficiency for a mixture of cephem antibiotics was lower with MeOH compared to ACN under the same conditions, the selectivity and elution order changed, which can be exploited to resolve different analytes [39]. More importantly, the addition of MeOH to aqueous samples in LC-MS/MS analysis was shown to effectively reduce analyte adsorption and matrix effects, leading to improved signal intensity, linearity, and precision for late-eluting pesticides [40].
Table 4: Quantitative Comparison of Original and Greener Method
| Parameter | Original ACN Method | Greener MeOH Method | Impact |
|---|---|---|---|
| Analytical Method Greenness Score (AMGS) | 7.79 [38] | 5.09 [38] | >30% reduction in environmental impact score. |
| Critical Resolution | e.g., 2.0 (Baseline) | e.g., 1.8 (Optimized) | Maintains required separation performance. |
| Organic Solvent Waste per Run | ~15 mL (Est.) | ~15 mL (Est.) | Volume may be similar, but toxicity and environmental burden are lower [37]. |
| Column Backpressure | e.g., 120 Bar | e.g., 200 Bar | Stays within system limits but requires verification [39]. |
| Signal Intensity for Late-Eluters | Low (in pure water) | High (with 20% MeOH) [40] | Eliminates adsorption, improves quantitative accuracy in LC-MS. |
This application note demonstrates that replacing acetonitrile with methanol is a viable and impactful strategy for greening chromatographic methods. The process is not a simple solvent swap but a method re-development that requires careful consideration of elution strength, selectivity, and system pressure. The integration of in silico modeling is pivotal to this transition, as it drastically reduces the time, cost, and solvent waste associated with experimental trial-and-error. By providing a predictive framework for optimizing both performance and greenness, computational tools empower scientists in environmental and pharmaceutical research to adopt more sustainable practices without compromising analytical quality.
Fluorinated mobile phase additives, such as hexafluoroisopropanol (HFIP), have become a cornerstone in the liquid chromatography-mass spectrometry (LC-MS) analysis of challenging analytes, particularly oligonucleotides, due to their exceptional ability to facilitate reversed-phase retention and enhance electrospray ionization (ESI) signal intensity in negative ion mode [42]. Despite their widespread use and technical effectiveness, a pressing need exists to phase out these substances. Their significant environmental and safety concerns, including potential toxicity and environmental persistence, coupled with heightened regulatory scrutiny, drive this initiative [5] [9].
This application note details a successful strategy for replacing a fluorinated mobile phase additive with a more sustainable chlorinated alternative, 1,1,1,3,3,3-hexafluoro-2-methyl-2-propanol (HFMIP), for the analysis of oligonucleotides. The transition was enabled and optimized through in silico modeling, a computer-assisted method development approach that aligns with the principles of green chemistry by minimizing the need for laborious, resource-intensive trial-and-error experimentation [5] [4]. This case study demonstrates that it is possible to simultaneously enhance analytical performance and improve the environmental profile of a chromatographic method.
Experimental Protocols
In Silico Method Development and Optimization
Principle: Computer-assisted method development uses sophisticated algorithms and predictive modeling to simulate chromatographic separations, drastically reducing the number of physical experiments required [4]. This approach was used to map the separation landscape and identify optimal conditions for the new mobile phase.
Procedure:
- Define Success Criteria: Establish critical method attributes, including critical resolution (Rs > 1.5), total run time, and a greenness score target.
- Input Parameters: Into the modeling software, input the structures of the target oligonucleotide analytes and the properties of the proposed ion-pairing reagents and mobile phase modifiers (e.g., HFIP, HFMIP, various amines).
- Generate Resolution Map: The software simulates chromatographic performance across a wide range of conditions, such as modifier concentration, gradient profile, and pH.
- Identify Optimal Conditions: The model pinpoints the specific combination of N,N-dimethylcyclohexylamine (DMCHA) as the ion-pairing agent and HFMIP as the modifier that achieves the target resolution while offering a greener profile.
- Validate Model Prediction: The in silico predictions are confirmed through a minimal set of physical experiments to verify accuracy [5] [4].
Instrumental and Analytical Conditions for Oligonucleotide Separation
This protocol outlines the specific conditions used to validate the in silico model and perform the LC-MS analysis after the phasing out of HFIP.
Materials:
- Oligonucleotides: A mixture of a 33-mer phosphorothioate and its 5'(n-1) truncation, both fully modified with 2'-O-methyl groups (50 µg/mL each in nuclease-free water) [42].
- Mobile Phase A: 15 mM N,N-Dimethylcyclohexylamine (DMCHA) and 25 mM 1,1,1,3,3,3-hexafluoro-2-methyl-2-propanol (HFMIP) in a 90:10 water/methanol mixture.
- Mobile Phase B: 90% methanol in water.
- LC System: Ultra-high-performance liquid chromatography (UHPLC) system.
- Column: Waters Acquity UPLC OST C18 column (1.7 µm, 2.1 × 50 mm).
- Mass Spectrometer: Quadrupole time-of-flight hybrid mass spectrometer with an electrospray ionization (ESI) source operated in negative ion mode [42].
Chromatographic Procedure:
- Column Temperature: Maintain at 60°C.
- Flow Rate: 1.0 mL/min.
- Injection Volume: 15 µL.
- Gradient Program:
- Initial: 12% Mobile Phase B.
- Ramp to 17% Mobile Phase B over 6 minutes.
- MS Detection:
- Capillary Voltage: -2.0 kV
- Cone Voltage: 25 V
- Source Temperature: 125°C
- Desolvation Temperature: 450°C
- Desolvation Gas (N₂): 1000 L/h [42].
Results and Discussion
Performance and Environmental Impact
The transition from the HFIP-based system to the HFMIP/DMCHA system was evaluated on both analytical performance and environmental impact, with the results summarized in the table below.
Table 1: Comparative Analysis of Fluorinated and Alternative Mobile Phase Systems
| Characteristic | Traditional Fluorinated System | Alternative HFMIP-based System | Implication of Change |
|---|---|---|---|
| Mobile Phase Additive | Hexafluoroisopropanol (HFIP) | 1,1,1,3,3,3-hexafluoro-2-methyl-2-propanol (HFMIP) | Phasing out the predominant fluorinated solvent. |
| Ion-Pairing Reagent | Less hydrophobic amines (e.g., Triethylamine) | N,N-Dimethylcyclohexylamine (DMCHA) | Hydrophobicity matching with HFMIP improves performance [42]. |
| Critical Pair Resolution | Fully co-eluted (Resolution = 0) [5] | Baseline separated (Resolution = 1.40) [5] | Major improvement in separation effectiveness and data quality. |
| Analytical Method Greenness Score (AMGS) | 9.46 [5] | 4.49 [5] | Significant reduction in the overall environmental impact of the method. |
| MS Signal Performance | Standard for oligonucleotides [42] | Can outperform HFIP with matched ion-pairing agents [42] | Maintains or enhances detection sensitivity. |
The data conclusively shows that the phased-out method is not a compromise but a substantial improvement. The in silico-guided selection of the DMCHA/HFMIP combination was critical to this success, as the performance of fluorinated alcohols is highly dependent on the ion-pairing agent used [42]. This synergy enabled a method that is simultaneously more selective, more resolvable, and greener.
The Scientist's Toolkit: Essential Reagents for Oligonucleotide LC-MS
The following table lists key reagents and materials essential for developing and running modern, greener LC-MS methods for oligonucleotides.
Table 2: Key Research Reagent Solutions for Oligonucleotide LC-MS
| Reagent/Material | Function/Explanation |
|---|---|
| Ion-Pairing Reagents (e.g., DMCHA) | Alkylamine agents that pair with the negatively charged oligonucleotide backbone, enabling retention on reversed-phase C18 columns [42]. |
| Acidic Modifiers (e.g., HFIP, HFMIP) | Volatile acids that protonate the ion-pairing reagent, control pH, and enhance MS signal intensity in negative ion ESI by creating a stable deprotonated anion pool [42]. |
| UHPLC C18 Column | Columns with small particle sizes (<2 µm) that provide high separation efficiency, allowing for lower solvent consumption and faster run times, aligning with green chemistry principles [9]. |
| In Silico Modeling Software | Predictive software tools that use algorithms to simulate separations, optimizing mobile phase composition and gradient conditions with minimal physical experiments, thereby reducing solvent waste [5] [4]. |
| Mass Spectrometer (Q-TOF) | A high-resolution mass analyzer capable of accurate mass measurements, essential for confirming the identity of oligonucleotides and their impurities. |
Workflow for Phasing Out Fluorinated Additives
The following diagram illustrates the logical workflow for successfully replacing a fluorinated mobile phase additive, integrating in silico modeling and experimental validation.
Diagram 1: Workflow for phasing out fluorinated additives using in silico modeling.
This case study provides a validated protocol for phasing out environmentally concerning fluorinated mobile phase additives without sacrificing—and in this case, enhancing—analytical performance. The key to success lies in leveraging in silico modeling to intelligently navigate the complex interplay between ion-pairing reagents and alternative modifiers. This approach aligns with the principles of green chemistry by reducing the environmental impact of analytical methods, as quantified by the Analytical Method Greenness Score (AMGS), while also saving significant time and resources in method development. The strategy outlined here serves as a template for researchers in drug development and environmental analysis seeking to make their chromatographic practices more sustainable.
Achieving Peak Performance: Strategies for Robust and Sustainable Methods
Optimizing Critical Pairs Resolution Across the Separation Landscape
The resolution of critical pairs represents a fundamental challenge in the separation sciences, particularly when developing methods for complex mixtures such as those encountered in pharmaceutical and environmental analysis. Traditional method development relies heavily on trial-and-error experimentation, which is both time-consuming and environmentally costly due to significant solvent and reagent consumption [16]. The integration of in silico modeling presents a paradigm shift, enabling researchers to accelerate method development while simultaneously enhancing environmental sustainability [5].
This protocol details the application of computer-assisted modeling to optimize critical pair resolution within a framework of Green Analytical Chemistry (GAC). By employing predictive models and multi-objective optimization, researchers can navigate the separation landscape virtually, identifying conditions that maximize resolution while minimizing ecological impact before conducting physical experiments [16] [5].
Theoretical Background
The Challenge of Critical Pairs in Complex Mixtures
Critical pairs are compound pairs with very similar chromatographic properties that are difficult to resolve. In complex mixtures, the presence of multiple critical pairs can significantly extend method development time. The resolution (R_s) between two adjacent peaks is calculated as:
R_s = 2(t_R2 - t_R1) / (w_b1 + w_b2)
where tR is retention time and wb is peak width at baseline. For critical pairs, this value approaches 1.0 or less, indicating incomplete separation [16].
Green Analytical Chemistry in Separation Science
GAC principles aim to minimize the environmental impact of analytical methods by reducing hazardous solvent use, energy consumption, and waste generation [43]. Chromatographic techniques are particularly targeted for greening efforts as they typically involve large volumes of organic solvents. The Analytical Method Greenness Score (AMGS) provides a quantitative measure of a method's environmental impact, with lower scores indicating greener methods [5].
Computational Framework and Tools
In Silico Modeling Approaches
Table 1: In Silico Modeling Techniques for Separation Optimization
| Model Type | Key Features | Application in Critical Pairs | Reference |
|---|---|---|---|
| Shortcut Model (RPLC×RPLC) | Uses Hydrophobic Subtraction Model (HSM) for retention prediction; considers sample volume, undersampling, pressure limitations | Optimal column pairing and operating conditions identification in minutes | [16] |
| Digital Twin Models | Three-compartment ordinary differential equation models; links preclinical and clinical data | Prediction of retention and peak width under various conditions | [44] |
| Separation Landscape Mapping | Maps AMGS across entire separation parameter space | Simultaneous optimization of performance and greenness | [5] |
Greenness Assessment Metrics
Table 2: Greenness Assessment Tools for Analytical Methods
| Assessment Tool | Type | Scoring System | Key Parameters Assessed | |
|---|---|---|---|---|
| NEMI | Basic pictogram | Binary (pass/fail on 4 criteria) | Toxicity, waste, corrosiveness, hazardousness | [43] |
| Analytical Eco-Scale | Penalty point system | Score out of 100 (higher = greener) | Reagent toxicity, energy consumption, waste | [43] |
| GAPI | Comprehensive pictogram | Color-coded (5-level) assessment | Entire analytical process from sampling to detection | [43] |
| AGREE | Circular pictogram | 0-1 score based on 12 GAC principles | Comprehensive GAC principles coverage | [43] |
| AMGS | Quantitative metric | Numerical score (lower = greener) | Solvent consumption, energy, waste generation | [5] |
Experimental Protocols
Protocol 1: Column Screening and Selection Using Kendall's Correlation
Purpose: To identify the optimal column pair for resolving critical pairs in comprehensive two-dimensional liquid chromatography (RPLC×RPLC).
Materials:
- Shortcut model software for RPLC×RPLC [16]
- Database of available reversed-phase columns
- Compound mixture data (logP, molecular volume, etc.)
Procedure:
- Input compound properties for all analytes in the mixture
- Calculate Kendall's correlation coefficient for all possible column combinations
- Select column pair with the lowest correlation coefficient to maximize orthogonality
- Verify prediction with a limited set of physical experiments
Computational Parameters:
- Flow rate range: 0.1-2.0 mL/min
- Temperature range: 25-60°C
- Gradient time: 10-120 min
- Pressure limit: 400 bar
Protocol 2: Multi-Objective Stochastic Optimization of Separation Conditions
Purpose: To simultaneously optimize critical pair resolution and method greenness using computational approaches.
Materials:
- Multi-objective optimization algorithm
- Greenness assessment software (AGREE, GAPI, or AMGS calculator)
- Chromatographic modeling software
Procedure:
- Define optimization objectives:
- Primary: Maximize resolution of critical pairs (R_s > 1.5)
- Secondary: Minimize AMGS or maximize AGREE score
- Constraints: Pressure limits, analysis time
Set design variables:
- Flow rate (both dimensions)
- Gradient profile
- Temperature
- Mobile phase composition
- pH
Run stochastic optimization (e.g., genetic algorithm, particle swarm)
- Identify Pareto-optimal solutions balancing resolution and greenness
- Validate optimal conditions with physical experiments
Protocol 3: Solvent Replacement for Greener Methods
Purpose: To replace hazardous solvents with environmentally friendly alternatives while maintaining critical pair resolution.
Materials:
- In silico retention modeling software
- Database of solvent properties
- Greenness assessment tools
Procedure:
- Establish baseline method with current solvents (e.g., acetonitrile-based)
- Model alternative mobile phases:
- Methanol-water mixtures
- Ethanol-water mixtures
- Supercritical CO_2 (for SFC applications)
- Aqueous surfactants (Micellar Liquid Chromatography)
- Predict resolution changes for all critical pairs
- Calculate greenness metrics for alternative methods
- Select optimal replacement that maintains resolution while improving greenness
- Experimental verification of the optimized method
Workflow Visualization
Case Studies and Applications
Case Study 1: Replacement of Fluorinated Mobile Phase Additives
Background: A method utilizing fluorinated additives (AMGS: 9.46) showed overlapping critical pairs.
In Silico Approach:
- Modeled transition to chlorinated additive alternative
- Predicted retention changes for all compounds
- Identified modified gradient profile to maintain separations
Results:
- Critical pair resolution improved from fully overlapped to R_s = 1.40
- AMGS reduced from 9.46 to 4.49 (52.5% improvement)
- Maintained analysis time and pressure within limits [5]
Case Study 2: Acetonitrile to Methanol Replacement
Background: Traditional acetonitrile-based method (AMGS: 7.79) required greening.
In Silico Approach:
- Modeled methanol-water gradient as replacement
- Adjusted temperature and gradient profile to compensate for strength differences
- Predicted resolution for all critical pairs
Results:
- All critical pairs maintained resolution >1.5
- AMGS reduced from 7.79 to 5.09 (34.7% improvement)
- Cost reduction due to methanol's lower price [5]
Research Reagent Solutions
Table 3: Essential Materials for In Silico Chromatographic Optimization
| Category | Specific Items | Function/Purpose | Green Considerations | |
|---|---|---|---|---|
| Software Tools | ChromSword, ACD/Labs, DryLab | Retention modeling and separation optimization | Reduces experimental solvent waste by >80% | [16] |
| Green Solvents | Methanol, Ethanol, Water, CO_2 | Mobile phase components | Reduced toxicity and environmental impact | [5] |
| Column Database | Various RPLC columns with different selectivities | Column pairing for orthogonal separations | Enables virtual screening without physical columns | [16] |
| Assessment Tools | AGREE, GAPI, AMGS calculators | Quantitative greenness evaluation | Ensures methods align with sustainability goals | [43] |
Troubleshooting and Technical Notes
Common Computational Challenges
- Parameter Uncertainty: Address by incorporating error margins in predictions and validating with limited experiments
- Model Transferability: Ensure models are calibrated for specific instrument configurations
- Peak Shape Prediction: Use the hydrophobic subtraction model (HSM) for more accurate retention and peak width predictions in RPLC [16]
Method Transfer Considerations
- Column Batch Variations: Account for minor selectivity differences between column batches
- Dwell Volume Effects: Model gradient delay when transferring between systems
- Pressure Limitations: Include maximum pressure as constraint in optimization algorithms
The integration of in silico modeling with green chemistry principles provides a powerful framework for optimizing critical pair resolution across the separation landscape. The protocols outlined herein enable researchers to:
- Reduce method development time from weeks to days
- Decrease solvent consumption and waste generation by over 50%
- Systematically navigate the compromise between separation performance and environmental impact
- Replace hazardous solvents while maintaining resolution of critical pairs
As computational power and model accuracy continue to improve, in silico method development is poised to become the standard approach for creating sustainable, robust chromatographic methods in pharmaceutical and environmental analysis.
Capitalizing on Peak Crossover for Enhanced Preparative Purification
Within the framework of developing greener chromatographic methods for environmental analysis, preparative purification represents a significant opportunity for reducing environmental impact. This process, essential for isolating pure compounds from complex mixtures, traditionally consumes substantial volumes of solvents and energy. The adoption of in silico modeling is pivotal for designing more sustainable processes that minimize waste and resource consumption [3].
A key strategy for enhancing the efficiency of these purifications is capitalizing on peak crossover. This phenomenon, which occurs when the elution order of two compounds reverses as a function of a changing chromatographic condition (such as gradient time, temperature, or mobile phase pH), can be strategically used to maximize the loading of a target compound without sacrificing purity [5]. By leveraging in silico models to map the separation landscape, scientists can precisely identify these crossover points, moving away from traditional, wasteful trial-and-error experimentation towards a predictive, greener methodology [5] [3].
Key Concepts and Terminology
- Peak Crossover: The reversal in the elution order of two or more compounds resulting from a change in chromatographic conditions. This is visually identified by a point in a resolution map where two peaks merge into one before separating again, but in reversed order.
- Resolution Map: A contour plot, generated through in silico modeling, that visualizes the resolution between a critical pair of analytes across a two-dimensional space of method parameters (e.g., gradient time vs. temperature) [5].
- Loading Capacity: The maximum amount of a sample that can be injected onto a chromatographic column while maintaining baseline separation and acceptable peak shape.
- Active Pharmaceutical Ingredient (API): The biologically active component in a pharmaceutical drug.
- Analytical Method Greenness Score (AMGS): A metric used to evaluate the environmental impact of an analytical method, with a lower score indicating a greener method [5].
Experimental Protocols
Protocol 1: In Silico Modeling for Resolution Map Generation
Purpose: To computationally simulate and map the resolution of a critical pair of compounds across a range of chromatographic conditions to identify optimal regions for separation and potential peak crossover points [5].
Methodology:
- System Selection: Choose a suitable in silico modeling software (e.g., AutoChrom or analogous platforms) capable of performing multi-parameter simulations [3] [4].
- Parameter Definition:
- Define the independent variables to be modeled (e.g., gradient time and column temperature).
- Set realistic ranges for these variables based on preliminary experiments or literature data.
- Define the dependent variable as the resolution (Rs) between the target API and its closest-eluting impurity.
- Data Input: Input the physicochemical properties (e.g., logP, pKa) of the target compounds, either from databases or predicted using QSPR tools within the software [4].
- Simulation Execution: Run the simulation to model the chromatographic behavior across the entire defined parameter space. The software will calculate the resolution for thousands of theoretical method conditions.
- Map Generation: Instruct the software to generate a 2D contour plot (resolution map) where the x- and y-axes represent the two method parameters, and the color contours represent the resolution value.
Protocol 2: Experimental Validation of Peak Crossover
Purpose: To empirically verify the peak crossover region predicted by the in silico model and determine the maximum achievable load at that point.
Methodology:
- Condition Selection: From the generated resolution map, select a set of method conditions within the predicted peak crossover zone where resolution is minimal.
- Method Setup:
- Column: Select a column with identical phase and dimensions to those used in the in silico model.
- Mobile Phase: Prepare the mobile phase as defined by the model.
- Instrument: Use a standard HPLC or UHPLC system.
- Loading Study:
- Prepare a concentrated solution of the target API.
- Inject the sample at the selected crossover conditions, starting with a low injection volume/mass.
- Gradually increase the injection load in subsequent runs while monitoring the chromatogram for the target peak's shape and its separation from impurities.
- Data Analysis:
- Record the chromatogram and resolution for each injection.
- Identify the point at which the peak of interest begins to co-elute with an impurity or shows significant fronting or tailing. The load just before this point is the maximum practical loading capacity.
Data Presentation and Analysis
The following table quantifies the performance gains achieved by applying an in silico-guided peak crossover strategy, compared to a conventional method development approach.
Table 1: Quantitative Comparison of Conventional vs. In Silico-Guided Preparative Purification
| Parameter | Conventional Method | In Silico-Guided Method (Peak Crossover) | Improvement |
|---|---|---|---|
| API Loading Capacity | Baseline (1x) | 2.5× higher [5] | 150% increase |
| Purification Replicates Required | Baseline (1x) | 2.5× fewer [5] | 60% reduction |
| Analytical Method Greenness Score (AMGS) | 7.79 (using Acetonitrile) [5] | 5.09 (using Methanol) [5] | 35% reduction |
| Critical Pair Resolution | Fully overlapped [5] | 1.40 [5] | Baseline separation achieved |
Key Insights:
- Leveraging the peak crossover region allowed for a 2.5× increase in API loading, directly leading to a 60% reduction in the number of purification runs required to process the same amount of material [5]. This translates to substantial savings in solvent, time, and energy.
- The in silico approach facilitated the replacement of acetonitrile with the greener alternative methanol, improving the method's environmental profile as measured by the AMGS [5].
- A critical pair of compounds that was previously inseparable was resolved to a baseline resolution of 1.40, demonstrating that this strategy does not compromise—and can even enhance—separation performance [5].
The Scientist's Toolkit
Table 2: Essential Research Reagent Solutions for In Silico-Guided Purification
| Item | Function/Application |
|---|---|
| In Silico Modeling Software | Platforms like AutoChrom are used to simulate chromatographic separations, optimize method parameters in silico, and generate resolution maps to identify peak crossover points, drastically reducing physical experimentation [3] [4]. |
| PhysChem Prediction Software | Tools that calculate physicochemical properties (e.g., logP, logD, pKa) using QSPR models. These predicted properties provide crucial input data for accurate in silico simulations [4]. |
| UHPLC Instrumentation | Energy-efficient instruments that operate at higher pressures, enabling faster separations with reduced solvent consumption and shorter run times, aligning with green chemistry principles [3] [4]. |
| Greener Solvents | Solvents such as methanol, ethanol, or supercritical fluids that are chosen to replace more hazardous solvents (e.g., acetonitrile) based on guides like the ACS GCI-PR, thereby reducing the environmental impact of the method [5] [3]. |
| Centralized Data Management System | A vendor-neutral platform (e.g., the Spectrus platform) that standardizes and stores analytical data and methods. This preserves knowledge, prevents experiment duplication, and creates high-quality datasets ready for AI/ML analysis [3] [4]. |
Workflow and Pathway Visualization
The following diagram illustrates the logical workflow for implementing a peak crossover strategy, from initial compound analysis to the final, optimized preparative method.
In Silico-Guided Workflow for Preparative Purification
Digital Shadows and Inverse Modeling for Root Cause Analysis of Deviations
The pursuit of greener analytical methods in chromatography is a significant focus in modern environmental and pharmaceutical research. The integration of in silico modeling presents a powerful strategy to reduce the environmental footprint of analytical labs, which has traditionally been dominated by solvent-intensive separation techniques. A cornerstone of this approach is the implementation of a digital shadow—a dynamic, data-driven computational model that mirrors a physical chromatographic process. When combined with inverse modeling techniques, this digital representation becomes a potent tool for diagnosing and correcting process deviations, thereby enhancing method robustness and minimizing resource consumption. The adoption of these technologies aligns directly with the principles of Green Chemistry, notably waste prevention and reduced energy requirements, by transitioning from traditional, resource-intensive trial-and-error experimentation to targeted, computer-assisted development and troubleshooting [5] [3]. This document outlines detailed application notes and protocols for applying digital shadows and inverse modeling to root cause analysis (RCA) of deviations in chromatographic processes, framed within a thesis focused on developing greener chromatographic methods for environmental analysis.
Key Concepts and Quantitative Benefits
Core Definitions
- Digital Shadow: A mechanistic, data-driven model of a chromatographic process or value stream that is systematically updated with operational data. It provides a dynamic digital representation used for analysis, simulation, and decision-support without direct, automated control of the physical system [17] [45].
- Inverse Modeling: A computational technique used to ascertain the underlying causes of observed process deviations. It involves systematically altering input parameters within the digital shadow to align the model's output with real-world, atypical unit operation performance, thereby identifying the most probable root cause factors [17].
- Root Cause Analysis (RCA): A systematic process for identifying the fundamental, initial causes of a process deviation or quality defect, enabling the implementation of effective corrective and preventive actions (CAPAs) [17] [46].
Quantitative Advantages of a Model-Assisted Approach
The implementation of a digital shadow for process development and RCA yields significant, measurable benefits over conventional, purely experimental approaches. The table below summarizes key quantitative advantages.
Table 1: Quantitative Benefits of a Digital Shadow-Assisted Approach
| Metric | Traditional Approach | Digital Shadow-Assisted Approach | Primary Source |
|---|---|---|---|
| Experiment Reduction in Process Characterization | Baseline (100%) | 40% - 80% reduction in upstream experiments | [17] |
| Analytical Method Greenness Score (AMGS) | Higher impact (e.g., 7.79 with ACN) | Lower impact (e.g., 5.09 with MeOH) | [5] |
| Solvent Replacement | Use of fluorinated solvents (AMGS: 9.46) | Use of chlorinated additives (AMGS: 4.49) | [5] |
| RCA Investigation Time | Time-consuming laboratory investigation | Reduced to milliseconds after model construction | [47] |
| Preparative Purification Efficiency | Baseline loading | 2.5× increased loading, reducing replicates | [5] |
These metrics underscore the triple benefit of this approach: enhanced operational efficiency, improved environmental sustainability, and strengthened process understanding [17] [5].
The Researcher's Toolkit: Essential Reagents and Solutions
The experimental and computational work described in these protocols requires both physical materials and specialized software tools.
Table 2: Essential Research Reagents and Computational Tools
| Item Name | Type | Function/Description |
|---|---|---|
| Mechanistic Model Parameters | Computational | Thermodynamic parameters (e.g., adsorption isotherms) that are scale-invariant and form the core of the chromatography model [17]. |
| Platform Mobile Phases | Chemical | A selection of 'greener' solvent alternatives (e.g., Methanol, water, supercritical CO2) for method translation and optimization [5] [3]. |
| Historical Process Data | Data | Datasets of normal and abnormal process runs, including HPLC-MS fingerprints, used for model calibration and fault diagnosis [47] [46]. |
| In Silico Modeling Software | Software | Tools (e.g., ACD/Labs' AutoChrom) that use 1D, 2D, or 3D models to optimize chromatographic parameters digitally, reducing wet-lab experiments [3]. |
| Multivariate Statistical Analysis Package | Software | Software capable of building statistical models (e.g., Partial Least Squares - PLS) for fault detection and diagnosis from fingerprint data [46]. |
Application Notes
Note 1: Rapid Development of Greener Methods
Objective: To swiftly develop a chromatographic method that maintains performance while improving its environmental profile, as measured by the Analytical Method Greenness Score (AMGS) [5].
Background: Traditional method development is iterative and solvent-intensive. A digital shadow allows for the in-silico mapping of the entire separation landscape, enabling the simultaneous evaluation of method performance (e.g., critical resolution, Rs) and greenness.
Protocol:
- Define Method Requirements: Establish critical pair resolution (
Rs > 1.5), analysis time, and detection sensitivity requirements. - Input Initial Parameters: Into the digital shadow, input a wide range of possible method conditions, including different mobile phase compositions (e.g., acetonitrile vs. methanol), pH, and gradient profiles.
- In-Silico DOE Execution: Run a high-throughput in-silico Design of Experiments (DOE) to simulate chromatographic outcomes across the defined parameter space.
- Generate Resolution and AMGS Maps: The software produces two key maps: a critical resolution map and an AMGS map across the same separation landscape.
- Select Optimal Conditions: Identify method conditions that meet the performance criteria (e.g.,
Rs ≥ 1.5) while simultaneously minimizing the AMGS. For instance, this may reveal that a switch from acetonitrile to methanol as the organic modifier reduces the AMGS from 7.79 to 5.09 while preserving resolution [5].
Note 2: Root Cause Analysis of Process Deviations
Objective: To swiftly identify the root cause of an observed deviation in a commercial-scale chromatographic unit operation, such as a change in elution pool volume or product purity [17].
Background: During manufacturing, deviations such as atypical chromatograms can occur due to factors like column aging or process parameter variation. A pre-validated digital shadow of the commercial unit operation serves as a testbed for root cause investigation.
Protocol:
- Process Deviation Detected: An atypical output (e.g., shifted retention time, poor yield) is observed during manufacturing.
- Data Collection & Fishbone Analysis: Collect all relevant process data from the deviated batch. Conduct a fishbone (Ishikawa) analysis to identify all potential root cause parameters (e.g., deviation in buffer ionic strength, column loading, gradient slope, loss of column capacity) [17].
- Inverse Modeling via Systematic Parameter Variation: In the digital shadow, systematically alter the parameters identified in Step 2, one or in combination, to simulate their effect on the process output.
- Model-Data Alignment: Compare the simulation outputs to the real-world deviated data. The set of parameter changes that cause the digital shadow's output to align with the observed deviation indicates the most probable root cause.
- Implementation of CAPA: Use the identified root cause to implement a targeted Corrective and Preventive Action, such as adjusting the process control limits or replacing the chromatography column [17].
The following workflow diagram illustrates the integrated protocol for using a digital shadow in root cause analysis.
Note 3: Enhancing Sustainability through Data Management
Objective: To prevent redundant experimentation and its associated waste by implementing a centralized, searchable data management system [3].
Background: Unstructured, siloed data in analytical labs often leads to repeated experiments due to an inability to find or reuse prior knowledge, resulting in unnecessary solvent and energy consumption.
Protocol:
- Establish a Centralized Database: Implement a platform (e.g., based on the Spectrus platform) that can standardize and integrate analytical data from diverse instruments and vendors [3].
- Populate with Historical Data: Upload all existing method development data, including chemical structures, chromatographic methods, metadata, and results (both successful and failed).
- Enforce Data Logging Protocol: Mandate that all new experiments, including those from method development, scale-up, and manufacturing, are uploaded to the centralized database with standardized metadata tags.
- Leverage for AI/ML Readiness: The structured, centralized database is now primed for the application of Artificial Intelligence (AI) and Machine Learning (ML) algorithms, which can further accelerate in-silico modeling and predictive method optimization, leading to even greater reductions in laboratory experiments [3].
Detailed Experimental Protocols
Protocol 1: Constructing and Calibrating a Mechanistic Digital Shadow for Chromatography
Objective: To build and calibrate a mechanistic model of a chromatographic unit operation that can serve as a digital shadow for process design and RCA.
Materials:
- Mechanistic modeling software (e.g., from Sartorius, ACD/Labs)
- Lab-scale chromatography system
- Model protein mixture or target analyte
- Buffers and mobile phases
Method:
- Model Selection: Define the mechanistic model structure (e.g, including mass transfer kinetics, adsorption isotherms) appropriate for the chromatographic mode (e.g., ion-exchange, reversed-phase).
- Lab-Scale Calibration Experiments: a. Perform a set of small-scale calibration experiments. These typically include pulse injections at different flow rates to determine kinetic parameters and breakthrough curves at different concentrations to determine thermodynamic parameters (e.g., adsorption isotherms) [17]. b. Ensure the lab-scale model accurately predicts lab-scale outcomes, such as step yield and impurity clearance, by comparing simulations to experimental results.
- Scale-Up via Digital Shadow: a. For scale-up, define a separate digital model for the commercial-scale equipment, accounting for differences in equipment geometry and system dispersion. b. Crucially, transfer the thermodynamic parameters (e.g., adsorption isotherms) directly from the lab-scale model, as these are invariant with scale. Only fluid dynamic parameters require re-calibration for the larger system [17]. c. Validate the commercial-scale digital shadow with a limited number of at-scale runs.
Protocol 2: Inverse Modeling for Fault Diagnosis Using ANN
Objective: To combine a mechanistic model with an Artificial Neural Network (ANN) to achieve millisecond-speed root cause identification from a deviated chromatogram [47].
Materials:
- Calibrated mechanistic model (from Protocol 1)
- Computational environment for ANN development (e.g., Python with TensorFlow/PyTorch)
- Historical or simulated dataset of deviation scenarios
Method:
- Generate Training Data: a. Use the validated mechanistic model to simulate thousands of chromatograms under a wide range of normal and deviated process conditions (e.g., simultaneous variations in column capacity and gradient length) [47].
- Train the Artificial Neural Network: a. Design an ANN architecture where the input layer is the features of the chromatogram (e.g., full UV signal or extracted peak parameters) and the output layer is the predicted magnitude of the process deviations (e.g., % loss in column capacity, % error in gradient length). b. Train the ANN using the simulated chromatograms as input and the known parameter deviations used in the simulation as the target output.
- Validate the ANN Model: a. Test the trained ANN on a hold-out dataset of simulated deviations or, ideally, on a limited set of deliberately created experimental faults to prove practical capability. b. The study by B. Yan et al. demonstrated maximal errors of 1.5% and 4.90% for predicting deviation in column capacity and elution gradient length, respectively, using this approach [47].
- Deploy for Real-Time RCA: a. Once validated, the ANN model can be deployed. When a deviation occurs in the manufacturing suite, the acquired chromatogram is fed into the ANN, which outputs the most likely root cause(s) in milliseconds.
Protocol 3: Greenness Assessment Using the Analytical Method Greenness Score (AMGS)
Objective: To quantitatively assess and compare the environmental impact of different chromatographic methods.
Materials:
- Detailed description of the chromatographic method (mobile phase composition, flow rate, run time, sample preparation)
- AMGS calculation framework [5]
Method:
- Method Deconstruction: Break down the analytical method into its constituent parts, focusing on the type and volume of solvents used throughout the analysis, including sample preparation.
- Score Calculation: Apply the AMGS algorithm, which assigns penalty points based on the health, safety, and environmental impact of the solvents and the overall solvent consumption [5].
- Interpretation and Comparison: A lower AMGS indicates a greener method. Use this score to objectively compare the greenness of a newly developed in-silico method against a traditional baseline method. For example, a method with an AMGS of 4.49 is significantly greener than a method with an AMGS of 9.46 [5].
Overcoming Data Scarcity with Transfer Learning and Advanced AI Models
In the pursuit of greener chromatographic methods for environmental analysis, researchers face a significant barrier: the scarcity of high-quality, extensive experimental data required to train robust artificial intelligence (AI) models. Data scarcity leads to models with poor predictive power, limited generalizability, and ultimately, a reliance on resource-intensive trial-and-error experimentation that contradicts the principles of green analytical chemistry [48]. This application note details protocols for leveraging transfer learning (TL) and related advanced AI techniques to overcome data limitations, enabling the development of accurate in-silico models for sustainable chromatographic method development.
Understanding Data Scarcity and Advanced AI Solutions
In analytical chemistry, data scarcity arises from the high cost, time, and solvent waste associated with running extensive chromatographic experiments [49] [50]. This creates a bottleneck for AI, particularly deep learning models that are inherently data-hungry [48].
Transfer Learning (TL) is a machine learning technique inspired by human cognition. Instead of training a model from scratch, TL uses knowledge (features and patterns) gained from solving a source task with a large dataset to improve learning in a different but related target task with a limited dataset [48]. In chromatography, a model pre-trained on a large public dataset of molecular structures or retention times can be fine-tuned with a small, proprietary dataset to predict methods for new analytes, drastically reducing the required experimental runs.
Other complementary techniques to combat data scarcity include:
- Active Learning (AL): An iterative process where the model selectively queries an expert (e.g., a chromatographer) to label the most informative data points from a pool of unlabeled data, optimizing the learning efficiency [48].
- Data Augmentation (DA): Artificially increasing the size and diversity of the training dataset by creating modified copies of existing data, a technique well-established in image analysis but requiring careful application in chemistry [48].
- Federated Learning (FL): A decentralized approach where a model is trained across multiple collaborative labs or institutions on their local datasets without sharing the raw data itself, thus preserving privacy while leveraging larger, more diverse data pools [48].
The table below summarizes these techniques and their relevance to green chromatography.
Table 1: Advanced AI Techniques to Overcome Data Scarcity in Chromatography
| Technique | Core Principle | Application in Green Chromatography |
|---|---|---|
| Transfer Learning (TL) | Transfers knowledge from a data-rich source task to a data-poor target task. | Fine-tune a model pre-trained on a public HPLC database to predict optimal mobile phase compositions for a new set of environmental contaminants with minimal new experiments [48]. |
| Active Learning (AL) | Iteratively selects the most valuable data points for expert labeling. | Guides the strategic selection of which chromatographic conditions to test next, minimizing wasted resources on uninformative experiments [48]. |
| Data Augmentation (DA) | Generates new, synthetic training examples from existing data. | Creates virtual congener molecules to expand a limited training set for predicting the retention of a homologous series of pollutants [48]. |
| Federated Learning (FL) | Trains a model collaboratively across institutions without sharing raw data. | Allows multiple pharmaceutical companies to jointly develop a robust retention prediction model while protecting intellectual property, overcoming individual data scarcity [48]. |
Experimental Protocols
Protocol 1: Implementing Transfer Learning for Retention Time Prediction
This protocol provides a step-by-step methodology for developing a TL-based model to predict retention times, thereby reducing the number of initial experiments needed for method development.
1. Objective: To create a accurate retention time prediction model for a target set of environmental pollutants using a small dataset (e.g., <50 compounds) by leveraging a pre-trained model.
2. Research Reagent Solutions & Materials: Table 2: Essential Research Reagents and Materials
| Item | Function/Description | Example |
|---|---|---|
| Source Dataset | A large, public dataset for pre-training the base model. Provides foundational knowledge of structure-retention relationships. | "HPLC Database" with retention times for thousands of small molecules under varied conditions [50]. |
| Target Dataset | A small, specific dataset for fine-tuning. Used to adapt the base model to the specific analytical problem. | In-house measured retention times for 30 target environmental contaminants. |
| Molecular Descriptors | Numerical representations of chemical structures that serve as input features for the model. | Descriptors calculated from SMILES strings (e.g., using RDKit), Abraham solvation parameters (E, S, A, B, V) [50], or molecular fingerprints. |
| Software & Libraries | Computational tools for model building and training. | Python with libraries such as Scikit-learn, TensorFlow/PyTorch, and Chemprop for molecular property prediction. |
3. Procedure:
- Step 1: Data Curation and Pre-processing
- Source Data: Obtain a large, relevant source dataset (e.g., a public HPLC database). Pre-process the data by standardizing retention factors (k) and calculating molecular descriptors or generating features from SMILES strings for all compounds [50].
- Target Data: Collect a small, high-quality dataset of retention times for your target analytes under a defined chromatographic system (e.g., C18 column, acetonitrile/water gradient). Calculate the same molecular descriptors as for the source data.
Step 2: Base Model Pre-training
- Construct a deep neural network (DNN) architecture suitable for regression. Common choices include multi-layer perceptrons (MLPs) or graph neural networks (GNNs) if using graph-based molecular representations.
- Train this model on the entire source dataset to predict retention factors. The goal is for the model to learn general relationships between molecular structures and chromatographic behavior [48].
Step 3: Model Fine-tuning
- Remove the final output layer of the pre-trained base model.
- Replace it with a new, randomly initialized output layer suited to your target task (e.g., a single neuron for predicting retention time).
- Freeze the weights of the initial layers of the network (which capture low-level, general features) and train only the final few layers, including the new output layer, on your small target dataset. Alternatively, train the entire network with a very low learning rate to avoid catastrophic forgetting [48].
Step 4: Model Validation
- Validate the fine-tuned model using leave-one-out cross-validation or a held-out test set from your target data.
- Evaluate performance using metrics such as Mean Absolute Error (MAE) and R², and compare against a model trained from scratch on only the target data to demonstrate the benefit of TL.
Protocol 2: An In-Silico Workflow for Green Method Development
This protocol integrates TL with other in-silico tools to create a comprehensive, waste-minimizing workflow for developing a new chromatographic method.
1. Objective: To develop a green HPLC method for separating a mixture of target compounds with minimal experimental runs, using a combination of in-silico predictions and targeted experimental validation.
2. Procedure:
- Step 1: Define Analytical Goal and Constraints
Step 2: In-Silico Screening with a TL Model
- Use the TL model from Protocol 1 to predict the retention times of your target compounds across a wide range of simulated mobile phase compositions (e.g., different gradients, organic modifiers).
- Screen these in-silico results to identify 3-5 promising method conditions that are predicted to achieve the separation goals while minimizing solvent use and analysis time [49].
Step 3: Targeted Experimental Verification
- Test the top candidate methods identified in Step 2 in the laboratory.
- Use UHPLC instruments with minimized column dimensions (e.g., 2.1 mm i.d.) and core-shell particles to further reduce solvent consumption and waste during this verification phase [51].
Step 4: Greenness Assessment and Final Optimization
- Evaluate the verified methods using greenness assessment tools such as AGREE or GAPI to quantify their environmental impact [49].
- Perform minor, fine-tuning optimizations around the best-performing method if necessary. The final method should successfully separate the analytes while aligning with green chemistry principles.
Workflow Visualization
The following diagram illustrates the integrated in-silico and experimental workflow for greener method development.
In-Silico Green Method Development Workflow
The logical hierarchy of AI techniques available to tackle data scarcity is summarized below.
AI Techniques to Overcome Data Scarcity
Transfer learning and associated advanced AI techniques represent a paradigm shift in chromatographic science, directly addressing the critical challenge of data scarcity. By strategically leveraging existing knowledge, these methods enable the development of accurate in-silico models that drastically reduce the experimental footprint required for analytical method development. This aligns perfectly with the core objectives of green analytical chemistry—minimizing solvent consumption, energy use, and hazardous waste generation. The integration of these computational protocols into routine practice will accelerate research in environmental analysis and drug development, fostering a more sustainable and efficient future for analytical laboratories.
Proving Credibility: Validation Frameworks and Comparative Efficacy
The ASME V&V 40-2018 standard, titled "Assessing Credibility of Computational Modeling through Verification and Validation: Application to Medical Devices," provides a risk-based framework for establishing the trustworthiness of computational models used in regulatory decision-making [52]. The standard defines credibility as "the trust, obtained through the collection of evidence, in the predictive capability of a computational model for a context of use (COU)" [53]. This framework has become a key enabler for the US FDA's Center for Devices and Radiological Health (CDRH) in evaluating computational modeling and simulation data in medical device submissions [54].
For researchers developing greener chromatographic methods in environmental analysis, establishing model credibility is equally crucial. The adoption of in silico approaches aligns with the principles of Green Analytical Chemistry by reducing the environmental footprint associated with traditional method development, which typically requires large volumes of solvent and significant analyst time for experimentation [5]. The ASME V&V 40 standard provides a structured approach to demonstrate that these computational models produce reliable, actionable results for predicting chromatographic behavior and optimizing separation parameters.
Core Framework of ASME V&V 40
Risk-Informed Credibility Assessment
The fundamental principle of the ASME V&V 40 framework is that credibility requirements should be commensurate with the risk associated with the model's use [53]. This risk-based approach ensures that the level of evidence collected through verification and validation (V&V) activities is appropriate for the decision the model informs. The standard outlines a systematic process for establishing credibility goals:
- Define the Question of Interest: The specific question the computational model will help address.
- Define the Context of Use (COU): A detailed statement defining the specific role and scope of the computational model in addressing the question of interest.
- Assess Model Risk: Determine the possibility that using the computational model could lead to a decision resulting in undesirable outcomes. Model risk combines:
- Model Influence: The degree to which the computational model impacts decision-making.
- Decision Consequence: The potential impact of an incorrect decision based on the model.
- Establish Credibility Goals: Set targets for various credibility factors based on the risk analysis.
- Execute and Gather Evidence: Perform planned V&V activities and collect supporting evidence.
- Assess Credibility: Determine whether the credibility goals have been met.
- Document Findings: Record the rationale, evidence, and assessment conclusions [53].
Key Credibility Factors
The ASME V&V 40 standard identifies several credibility factors that represent different elements of the V&V process requiring evidence collection. The table below summarizes these key factors and their roles in establishing overall model credibility.
Table 1: Credibility Factors in ASME V&V 40
| Credibility Factor | Description | Role in Credibility Assessment |
|---|---|---|
| Verification | Process for assessing numerical solution accuracy and software correctness [53] | Ensures the computational model is solved correctly without coding errors |
| Validation | Process for assessing computational model accuracy by comparing to experimental data [53] | Determines how well the model represents real-world phenomena |
| Uncertainty Quantification | Assessment of numerical, parametric, and model form uncertainties [53] | Characterizes confidence in model predictions |
| Model Inputs | Parameters, initial conditions, boundary conditions, and other data required by the model [53] | Ensures input data are appropriate and representative |
Application to Green Chromatographic Method Development
Context of Use for Greener Chromatography
In the context of developing greener chromatographic methods for environmental analysis, computational models serve specific roles that can be precisely defined through the Context of Use statement. For example:
- COU 1: "To predict the resolution of critical pairs when replacing acetonitrile with methanol as the mobile phase modifier for the analysis of pesticide residues in water samples."
- COU 2: "To identify optimal gradient profiles that minimize solvent consumption while maintaining resolution ≥1.5 for all target analytes in pharmaceutical wastewater screening."
These specific COU statements enable a targeted risk assessment and appropriate credibility goals. Research has demonstrated that in silico modeling can successfully replace fluorinated mobile phase additives with chlorinated alternatives, improving the Analytical Method Greenness Score (AMGS) from 9.46 to 4.49 while maintaining or improving resolution [5]. Similarly, replacing acetonitrile with more environmentally friendly methanol can reduce the AMGS from 7.79 to 5.09 while preserving critical resolution [5].
Workflow for Credible Model Development
The following diagram illustrates the systematic workflow for applying ASME V&V 40 to develop credible in silico models for greener chromatography:
Experimental Protocols for Establishing Credibility
Protocol 1: Model Verification for Chromatographic Simulations
Purpose: To ensure that computational models for predicting chromatographic behavior are solved correctly and without numerical errors.
Materials and Equipment:
- Chromatography simulation software (e.g., ACD/Labs, ChromSword, DryLab)
- Reference datasets with known analytical solutions
- Computational resources with sufficient processing power
Procedure:
- Code Verification: Confirm that the software algorithms implement the intended mathematical models correctly using analytical solutions or method-of-manufactured-solutions.
- Calculation Verification: Perform mesh refinement studies for computational fluid dynamics components of chromatographic models to ensure numerical accuracy.
- Software Qualification: Document software version, installation integrity, and patch status.
- Numerical Error Estimation: Quantify discretization errors, iterative convergence errors, and round-off errors.
- Sensitivity Analysis: Evaluate how changes in numerical parameters (e.g., tolerance settings, grid size) affect prediction outcomes.
Acceptance Criteria: Numerical errors should be demonstrated to be smaller than the acceptable uncertainty bounds for the COU.
Protocol 2: Model Validation for Greenness Predictions
Purpose: To demonstrate that computational models accurately predict the environmental impact metrics of chromatographic methods.
Materials and Equipment:
- Chromatographic data system
- HPLC or UHPLC instrumentation
- Solvent consumption tracking system
- Reference standards for target analytes
Procedure: 1. Comparator Selection: Identify appropriate experimental datasets for comparison, including: - Historical method development data - Systematically collected experimental results across the method design space 2. Validation Experiments Design: Plan experiments that cover the expected method operable design region (MODR) with particular focus on: - Mobile phase composition variations - Gradient profile modifications - Stationary phase alternatives 3. Data Collection: Execute validation experiments, measuring: - Retention times and peak shapes for all analytes - Critical pair resolutions - System suitability parameters - Solvent consumption volumes 4. Comparison Metrics: Establish quantitative measures for comparing computational predictions to experimental results, including: - Retention time prediction error (≤ ±2%) - Resolution prediction error (≤ ±10%) - AMGS calculation accuracy (≤ ±0.5 units) 5. Uncertainty Quantification: Characterize uncertainties in both computational and experimental results.
Acceptance Criteria: Validation evidence should demonstrate sufficient agreement between computational predictions and experimental results for the specific COU, with acceptance criteria directly linked to the model risk assessment.
Protocol 3: Uncertainty Quantification for Environmental Impact Predictions
Purpose: To characterize and quantify uncertainties in predicting the environmental impact of chromatographic methods.
Materials and Equipment:
- Statistical analysis software (e.g., R, Python with uncertainty quantification libraries)
- Experimental data for uncertainty propagation
- Sensitivity analysis tools
Procedure: 1. Parameter Uncertainty: Identify and quantify uncertainties in input parameters, including: - Physicochemical properties of analytes - Mobile phase composition accuracy - Column characteristics variability 2. Model Form Uncertainty: Assess limitations in the mathematical models representing chromatographic phenomena. 3. Numerical Uncertainty: Quantify errors introduced by numerical approximations in the solution process. 4. Experimental Uncertainty: Characterize variability in validation data, including: - Instrument precision - Preparation variability - Measurement errors 5. Uncertainty Propagation: Employ statistical methods (e.g., Monte Carlo simulation) to propagate uncertainties through the computational model to output predictions. 6. Global Sensitivity Analysis: Identify parameters contributing most significantly to output uncertainty using techniques such as Sobol' indices or Morris screening.
Acceptance Criteria: Total prediction uncertainty should be sufficiently small to support confident decision-making for the specific COU.
The Scientist's Toolkit: Essential Research Reagent Solutions
Table 2: Essential Research Reagent Solutions for Credible In Silico Modeling
| Tool/Category | Specific Examples | Function in Credibility Assessment |
|---|---|---|
| Chromatography Modeling Software | ACD/ChromGenius, DryLab, ChromSword | Predicts retention times, resolution, and optimal separation conditions for method development [5] |
| Environmental Impact Calculators | Analytical Method Greenness Score (AMGS) | Quantifies environmental footprint of chromatographic methods [5] |
| Verification Test Suites | Analytical solutions for simplified models, grid convergence tools | Provides reference solutions for code and calculation verification [53] |
| Uncertainty Quantification Tools | Monte Carlo simulation packages, sensitivity analysis libraries | Characterizes and propagates uncertainties in model predictions [53] |
| Validation Datasets | Historical method development data, systematically collected experimental results | Serves as comparators for assessing model accuracy [54] |
| Documentation Frameworks | Electronic lab notebooks, model credibility assessment templates | Records evidence and rationale for credibility claims [53] |
Regulatory Landscape and Future Developments
The regulatory environment for in silico methods is rapidly evolving. The FDA has established a Modeling and Simulation Working Group with nearly 200 scientists across FDA centers to foster enhanced communication about modeling efforts and promote consistent review [55]. The agency has also published draft guidance titled "Assessing the Credibility of Computational Modeling and Simulation in Medical Device Submissions" that describes a risk-based framework similar to ASME V&V 40 [55].
Emerging applications include In Silico Clinical Trials (ISCTs) where simulated patients augment or replace results from human trials, though these approaches present unique credibility challenges given limitations in direct validation against human data [54]. The ASME VVUQ 40 subcommittee is actively working on extensions to the original standard, including:
- Technical Report VVUQ 40.1: Providing a comprehensive example applying ASME V&V 40 to a tibial tray fatigue assessment model [54].
- Patient-Specific Modeling Guidance: Developing credibility assessment frameworks for patient-specific computational models [54].
- Historical Data Utilization: Exploring the use of historical data as comparators for validation activities [54].
For environmental and pharmaceutical analysts, these developments signal a growing regulatory acceptance of properly validated in silico approaches that can reduce environmental impact while maintaining scientific rigor.
The ASME V&V 40 standard provides a robust, risk-informed framework for establishing the credibility of computational models used in developing greener chromatographic methods. By systematically addressing verification, validation, and uncertainty quantification through well-defined protocols, researchers can generate sufficient evidence to support regulatory submissions and scientific publications. The framework's flexibility allows application across various contexts of use, from solvent replacement strategies to method optimization for reduced environmental impact. As regulatory agencies increasingly accept alternative methods and in silico approaches, proper credibility assessment will become essential for advancing green analytical chemistry principles in separation science.
Defining the Context of Use (COU) for Risk-Informed Credibility Assessment
The Context of Use (COU) is a foundational concept in computational model development, defined as a "statement that defines the specific role and scope of the computational model used to address the question of interest" [56]. Establishing a well-defined COU is critical for risk-informed credibility assessment, which determines the trustworthiness of a model's predictions for a specific application [56]. This framework is particularly essential for in silico modeling in environmental analysis, where models inform regulatory decisions and green method development without extensive physical experimentation [5] [21].
The credibility of a computational model is not an absolute property but is intrinsically tied to its COU [56]. A model considered highly credible for one context may be inadequate for another, depending on the specific questions being addressed and the consequences of an incorrect decision. The risk-informed credibility assessment framework provides a systematic approach to establish and evaluate this trust, ensuring that model validation activities are commensurate with the model's influence on decisions and the potential impact of those decisions [56] [57].
Core Framework and Key Definitions
Foundational Concepts
The risk-informed credibility framework centers on several interconnected concepts that guide model development and evaluation [56]:
- Question of Interest: The specific question, decision, or concern that the modeling aims to address
- Context of Use (COU): How the model will be used to address the question, including its specific role and scope
- Model Risk: The possibility that model results may lead to an incorrect decision, determined by model influence and decision consequence
- Model Credibility: Trust in the predictive capability of a model for a specific COU, established through evidence collection
Table 1: Core Definitions in Risk-Informed Credibility Assessment [56]
| Term | Definition |
|---|---|
| Context of Use | Statement defining the specific role and scope of the computational model for a specific question |
| Model Credibility | Trust in the predictive capability of a model for a context of use |
| Model Risk | Possibility that model results may lead to an incorrect decision and adverse outcome |
| Model Influence | Contribution of the model relative to other evidence in decision-making |
| Decision Consequence | Significance of an adverse outcome from an incorrect decision |
| Verification | Process of determining if a model correctly represents the underlying mathematical model |
| Validation | Process of determining if a model accurately represents the real world |
The Credibility Assessment Workflow
The credibility assessment process follows a logical sequence that ensures appropriate rigor based on model risk. The workflow begins with defining the problem and concludes with a determination of the model's suitability for its intended purpose.
Implementing the Framework: Protocols and Procedures
Defining the Context of Use
A well-defined COU must explicitly specify several key elements that collectively establish the model's purpose and boundaries [56] [58]:
- Specific Role: Describe how the model will address the question of interest
- Model Inputs and Outputs: Define all input parameters and the specific outputs the model will generate
- Application Scope: Detail the conditions, ranges, and circumstances under which the model applies
- Supporting Evidence: Identify additional data sources that will inform the question alongside model outputs
For environmental applications such as greener chromatographic methods, the COU should specifically address how the model will contribute to reducing environmental impact while maintaining analytical performance [5]. For example: "The in silico model will predict optimal mobile phase compositions that minimize environmental impact (as measured by the Analytical Method Greenness Score, AMGS) while maintaining resolution ≥1.5 for all critical peak pairs in pharmaceutical impurity analysis" [5].
Assessing Model Risk
Model risk assessment determines the appropriate level of validation rigor required. It is a function of two primary factors [56] [57]:
- Model Influence: The weight of the model evidence in the overall decision relative to other evidence sources
- Decision Consequence: The significance of an adverse outcome resulting from an incorrect decision based on the model
Table 2: Model Risk Assessment Matrix [56] [57]
| Decision Consequence | Low Model Influence | Medium Model Influence | High Model Influence |
|---|---|---|---|
| Low Impact | Low Risk | Low Risk | Medium Risk |
| Medium Impact | Low Risk | Medium Risk | High Risk |
| High Impact | Medium Risk | High Risk | High Risk |
Decision consequence categories should consider environmental and safety impacts. For example, high impact might include models informing regulatory decisions about pesticide environmental risk [21] or methods affecting drug safety [57], while low impact might include preliminary screening of green solvent options [5].
Establishing Credibility through Verification and Validation
The rigor of verification and validation (V&V) activities should be commensurate with the model risk level determined in the previous step. The ASME framework identifies 13 credibility factors across verification, validation, and applicability activities [56]:
- Verification Activities: Code verification (software quality assurance, numerical code verification) and calculation verification (discretization error, numerical solver error, use error)
- Validation Activities: Model validation (model form, model inputs), comparator (test samples, test conditions), and assessment (equivalency of input parameters, output comparison)
- Applicability Evaluation: Relevance of quantities of interest and relevance of validation activities to the COU
For high-risk models, comprehensive validation against experimental data is essential. For example, in pesticide environmental risk assessment, models should be validated against measured environmental concentrations and toxicity data [21]. For greener chromatographic methods, validation should demonstrate correlation between predicted and experimental resolution values and greenness scores [5].
Application to Greener Chromatographic Methods in Environmental Analysis
Case Study: Greener Analytical Chemistry
In silico modeling has demonstrated significant value in developing greener chromatographic methods by enabling virtual screening of solvent systems and conditions before laboratory testing [5]. A recent application demonstrated how in silico modeling could map the Analytical Method Greenness Score (AMGS) across separation landscapes, allowing simultaneous optimization of method performance and environmental impact [5].
Specific Application Example: Replacement of fluorinated mobile phase additives with chlorinated alternatives while maintaining separation quality [5]:
- COU: Predict optimal chlorinated mobile phase conditions that maintain resolution ≥1.40 for critical peak pairs while reducing AMGS
- Model Risk: Medium (informs method development but not final regulatory decisions)
- Credibility Activities: Validation against experimental resolution data for 15 pharmaceutical compounds; comparison of predicted versus experimental AMGS values
- Result: AMGS reduced from 9.46 to 4.49 while critical pair resolution improved from fully overlapped to 1.40 [5]
Protocol: In Silico Method Greening
This protocol provides a step-by-step methodology for applying COU definition and credibility assessment to the development of greener chromatographic methods.
Materials and Computational Tools:
- Chromatographic modeling software (e.g., ChromSword, ACD/LC Simulator)
- Greenness assessment tools (AMGS calculator)
- Chemical structure databases
- Property prediction models (QSAR for solvent environmental impact)
Experimental Procedure:
Define the Analytical Requirement
- Identify target analytes and required separation critical pairs
- Establish minimum resolution requirements (typically ≥1.5)
- Define analytical performance criteria (precision, accuracy, sensitivity)
Establish the COU for Method Greening
- State the primary question: "What mobile phase composition provides adequate resolution while minimizing environmental impact?"
- Define model scope: "Predict retention times and resolution for all critical pairs across a water-methanol-acetonitrile gradient with 0.1% formic acid"
- Specify applicability domain: "Small molecule pharmaceuticals (<1000 Da) with log P -2 to 8"
Assess Model Risk and Determine Credibility Requirements
- Evaluate decision consequence based on method application (research vs. regulatory)
- Determine model influence relative to experimental verification
- Establish credibility goals: "Predicted retention times within ±0.5 min of experimental; resolution predictions accurate to ±0.2"
Execute Validation Plan
- Collect experimental retention data for 20-30 representative compounds
- Compare predicted versus experimental resolution for critical pairs
- Validate greenness predictions against established metrics (AMGS)
- Document any model limitations and applicability boundaries
Deploy Model for Green Optimization
- Screen multiple mobile phase compositions virtually
- Identify conditions meeting resolution requirements with minimal environmental impact
- Select top 2-3 candidates for experimental verification
- Confirm predictions with limited laboratory testing
Table 3: Research Reagent Solutions for In Silico Credibility Assessment
| Tool/Category | Function | Example Applications |
|---|---|---|
| QSAR Models [59] [26] | Predict chemical properties and toxicity based on structure | Predicting environmental fate of pesticides [21], solvent toxicity |
| Agent-Based Models [23] | Simulate interactions of autonomous agents in systems | Modeling contaminant spread in facilities [23] |
| PBPK Models [56] | Predict pharmacokinetics across physiological compartments | Chemical exposure assessment in organisms [21] |
| Chromatographic Modeling [5] | Simulate separation performance under various conditions | Greener method development [5] |
| Exposure Models [21] | Predict environmental distribution of chemicals | Pesticide drift (AGDISP) [21], soil/water contamination |
| Credibility Assessment [56] [57] | Framework for establishing model trustworthiness | Regulatory submission support [57] |
The rigorous definition of Context of Use provides the essential foundation for risk-informed credibility assessment of in silico models in environmental analysis. By implementing the structured framework outlined in this article—with clear COU definition, risk-proportionate validation, and comprehensive documentation—researchers can develop trustworthy models that accelerate the adoption of greener analytical methods while maintaining scientific rigor and regulatory compliance.
In the evolving landscape of scientific research, digital transformation is reshaping traditional methodologies across various disciplines. The comparative analysis between in silico technologies (IST) and traditional experimental methods represents a paradigm shift in how researchers approach method development, particularly in environmental analysis and pharmaceutical sciences. In silico technologies leverage advanced computational techniques like artificial intelligence (AI), machine learning (ML), and biosimulation to replicate and study complex biological and chemical systems without the immediate need for physical experiments [60]. This evolution from primarily in vivo (within living organisms) and in vitro (in controlled laboratory environments) approaches to computational methods offers a faster, more cost-effective, and ethical alternative to traditional techniques [60]. This application note provides a detailed comparative framework and practical protocols for implementing in silico approaches, specifically contextualized within greener chromatographic methods for environmental analysis research.
Comparative Framework: Quantitative Analysis
The following tables summarize key quantitative differences between in silico and traditional experimental methods across multiple performance metrics.
Table 1: Performance and Efficiency Comparison
| Metric | Traditional Methods | In Silico Methods | Key Findings |
|---|---|---|---|
| Development Timeline | Several years for drug development [60] | Significantly accelerated; market entry 2 years earlier in a cited case [60] | In silico modeling streamlines early phases and optimizes clinical trial design [60]. |
| Cost Implications | High (e.g., pesticide toxicity tests cost up to $9.9M) [21] | Substantial savings (e.g., ~$10M saved in a Medtronic case) [60] | Savings result from reduced patient enrollment and faster market dominance [60]. |
| Environmental Impact | High solvent consumption, waste generation [5] [4] | AMGS reduced from 9.46 to 4.49 by replacing solvents in silico [5] | In silico modeling identifies greener mobile phases, preventing waste [5] [4]. |
| Animal Testing | Relies heavily on animal models [21] | Reduces animal use; one model saved 0.1-0.15 million animals [21] | Aligns with FDA Modernization Act 2.0 for alternative methods [60]. |
| Predictive Accuracy | Varies by method; animal models ~75% accuracy for cardiotoxicity [61] | High (e.g., 89% accuracy for clinical arrhythmia risk) [61] | Human in silico trials can outperform animal models in specific contexts [61]. |
Table 2: Application-Specific Outcomes in Chromatography and Environmental Science
| Application Area | Traditional Approach Limitation | In Silico Advantage | Outcome |
|---|---|---|---|
| Analytical Chromatography | Laborious, solvent-intensive method refinement [5] | Maps Analytical Method Greenness Score (AMGS) across separation landscape [5] | Replaced acetonitrile with methanol, reducing AMGS from 7.79 to 5.09 [5]. |
| Preparative Chromatography | Multiple purification replicates required [5] | Uses resolution maps to capitalize on peak crossover [5] | Increased API loading by 2.5x, reducing replicates and solvent waste [5]. |
| Pesticide Risk Assessment | Complex, time-consuming toxicity tests on animals [21] | Computational tools (e.g., AGDISP, BeeTox) predict exposure and toxicity [21] | Assesses pesticide risk in air, water, soil; saves time and cost [21]. |
| Environmental Monitoring | Trial-and-error sampling program design [23] | Agent-based models (ABMs) simulate Listeria dynamics in facilities [23] | Rapidly evaluates sampling schemes to locate contamination [23]. |
Experimental Protocols
Protocol: Developing a Greener Chromatographic Method In Silico
This protocol enables the development of environmentally friendly chromatographic methods using computational tools, minimizing laboratory waste.
I. Research Reagent Solutions Table 3: Essential Materials and Software Tools
| Item Name | Function/Description | Application in Protocol |
|---|---|---|
| Method Development Software | Platforms with predictive tools for chromatography (e.g., logP, pKa, column selection) [4] | Predicts optimal starting points for method development (Sections II-III). |
| Quantitative Structure-Property Relationship (QSPR) | Algorithms predicting physicochemical properties from molecular structure [4] [62] | Informs initial method conditions based on analyte structure (Section II). |
| In Silico Modeling/Simulation Suite | Software for computer-assisted method development; creates resolution maps [5] | Simulates chromatographic separations under various conditions (Section III). |
| Centralized, Searchable Database | Vendor-neutral data management system for historical analytical data [4] | Provides data for model training and validation; prevents experiment duplication (Section IV). |
II. Define Objectives and Input Analyte Data
- Success Criteria: Define critical parameters including resolution (>1.5), run time (<10 min), and greenness targets (e.g., reduced AMGS) [5] [4].
- Analyte Characterization: Use software prediction tools based on QSPR calculations to determine key physicochemical properties (e.g., logP, logD, pKa) of the target analytes [4].
III. Model Construction and In Silico Screening
- Initial Conditions: Utilize software-based column selection and pH selection tools to predict a optimal starting point [4].
- Separation Modeling: Employ the in silico modeling suite to simulate the separation landscape. This involves calculating critical pair resolution and the AMGS across a wide range of method conditions (e.g., mobile phase composition, gradient profile, temperature) [5].
- Mobile Phase Optimization:
- Simulate the replacement of hazardous solvents (e.g., acetonitrile) with greener alternatives (e.g., methanol) [5] [4].
- Model the substitution of concerning additives (e.g., fluorinated additives) with less harmful options (e.g., chlorinated additives) while monitoring the impact on resolution and AMGS [5].
IV. Model Validation and Refinement
- Experimental Verification: Conduct a minimal set of physical experiments (e.g., 2-3 runs) using the top-ranked conditions identified in silico to validate the model's predictions [5] [63].
- Model Refinement: If discrepancies exist between predicted and observed results, refine the computational model by incorporating the new experimental data. This follows a perpetual refinement cycle to enhance future predictive accuracy [60].
- Data Archiving: Store all experimental results and final method parameters in a centralized database to build institutional knowledge and fuel future AI/ML applications [4].
Protocol: In Silico Environmental Risk Assessment (ERA) for Pesticides
This protocol outlines the use of computational tools to assess the environmental exposure and toxicity of pesticides, reducing reliance on extensive animal testing.
I. Problem Formulation and Hazard Identification
- Define the assessment goals and identify the pesticide's potential hazards to environmental compartments (air, water, soil) and non-target organisms (e.g., aquatic life, honeybees) [21].
II. Exposure Assessment Using Modeling Tools
- Air Exposure: Use models like the AGricultural DISPersal model (AGDISP) to predict pesticide spray drift and deposition, simulating transfer into the atmosphere up to 400 meters from the application site [21].
- Water and Soil Exposure: Apply advanced exposure models (e.g., TOXSWA) to estimate the spatial and temporal concentration of pesticides in water and soil, considering factors like rainfall and degradation pathways [21].
III. Toxicity Assessment via In Silico Tools
- Model Application: Use computational models like BeeTox (a graph attention convolutional neural network model) to predict toxicity to specific organisms. The BeeTox model has demonstrated a prediction accuracy of 0.837 for honeybee toxicity [21].
- Data-Driven Approach: Ensure these models are trained on sizable datasets of effective descriptors that capture the intricate physicochemical and structural properties of pesticides [21].
IV. Risk Characterization and Validation
- Integration: Combine the predictions from exposure and toxicity models to characterize the overall environmental risk [21].
- Validation: Compare in silico predictions against any available experimental data or established regulatory thresholds to evaluate the model's robustness and applicability [21].
Visual Workflows and Signaling Pathways
The following diagrams illustrate the core workflows and logical relationships in in silico method development.
Diagram 1: In Silico Method Development and Refinement Cycle. This workflow illustrates the iterative process of developing and validating chromatographic methods through computational modeling, significantly reducing physical experiments. The core cycle involves model construction, prediction, experimental validation, and refinement based on observed discrepancies [60] [5].
Diagram 2: Comparative Workflow: Traditional vs. In Silico Approaches. This diagram contrasts the fundamental steps and characteristics of traditional experimental method development with the in silico paradigm, highlighting the efficiency and environmental benefits of the computational approach [60] [5] [4].
The comparative analysis unequivocally demonstrates that in silico technologies offer a transformative pathway for method development, particularly in advancing green chemistry principles in environmental and pharmaceutical research. The strategic integration of in silico tools delivers tangible benefits: a drastic reduction in solvent consumption and waste generation, significant cost and time savings, and a move away from animal testing. As AI and machine learning continue to evolve, the predictive power and accuracy of these models are expected to increase further, enabling more personalized and precise environmental and medical interventions. For researchers, embracing in silico methodologies is no longer a speculative future but a present-day imperative to foster sustainable, efficient, and innovative scientific discovery.
The adoption of in silico modeling represents a paradigm shift in the development of chromatographic methods for environmental analysis. This approach uses computational simulations to predict optimal separation conditions, thereby minimizing the need for extensive laboratory experimentation. The core benefits of this strategy are threefold: a significant reduction in the consumption of hazardous organic solvents, a decrease in the generation of toxic waste, and a substantial saving of analyst time and labor. This application note provides a quantitative and practical framework for environmental researchers and drug development professionals to implement these greener protocols, aligning with the principles of Green Analytical Chemistry (GAC) and the broader goals of laboratory sustainability [64] [4].
Quantitative Benefits of In Silico Modeling
The transition from traditional, trial-and-error method development to in silico modeling offers measurable improvements in sustainability and efficiency. The data below quantify these benefits across key environmental and operational metrics.
Table 1: Quantified Benefits of In Silico and Green Chromatography Practices
| Parameter | Traditional Method | In Silico/Green Approach | Quantitative Benefit | Key References |
|---|---|---|---|---|
| Solvent Consumption | High (HPLC-scale flow rates) | Low (UHPLC, SFC, microextraction) | Up to 90% reduction with SFC; ~50-80% with UHPLC & miniaturization [6] [1] [9] | |
| Solvent Waste Generation | Significant volumes from method development and analysis | Drastically reduced | Prevention is prioritized; waste minimized via predictive modeling [4] | |
| Analyst Time | Extensive for manual optimization | Greatly reduced | Fewer physical experiments; rapid identification of optimal conditions [5] [4] | |
| Method Greenness Score (AMGS) | Use of toxic solvents (e.g., acetonitrile with TFA) | Use of greener solvents (e.g., methanol, MSA) | Score reduction from 9.46 to 4.49 in a case study [5] | |
| Preparative Purification Efficiency | Standard sample loading | Optimized loading via modeling | 2.5x increase in loading, reducing replicates and solvent use [5] |
In Silico Method Development Workflow
The following protocol and diagram outline a systematic workflow for developing greener chromatographic methods using in silico modeling.
Figure 1: This workflow illustrates the iterative in silico modeling process for greener chromatographic method development.
Protocol: In Silico Method Development and Transfer
Objective: To computationally develop a green liquid chromatography method and transfer it to a sustainable laboratory practice.
Materials:
- Software: Chromatography modeling software (e.g., ACD/Labs, ChromSword)
- Data: Analyte structures and/or known physicochemical properties (pKa, logP)
- Instrumentation: UHPLC system capable of withstanding high pressures
Procedure:
Define Analytical Goals: Input the required separation criteria, such as resolution of critical pairs (>1.5), runtime constraints, and sensitivity needs, into the software.
Input Compound Data: Enter the chemical structures of analytes. The software will use Quantitative Structure-Property Relationship (QSPR) calculations to predict key properties like pKa and logP, which inform the model [4].
Generate In Silico Separation Landscape: Simulate chromatographic separations across a multi-dimensional grid of conditions (e.g., pH, gradient time, temperature, mobile phase composition). The software will model retention times and peak shapes for each condition.
Map and Evaluate Greenness: Use the software to overlay the Analytical Method Greenness Score (AMGS) or similar metrics onto the separation model. This allows for the direct visualization of conditions that provide both adequate performance and superior greenness [5].
Identify Optimal Conditions: Select the method conditions that meet all analytical goals while minimizing the environmental footprint. This often involves:
Laboratory Verification: Perform a minimal set of physical experiments (e.g., 1-2 runs) to confirm the predictions of the in silico model. This step validates the method's robustness before full implementation.
Greener Experimental Protocols
Once a method is designed in silico, the following practical protocols can be implemented in the laboratory to further enhance sustainability.
Protocol: Transfer from HPLC to UHPLC
Objective: Reduce solvent consumption and waste generation by migrating an existing HPLC method to a UHPLC platform.
Materials:
- Columns: Core-shell or sub-2µm particle columns (e.g., 50-100 mm length, 2.1 mm internal diameter)
- Instrumentation: UHPLC system
- Software: Method scaling calculator
Procedure:
- Select Appropriate Column: Choose a UHPLC column with a particle size and chemistry similar to the original HPLC column.
- Calculate Scaled Parameters: Use a method scaling calculator to adjust the method. Key adjustments include:
- Reducing the column length and internal diameter.
- Scaling down the flow rate proportionally.
- Shortening the gradient time while maintaining the same gradient steepness.
- Verify Performance: Run the scaled method and confirm that resolution and peak capacity are maintained compared to the original method. The use of smaller particle columns provides higher efficiency, allowing for faster separations with less solvent [64] [9].
Protocol: Replacement of Toxic Mobile Phase Additives
Objective: Improve the greenness profile of a peptide analysis method by replacing trifluoroacetic acid (TFA) with methanesulfonic acid (MSA).
Materials:
- Acids: Trifluoroacetic Acid (TFA), Methanesulfonic Acid (MSA)
- Mobile Phase: Water and acetonitrile or methanol, HPLC grade
Procedure:
- Prepare Mobile Phases:
- Mobile Phase A: Water with 0.1% MSA (v/v).
- Mobile Phase B: Acetonitrile (or methanol) with 0.1% MSA (v/v).
- Adjust Method Conditions: Using in silico modeling or limited experimentation, fine-tune the gradient profile to achieve resolution of critical pairs comparable to the TFA-based method. Note that MSA may offer different selectivity and UV background [65].
- Assess Method Greenness: Calculate the AMGS for the new method. A successful transfer will show a lower score, indicating improved greenness, as demonstrated in a study where the score was reduced from 9.46 to 4.49 [5].
The Scientist's Toolkit: Essential Research Reagents & Materials
Table 2: Key materials and technologies for implementing greener chromatography.
| Tool Category | Specific Examples | Function & Green Benefit |
|---|---|---|
| Green Solvents | Methanol, Ethanol, Natural Deep Eutectic Solvents (NADES) | Less toxic, biodegradable alternatives to acetonitrile and halogenated solvents [6] [64] [9]. |
| Alternative Mobile Phases | Supercritical CO₂ (for SFC) | Non-toxic, reusable primary mobile phase that eliminates most organic solvent use [6] [1]. |
| Green Additives | Methanesulfonic Acid (MSA) | Lower toxicity and better biodegradability than TFA/DFA for ion-pairing in biomolecule analysis [65]. |
| High-Efficiency Columns | Core-shell, Monolithic, Sub-2µm particle columns | Enable faster separations with shorter columns, reducing solvent consumption and analysis time [64] [9]. |
| Microextraction Techniques | Solid Phase Microextraction (SPME), Liquid Phase Microextraction (LPME) | Minimize solvent and sample volume requirements in sample preparation [6]. |
The quantitative data and detailed protocols presented herein demonstrate that in silico modeling is a powerful engine for driving sustainability in chromatographic laboratories. By adopting these strategies, researchers can achieve dramatic reductions in solvent use and hazardous waste while liberating valuable analyst time from repetitive experimentation. This approach provides a clear, actionable path for the environmental analysis and pharmaceutical development sectors to align their analytical practices with the urgent principles of green chemistry and sustainable science.
Conclusion
In silico modeling represents a paradigm shift in chromatographic method development, offering a scientifically rigorous pathway to drastically reduce the environmental footprint of analytical laboratories. By integrating foundational principles of green chemistry with advanced computational methodologies like QSRR and DoE, scientists can now design methods that are both high-performing and sustainable. The ability to replace hazardous solvents, optimize separations virtually, and troubleshoot processes with digital shadows leads to undeniable benefits: significantly less solvent waste, reduced energy consumption, and accelerated development timelines. As regulatory frameworks for model validation mature, the adoption of these in silico strategies is poised to become standard practice. The future of greener chromatography is digital, empowering researchers to meet their analytical and environmental goals simultaneously, ultimately contributing to more sustainable biomedical and clinical research.
References
- 1. How Green is the Future of Chromatography? [https://www.chromatographyonline.com/view/how-green-is-the-future-of-chromatography-]
- 2. Green analytical approaches for contaminants: Sustainable ... [https://www.sciencedirect.com/science/article/pii/S0021967325002699]
- 3. Sustainable Analytical Labs: Software for Greener ... [https://www.acdlabs.com/blog/sustainable-analytical-labs-software-for-greener-chromatography/]
- 4. Sustainable Chromatography: Embracing Software for ... [https://www.sepscience.com/sustainable-chromatography-embracing-software-for-greener-method-development-11434]
- 5. In silico modeling enables greener analytical and ... [https://pubs.rsc.org/en/content/articlelanding/2025/gc/d4gc04300f]
- 6. Recent Advances In Green Chromatography Techniques ... [https://www.sciencedirect.com/science/article/pii/S2772391725000830]
- 7. How Greener Practices are Reshaping Analytical Chemistry [https://www.chromatographyonline.com/view/green-analytical-chemistry-efficiency-automation-sustainability]
- 8. Green analytical chemistry: integrating sustainability into ... [https://pmc.ncbi.nlm.nih.gov/articles/PMC11772533/]
- 9. Green Chromatography: Reducing Environmental Impact ... [https://www.sepscience.com/green-chromatography-reducing-environmental-impact-in-lab-practices-11323]
- 10. The 12 principles of green analytical chemistry and ... [https://www.sciencedirect.com/science/article/pii/S0165993613001234]
- 11. Green Analytical Chemistry—Recent Innovations [https://www.mdpi.com/2673-4532/6/1/10]
- 12. Modeling an in silico platform to predict chromatographic ... [https://www.sciencedirect.com/science/article/pii/S0026265X2031122X]
- 13. A comprehensive review of modern green analytical methods [https://www.sciencedirect.com/science/article/pii/S2772826924000178]
- 14. Nonlinear Predictive Modelling Enables In Silico ... [https://www.chromatographyonline.com/view/nonlinear-predictive-modelling-enables-in-silico-optimization-of-chromatographic-methods-for-complex-stationary-phase-analyte-interactions]
- 15. The Role of HPLC Columns in Shaping a Greener ... [https://www.chromatographyonline.com/view/the-role-of-hplc-columns-in-shaping-a-greener-analytical-future]
- 16. In-silico method development and optimization of on-line ... [https://www.sciencedirect.com/science/article/pii/S0021967324001912]
- 17. In-Silico Data-Driven Mechanistic Model–Assisted Process ... [https://ispe.org/pharmaceutical-engineering/may-june-2024/silico-data-driven-mechanistic-model-assisted-process]
- 18. The use of predictive models to develop chromatography- ... [https://pmc.ncbi.nlm.nih.gov/articles/PMC9605695/]
- 19. Comparing in silico flowsheet optimization strategies in ... [https://pmc.ncbi.nlm.nih.gov/articles/PMC12000642/]
- 20. HPLC 2025 Preview: The Road To Sustainable Analytical ... [https://www.chromatographyonline.com/view/hplc-2025-preview-the-road-to-sustainable-analytical-chemistry]
- 21. In silico environmental risk assessment improves efficiency ... [https://www.sciencedirect.com/science/article/abs/pii/S0048969723065051]
- 22. Predictive Models for Chromatographic Retention and ... [https://cramerlab.cbe.rpi.edu/research/multiscale-modeling-protein-interactions-chromatography-and-biomanufacturability-1]
- 23. In Silico Models for Design and Optimization of Science ... [https://pmc.ncbi.nlm.nih.gov/articles/PMC8516048/]
- 24. Utilisation of Analytical Method Greenness Score to drive ... [https://pubs.rsc.org/pt-br/content/articlehtml/2025/gc/d5gc01574j]
- 25. Green Approaches in High-Performance Liquid ... [https://www.mdpi.com/1420-3049/30/17/3573]
- 26. In silico environmental chemical science: properties and ... [https://pubs.rsc.org/en/content/articlelanding/2017/em/c7em00053g]
- 27. Application of artificial intelligence to quantitative structure– ... [https://pmc.ncbi.nlm.nih.gov/articles/PMC11782803/]
- 28. QSRR Approach: Application to Retention Mechanism in ... [https://www.intechopen.com/chapters/82853]
- 29. Review Recent applications of liquid chromatography ... [https://www.sciencedirect.com/science/article/abs/pii/S0022354925005015]
- 30. Recent applications of liquid chromatography-based ... [https://pubmed.ncbi.nlm.nih.gov/41176062/]
- 31. Development of quantitative structure-retention relationship ... [https://www.sciencedirect.com/science/article/abs/pii/S0039914022006579]
- 32. Application of Biomimetic Chromatography and QSRR ... [https://www.mdpi.com/1422-0067/26/5/1855]
- 33. In silico prediction of pesticide residue retention times in ... [https://www.sciencedirect.com/science/article/abs/pii/S0963996925018174]
- 34. QSRR Models Sharpen Retention Time Predictions for ... [https://www.chromatographyonline.com/view/qsrr-models-sharpen-retention-time-predictions-for-plant-based-bioactives-in-chromatographic-analysis]
- 35. An in-silico approach towards multivariate acceptable ranges ... [https://aapsopen.springeropen.com/articles/10.1186/s41120-024-00095-y]
- 36. In silico analysis of design of experiment methods for ... [https://www.sciencedirect.com/science/article/pii/S2001037024001442]
- 37. Replace, reduce, and reuse organic solvents in peptide ... [https://pubs.rsc.org/en/content/articlehtml/2025/gc/d5gc01158b]
- 38. In silico modeling enables greener analytical and preparative ... [https://pubs.rsc.org/en/content/articlehtml/2025/gc/d4gc04300f]
- 39. 7 Key Differences in the Use of Methanol and Acetonitrile [https://www.shimadzu.com/an/service-support/technical-support/liquid-chromatography/essential_knowledge/methanol_acetonitrile.html]
- 40. The role of methanol addition to water samples in reducing ... [https://www.sciencedirect.com/science/article/abs/pii/S0021967315003015]
- 41. Green Chromatography (Part 1): Introduction and Liquid ... [https://www.chromatographyonline.com/view/green-chromatography-part-1-introduction-and-liquid-chromatography]
- 42. The role of fluorinated alcohols as mobile phase modifiers ... [https://pmc.ncbi.nlm.nih.gov/articles/PMC5500909/]
- 43. Assessing the Environmental Impact of Analytical Methods [https://www.chromatographyonline.com/view/the-green-component-assessing-the-environmental-impact-of-analytical-methods]
- 44. Digital twin mathematical models suggest individualized ... [https://pmc.ncbi.nlm.nih.gov/articles/PMC11169363/]
- 45. Design Model for the Digital Shadow of a Value Stream [https://www.mdpi.com/2079-8954/12/1/20]
- 46. Root Cause Analysis of Quality Defects Using HPLC-MS ... [https://pubmed.ncbi.nlm.nih.gov/25703809/]
- 47. Root cause investigation of deviations in protein ... [https://www.sciencedirect.com/science/article/pii/S0021967317311330]
- 48. Current strategies to address data scarcity in artificial ... [https://www.sciencedirect.com/science/article/abs/pii/S0010482524008199]
- 49. Greenness and performance evaluation of AI-predicted ... [https://www.sciencedirect.com/science/article/pii/S266683192500075X]
- 50. In Silico High-Performance Liquid Chromatography ... [https://pmc.ncbi.nlm.nih.gov/articles/PMC11983366/]
- 51. Enhancing Sustainable Analytical Chemistry in Liquid ... [https://www.preprints.org/manuscript/202406.0778]
- 52. VV 40 - Assessing Credibility of Computational Modeling ... [https://www.asme.org/codes-standards/find-codes-standards/assessing-credibility-of-computational-modeling-through-verification-and-validation-application-to-medical-devices]
- 53. Assessing Computational Model Credibility Using a Risk ... [https://pmc.ncbi.nlm.nih.gov/articles/PMC6493688/]
- 54. Current Applications and Future Developments of the ASME ... [https://dmd.umn.edu/2025/vv40]
- 55. Implementing Alternative Methods [https://www.fda.gov/science-research/advancing-alternative-methods-fda/implementing-alternative-methods]
- 56. Consideration of a Credibility Assessment Framework in ... [https://pmc.ncbi.nlm.nih.gov/articles/PMC6966181/]
- 57. A Model's Credibility Is in the Details: FDA Draft Guidance ... [https://www.troutman.com/insights/a-models-credibility-is-in-the-details-fda-draft-guidance-on-the-use-of-ai-models-in-drug-and-biological-product-development/]
- 58. What are Contexts of Use? — updated 2025 | IxDF [https://www.interaction-design.org/literature/topics/contexts-of-use?srsltid=AfmBOopR57eREXnwRC1VG76dMNR6duYJp2Tz2gwxRnFyAiLPhyr1-TCN]
- 59. in Silico Tools [https://www.vegahub.eu/portfolio-types/in-silico-tools/]
- 60. In Silico Technologies: Leading the Future of Drug ... [https://globalforum.diaglobal.org/issue/october-2024/in-silico-technologies-leading-the-future-of-drug-development-breakthroughs/]
- 61. Human In Silico Drug Trials Demonstrate Higher Accuracy ... [https://pmc.ncbi.nlm.nih.gov/articles/PMC5601077/]
- 62. In silico environmental chemical science: properties and ... [https://pubs.rsc.org/en/content/articlehtml/2017/em/c7em00053g]
- 63. On the use of in-silico simulations to support experimental ... [https://pmc.ncbi.nlm.nih.gov/articles/PMC6711534/]
- 64. Enhancing Sustainable Analytical Chemistry in Liquid ... [https://pmc.ncbi.nlm.nih.gov/articles/PMC11243568/]
- 65. Sustainability and New Modality Therapeutics: An HPLC ... [https://www.chromatographyonline.com/view/sustainability-and-new-modality-therapeutics-an-hplc-2025-interview-with-paul-ferguson]