In Silico Machine Learning for PAH Detection in Soil: A New Paradigm for Environmental Monitoring and Public Health
This article explores the transformative potential of in silico machine learning (ML) for detecting polycyclic aromatic hydrocarbons (PAHs) in contaminated soil, a critical challenge for environmental and public health.
In Silico Machine Learning for PAH Detection in Soil: A New Paradigm for Environmental Monitoring and Public Health
Abstract
This article explores the transformative potential of in silico machine learning (ML) for detecting polycyclic aromatic hydrocarbons (PAHs) in contaminated soil, a critical challenge for environmental and public health. We first establish the foundational principles, detailing the health risks of PAHs and the limitations of traditional detection methods. The core of the discussion focuses on a groundbreaking methodology that integrates density functional theory (DFT) to generate in silico spectral libraries with novel ML algorithms for robust analyte identification, even without physical reference samples. We further address key troubleshooting and optimization strategies for handling complex soil matrices and data limitations. Finally, the article provides a comparative analysis of this approach against conventional techniques, validating its superior accuracy and generalizability. This synthesis is tailored for researchers, scientists, and drug development professionals seeking advanced, computational solutions for environmental contaminant analysis.
Understanding PAHs and the Limitations of Conventional Soil Analysis
Polycyclic Aromatic Hydrocarbons (PAHs) constitute a large class of hazardous chemical compounds formed during the incomplete combustion or pyrolysis of organic materials such as coal, oil, gas, wood, garbage, tobacco, and charbroiled meat [1]. These persistent environmental pollutants contain two or more fused benzene rings arranged in various structural configurations, with over 100 different varieties identified in the environment [2]. Their unique molecular structure provides exceptional thermal stability and resistance to degradation, allowing them to persist in environmental media and bioaccumulate through the food chain [2]. The public health burden of PAH exposure is substantial, with these compounds linked to increased cancer risk, developmental abnormalities, cardiovascular disorders, and other serious health conditions through mutagenic, carcinogenic, and teratogenic mechanisms [3] [4].
The environmental persistence and widespread distribution of PAHs create complex exposure pathways that complicate public health interventions. PAHs enter the environment primarily through volcanic eruptions, forest fires, residential wood burning, vehicle emissions, and industrial processes [1]. Once released, their hydrophobic nature and strong adsorption to particulate matter facilitate long-range atmospheric transport before deposition into terrestrial and aquatic ecosystems through rainfall or particle settling [5] [1]. This environmental mobility, combined with their lipophilic character that promotes bioaccumulation in fatty tissues, means that PAH body burdens among exposed individuals can be considerably higher than background environmental concentrations would suggest [5].
Molecular Mechanisms of PAH Toxicity
Metabolic Activation and DNA Adduct Formation
The toxicity of PAHs depends not on the parent compounds themselves but on their metabolic activation into reactive intermediates. The primary mechanism of PAH-induced carcinogenesis involves metabolic transformation into electrophilic species that form stable DNA adducts, leading to mutations during cell replication if unrepaired [5] [6].
The cytochrome P450 enzyme system, particularly the CYP1A1 isoenzyme, serves as the primary biological activator for many PAHs including benzo[a]pyrene [6]. This metabolic pathway proceeds through a series of oxidative steps that ultimately generate diol epoxides—the ultimate DNA-reactive metabolites responsible for PAH carcinogenicity [5]. These highly reactive intermediates form covalent bonds with DNA nucleobases, particularly guanine residues, creating bulky DNA adducts that distort the DNA helix and interfere with normal replication and transcription [6].
The "bay region theory" predicts that epoxides located in the sterically hindered bay region of PAH molecules (the space between aromatic rings) exhibit particularly high reactivity and mutagenic potential [6]. This structural feature explains the variable carcinogenic potency among different PAHs, with compounds containing exposed bay regions generally demonstrating greater carcinogenic activity.
Figure 1: PAH Metabolic Activation Pathway. This diagram illustrates the sequential metabolic activation of PAHs to DNA-binding diol epoxides, a key mechanism in PAH-induced carcinogenesis.
Mutagenic Consequences and Oncogene Activation
PAH-DNA adducts initiate carcinogenesis through mutagenic events at critical genomic loci regulating cell growth and differentiation. When these adducts form at sites controlling cell replication and remain unrepaired before cell division, they can cause permanent genetic mutations that disrupt normal cellular growth controls [6]. Cells with rapid replicative turnover—such as those in bone marrow, skin, and lung tissue—appear most vulnerable to these mutagenic effects [6].
Substantial evidence links PAH exposure to specific mutational signatures in cancer-associated genes. Anti-benzo[a]pyrene-7,8-diol-9,10-oxide-deoxyguanosine adducts have been directly measured in populations with high PAH exposure, including coke-oven workers and chimney sweeps [5]. These adducts produce characteristic G→T transversions in the K-ras proto-oncogene in lung tumors from benzo[a]pyrene-treated mice, and similar mutations have been identified in the TP53 tumor suppressor gene in human lung cancers among non-smokers exposed to PAH-rich coal combustion products [5]. Multiple animal studies have further implicated the ras oncogene in PAH tumor induction, confirming the role of specific genetic alterations in PAH-mediated carcinogenesis [6].
Expanding Beyond Priority PAHs: A Complex Toxicological Landscape
Limitations of the Priority PAH Framework
While regulatory focus has historically centered on the 16 EPA priority PAHs, emerging evidence indicates that this framework insufficiently captures the full spectrum of PAH-related health risks. The original priority list was established based on occurrence in contaminated sites and suspected carcinogenic potential, but has never been updated despite substantial toxicological advances [3]. This regulatory stagnation means that numerous non-priority PAHs with significant toxic potential remain unmonitored in environmental and public health surveillance programs.
Recent systematic reviews reveal that several non-priority PAHs demonstrate genotoxic and carcinogenic properties comparable to or exceeding those of recognized priority compounds. Specifically, 5-methylchrysene (5-MC), 7,12-dimethylbenz[a]anthracene (7,12-DMBA), benz[j]aceanthrylene (B[j]A), cyclopenta[cd]pyrene (CPP), anthanthrene (ANT), dibenzo[ae]pyrene (Db[ae]P), and dibenzo[al]pyrene (Db[al]P) have all been reported to cause significant mutagenic effects and are associated with carcinogenicity risk [3]. Similarly, simpler PAHs like retene (RET) and benzo[c]fluorene (B[c]F) show evidence of strong mutagenic and carcinogenic potential despite limited study [3].
Table 1: Carcinogenicity Classification of Selected PAHs by IARC
| PAH Compound | IARC Classification | Key Toxicological Evidence |
|---|---|---|
| Benzo[a]pyrene | Group 1 (Carcinogenic to humans) | Sufficient evidence in humans and animals; DNA adduct formation measured in exposed populations [5] |
| Cyclopenta[cd]pyrene, Dibenz[a,h]anthracene, Dibenzo[a,l]pyrene | Group 2A (Probably carcinogenic to humans) | Strong mechanistic evidence supporting carcinogenicity [5] |
| Benz[a]anthracene, Benzo[b]fluoranthene, Benzo[j]fluoranthene, Benzo[k]fluoranthene, Chrysene, Indeno[1,2,3-cd]pyrene | Group 2B (Possibly carcinogenic to humans) | Limited evidence in humans, sufficient evidence in experimental animals [5] |
| 45 other PAHs including fluoranthene, fluorene, phenanthrene | Group 3 (Not classifiable) | Inadequate or limited experimental evidence [5] |
Regional Vulnerabilities and Exposure Disparities
The public health impact of PAH exposure demonstrates significant geographic variation reflecting regional differences in pollution sources, industrial practices, dietary patterns, and regulatory frameworks. East Africa exemplifies this disparity, where rapid urbanization, industrial growth, and increasing reliance on biomass fuels contribute to elevated environmental PAH levels without corresponding monitoring or regulatory capacity [4]. This region remains substantially underrepresented in global PAH risk assessments, creating critical knowledge gaps that impede evidence-based public health interventions [4].
Vulnerable populations in developing regions face particularly heightened risks due to multiple exposure pathways and limited mitigation resources. Biomass and fossil fuel combustion for cooking and heating, urban air pollution from unregulated industries, occupational hazards in informal sectors, and dietary intake from traditionally processed foods all contribute to cumulative PAH exposure [4]. Among these populations, women, children, and low-income urban dwellers experience disproportionate exposure burdens, resulting in increased incidence of respiratory diseases, cardiovascular disorders, cancer, adverse birth outcomes, and neurodevelopmental impairments [4].
Quantitative Risk Assessment: Exposure Pathways and Body Burdens
Comparative PAH Concentrations in Environmental Media and Food
Environmental monitoring data reveals substantial variation in PAH concentrations across different media and geographic regions. Understanding these exposure gradients is essential for targeted public health interventions and evidence-based regulatory policy.
Table 2: PAH Concentrations in Environmental and Food Matrices
| Matrix Category | Specific Sample | Location | PAH Concentration | Reference |
|---|---|---|---|---|
| Air | Rural areas | Background levels | 0.02-1.2 ng/m³ | [1] |
| Urban areas | Background levels | 0.15-19.3 ng/m³ | [1] | |
| Water | Drinking water | United States | 4-24 ng/L | [1] |
| Food (Raw) | Raw fish | Sweden | <0.03 μg/kg B[a]p | [2] |
| Raw meat | Average | 0.04 μg/kg B[a]p | [2] | |
| Food (Processed) | Smoked meat | Sweden (1999-2010) | 6.6-36.9 μg/kg B[a]p | [2] |
| Smoked fish | Sub-Saharan Africa | 310.1-310.2 ng/g PAH16 | [2] | |
| Vegetables | Various | Shanghai, China | 205.1 ng/g | [2] |
| Various | Northwestern Pakistan | 103.6 ng/g PAH16 | [2] |
Occupational Exposure and Body Burden Implications
Workers in specific industries face disproportionately high PAH exposure through both inhalation and dermal pathways. Industrial processes involving coal pyrolysis or combustion—including coal-tar production plants, coking plants, bitumen production plants, coal-gasification sites, smokehouses, aluminum production plants, and municipal waste incinerators—represent major sources of occupational PAH exposure [5]. Monitoring studies demonstrate that chimney sweeps performing "black work" encounter variable PAH concentrations depending on fuel type, with solid fuels generating highest exposures [5].
Critically, dermal uptake contributes substantially to internal PAH dose among occupationally exposed workers. Research in the creosote industry found that total internal PAH burden did not correlate exclusively with inhalation exposure, indicating significant percutaneous absorption [5]. This exposure pathway remains frequently overlooked in occupational safety frameworks despite its substantial contribution to overall body burden.
In Silico Machine Learning Approaches for PAH Detection and Risk Assessment
Analytical Challenges in PAH Monitoring
Traditional PAH detection methods face significant limitations that impede comprehensive environmental monitoring and accurate risk assessment. Conventional approaches require advanced laboratory infrastructure, reference standards for each target compound, and extensive sample preparation—constraints that particularly affect monitoring capacity in resource-limited regions [7] [8]. For many environmentally transformed PAH derivatives, reference standards are commercially unavailable or synthetically inaccessible, creating critical analytical blind spots [7].
The chemical complexity of soil organic matter further complicates PAH detection, as target compounds represent minute fractions within intricate molecular mixtures [7]. This complexity is compounded by environmental transformation processes that generate structurally modified derivatives with potentially altered toxicological properties. These analytical challenges have historically restricted environmental monitoring to a narrow subset of well-characterized parent PAHs, despite evidence that numerous unmonitored compounds and derivatives contribute significantly to overall health risk [3].
Integrated Machine Learning and Computational Spectroscopy
Novel analytical strategies combining surface-enhanced Raman spectroscopy (SERS) with machine learning algorithms address critical gaps in traditional PAH monitoring approaches. This integrated methodology uses computational spectroscopy to generate theoretical reference data for compounds lacking experimental standards [7] [8].
The foundational innovation involves using density functional theory (DFT)—a computational modeling approach that predicts molecular behavior based on quantum mechanics—to calculate theoretical Raman spectra for a comprehensive range of PAHs and their derivatives [7] [8]. This generates an in silico spectral library encompassing compounds that have never been isolated or synthesized in laboratory settings. The theoretical spectra show strong similarity values (>0.6) with experimental measurements for multiple PAHs, validating this computational approach [7].
Figure 2: Machine Learning-Enabled PAH Detection Workflow. This diagram outlines the integrated computational and analytical approach for identifying PAHs in environmental samples without experimental reference standards.
Physics-Informed Machine Learning Pipeline
The detection methodology employs a specialized machine learning pipeline incorporating domain knowledge of molecular physics and spectroscopy. This two-stage analytical approach significantly enhances detection capability for previously unidentifiable PAHs.
The first stage applies the Characteristic Peak Extraction (CaPE) algorithm, which isolates distinctive spectral features from complex experimental data while filtering background interference and noise [7]. This feature selection step critically enhances signal-to-noise ratio in environmentally derived samples with complex matrices.
The second stage employs the Characteristic Peak Similarity (CaPSim) algorithm to identify target analytes by matching extracted features against the DFT-calculated spectral library [7]. This matching approach demonstrates robustness to spectral shifts and amplitude variations that frequently complicate environmental sample analysis. Validation studies confirm the method reliably detects minute PAH traces in soil samples from restored watersheds and natural areas, demonstrating sensitivity comparable to conventional techniques while eliminating the reference standard requirement [7] [8].
Experimental Protocols and Research Toolkit
Protocol: Machine Learning-Enabled PAH Detection in Soil Samples
Principle: This protocol details the integrated analytical and computational method for identifying PAHs in soil samples without experimental reference standards, combining surface-enhanced Raman spectroscopy with physics-informed machine learning algorithms.
Materials and Equipment:
- Soil sampling equipment (sterile corers, containers)
- Raman spectrometer with surface-enhanced capability
- Nanoshell substrates for signal enhancement
- High-performance computing resources
- DFT calculation software (e.g., Gaussian, ORCA)
- Machine learning pipeline implementation
Procedure:
- Sample Collection and Preparation:
- Collect soil samples using sterile techniques to prevent cross-contamination
- Air-dry samples at room temperature and homogenize using ceramic mortar and pestle
- Sieve through 2-mm mesh to remove debris and large particulates
- Store prepared samples in airtight containers at -20°C until analysis
SERS Analysis:
- Deposit 10-20 mg of prepared soil sample onto nanoshell substrates
- Acquire Raman spectra using 785 nm laser excitation with 5-second integration time
- Collect triplicate spectra from different sample regions to ensure representativeness
- Perform background subtraction and cosmic ray removal using instrument software
Computational Spectral Library Generation:
- Obtain molecular structures for target PAHs from databases (PubChem, NIST)
- Perform geometry optimization using DFT with B3LYP functional and 6-311+G(d,p) basis set
- Calculate theoretical Raman spectra using identical computational parameters
- Compile results into searchable spectral database with associated metadata
Machine Learning Analysis:
- Apply CaPE algorithm to isolate characteristic spectral peaks from experimental data
- Implement CaPSim algorithm to compare extracted features against theoretical library
- Establish similarity threshold (>0.6) for positive identifications based on validation studies
- Generate confidence metrics for each identification based on spectral match quality
Validation and Quality Control:
- Analyze reference standards for available PAHs to validate computational predictions
- Perform spike-and-recovery experiments to determine method accuracy and precision
- Include procedural blanks to identify potential contamination sources
- Analyze certified reference materials when available to verify overall method performance
Applications: This protocol enables comprehensive PAH profiling in environmental samples, including detection of previously unmonitored compounds and transformed derivatives. The approach is particularly valuable for preliminary risk assessment at contaminated sites, temporal monitoring of remediation effectiveness, and identification of emerging contaminants of concern.
Protocol: Assessing PAH Effects on Environmental Bacterial Communities
Principle: This protocol uses machine learning approaches to evaluate the impact of PAH contamination on bacterial community structure and identify potential biomarkers of exposure and degradation capacity.
Materials and Equipment:
- Soil, sediment, or water sampling equipment
- DNA extraction kits for environmental samples
- 16S rRNA gene sequencing capabilities
- High-performance computing resources
- Machine learning environment (Python/R with scikit-learn, XGBoost)
Procedure:
- Sample Collection and DNA Extraction:
- Collect triplicate samples from PAH-contaminated and reference sites
- Extract genomic DNA using commercial kits optimized for environmental samples
- Quantify DNA yield and quality using spectrophotometry and gel electrophoresis
16S rRNA Gene Sequencing:
- Amplify V3-V4 hypervariable regions using primer sets 338F/806R
- Perform paired-end sequencing on Illumina platform (or equivalent)
- Process raw sequences through quality filtering, chimera removal, and OTU clustering
- Assign taxonomy using reference databases (SILVA, Greengenes)
Data Preprocessing for Machine Learning:
- Normalize sequence counts using rarefaction or proportional transformation
- Perform feature selection to identify taxa with highest variance
- Split data into training (70%) and validation (30%) sets
- Apply data augmentation techniques to address class imbalance if present
Machine Learning Model Development:
- Implement four algorithm types: Random Forest, Support Vector Machine, Logistic Regression, and XGBoost
- Optimize hyperparameters using grid search with cross-validation
- Train models to distinguish PAH-contaminated from reference samples
- Evaluate model performance using accuracy, precision, recall, and F1-score
Biomarker Identification and Validation:
- Extract feature importance metrics from trained models
- Identify potential PAH-degrading taxa based on enrichment patterns
- Validate biomarkers through correlation with PAH concentration measurements
- Perform functional prediction analysis to infer metabolic potential
Applications: This protocol enables identification of microbial biomarkers for PAH contamination, provides insights into natural attenuation potential, and guides development of bioremediation strategies. The approach can be adapted for monitoring remediation effectiveness and assessing ecosystem recovery.
The Scientist's Toolkit: Essential Research Reagents and Materials
Table 3: Key Research Reagents and Materials for PAH Studies
| Item | Function/Application | Specifications/Alternatives |
|---|---|---|
| SERS Nanoshell Substrates | Enhancement of Raman signals for detection of trace PAHs | Gold-coated silica nanoparticles; Alternative: Silver colloids |
| DFT Computational Software | Prediction of theoretical Raman spectra for library development | Gaussian, ORCA, VASP; Alternative: Open-source packages (PSI4) |
| 16S rRNA Primers | Amplification of bacterial gene sequences for community analysis | 338F/806R primer set; Alternative: Earth Microbiome Project primers |
| DNA Extraction Kits | Isolation of microbial DNA from complex environmental matrices | MoBio PowerSoil Kit; Alternative: CTAB-based manual methods |
| PAH Reference Standards | Method validation and calibration | Certified reference materials from NIST; Alternative: Commercial suppliers |
| C18 Solid-Phase Extraction | Pre-concentration and cleanup of PAHs from environmental extracts | 500 mg cartridges; Alternative: Gel permeation chromatography |
| Machine Learning Frameworks | Implementation of classification and feature selection algorithms | Scikit-learn, TensorFlow; Alternative: R with caret package |
The carcinogenic and mutagenic risks posed by PAHs represent a significant and evolving public health challenge requiring sophisticated scientific approaches. The integration of machine learning with advanced analytical methods enables unprecedented capability to detect previously unmonitored compounds and transformation products, moving beyond the limited scope of traditional priority lists. This comprehensive detection capacity is essential for accurate risk assessment and targeted public health interventions.
Addressing the public health imperative of PAH exposure demands multidisciplinary strategies that combine cutting-edge detection technologies with traditional toxicological approaches, regulatory policy, and public health practice. Future directions should prioritize the expansion of computational spectral libraries, validation of non-priority PAH toxicity, development of rapid field-deployable sensors, and implementation of environmental monitoring programs that reflect the full spectrum of hazardous PAHs in the environment. Such integrated approaches will enable more effective protection of vulnerable populations and ecosystems from the diverse health risks posed by these pervasive environmental contaminants.
The accurate detection and identification of polycyclic aromatic hydrocarbons (PAHs) in contaminated soil represents a significant analytical challenge for environmental scientists. The complexity arises from two primary sources: the intricate chemical nature of soil organic matter (SOM) and the presence of numerous unstudied PAH derivatives that form through environmental transformations. Soil organic matter constitutes one of the most complex natural biomaterials on Earth, creating a matrix that can interfere with analytical techniques and mask the presence of target contaminants [7]. This complexity is compounded by the fact that PAHs undergo transformations in the environment, generating derivatives including oxygenated PAHs (OPAHs), nitrated PAHs (NPAHs), and methylated PAHs (MPAHs) that often remain undetected by conventional analytical methods [9].
The limitation of traditional approaches is evident in their reliance on experimental reference standards, which are unavailable for many environmentally transformed PAH derivatives [7]. This critical gap in our analytical capabilities has substantial implications for risk assessment, as these unstudied derivatives may pose significant toxicological threats. Research has demonstrated that some NPAHs and OPAHs are classified as known mutagens and/or possible or probable human carcinogens [9]. Zebrafish developmental toxicity tests have further indicated that fractions where NPAHs and OPAHs eluted produced the most significant adverse effects, highlighting the toxicological relevance of these often-overlooked compounds [9].
Current Analytical Limitations and the Need for Advanced Methods
The Challenge of Soil Organic Matter
Soil organic matter creates a complex analytical matrix due to its heterogeneous composition, varying from freshly decomposed plant material to highly stable humic substances. This complexity results in several analytical complications:
- Spectral Interference: The diverse molecular components of SOM produce overlapping spectral signatures that can obscure the detection of target PAHs and their derivatives.
- Sorption Effects: The strong affinity of PAHs for organic carbon in soil matrices makes complete extraction difficult, potentially leading to underestimation of contaminant concentrations [10].
- Matrix Effects: Co-extracted organic compounds can interfere with instrumental analysis, affecting quantification accuracy and method sensitivity.
Limitations in Traditional PAH Analysis
Conventional approaches to PAH analysis face substantial limitations when addressing the full spectrum of contaminants:
- Targeted Analysis Focus: Most standard methods target only 16 EPA priority PAHs, missing numerous derivatives that can constitute up to 38.7% of the calculated carcinogenic equivalent (B[a]Peq) concentrations [9].
- Reference Standard Dependency: Traditional detection methods, including gas chromatography-mass spectrometry (GC-MS), require authentic chemical standards for compound identification, which are commercially unavailable for many transformed PAHs [7].
- Inadequate Extraction Techniques: Traditional extraction methods like Soxhlet extraction consume large solvent volumes and longer extraction times while potentially missing tightly bound PAH derivatives [10].
Table 1: Categories of PAHs and Their Derivatives Often Missed in Conventional Analysis
| Compound Category | Examples | Analytical Challenges | Toxicological Significance |
|---|---|---|---|
| Unsubstituted PAHs | Benzo[a]pyrene, Chrysene | Standard in targeted methods | Known carcinogens, included in risk assessment |
| High Molecular Weight PAHs (MW302) | Dibenzo[a,e]fluoranthene, Dibenzo[a,i]pyrene | High molecular weight, low solubility | 4.1-38.7% increase in B[a]Peq when included [9] |
| Oxygenated PAHs (OPAHs) | 9-Fluorenone, 9,10-Anthraquinone | Formed through photochemical transformation | Significant adverse effects in zebrafish tests [9] |
| Nitrated PAHs (NPAHs) | 1-Nitronaphthalene, 3-Nitrobiphenyl | Lack of reference standards | Known mutagens, possible human carcinogens [9] |
| Heterocyclic PAHs | Dibenzofuran, Carbazole | Nitrogen, oxygen, or sulfur in ring structure | Estrogenic activity and ecotoxicity [9] |
In Silico Machine Learning-Enabled Solutions
Theoretical Foundation and Workflow
A groundbreaking approach that combines surface-enhanced Raman spectroscopy (SERS) with in silico spectral prediction and machine learning algorithms has recently been developed to overcome the limitations of traditional PAH analysis [7] [8]. This methodology creates a virtual library of "chemical fingerprints" for PAHs and their derivatives using density functional theory (DFT) calculations to predict molecular spectra based on molecular structure, eliminating the dependency on physical reference standards [7].
The analytical workflow operates through a physics-informed machine learning pipeline consisting of two specialized algorithms:
- Characteristic Peak Extraction (CaPE): This algorithm isolates distinctive spectral features from the complex background of soil organic matter, effectively separating target compound signatures from matrix interference.
- Characteristic Peak Similarity (CaPSim): This complementary algorithm identifies analytes with high robustness to spectral shifts and amplitude variations, enabling recognition of compounds even when their spectral signatures have been modified by environmental transformations [7].
Experimental Validation and Performance
Validation studies have demonstrated strong similarity values (>0.6) between DFT-calculated and experimental Surface-Enhanced Raman Spectra for multiple PAHs, confirming the accuracy and discriminative capability of this approach [7]. The method has been successfully tested on soil from a restored watershed and natural area using both artificially contaminated samples and control samples, with results showing reliable detection of minute PAH traces through a simpler and faster process than conventional techniques [8].
The machine learning component enables the system to identify compounds that have undergone environmental transformations, effectively addressing the "aging" problem in soil contamination. As one researcher explained, "You can imagine we have a picture of a person when they're a teenager, but now they're in their 30s. On the theory side, we can predict what the picture will look like" [8]. This capability is particularly valuable for detecting PAH derivatives that form through photochemical and biological processes after environmental release.
Comparative Analytical Methods for PAH Detection
Traditional vs. Advanced Approaches
Table 2: Comparison of PAH Analytical Methods for Complex Soil Matrices
| Method | Principles | Advantages | Limitations | Suitable for Unstudied Derivatives? |
|---|---|---|---|---|
| GC-MS | Separation by volatility, mass detection | High sensitivity for target compounds, quantitative | Requires reference standards, misses unknown compounds | No - limited to compounds with available standards |
| SFE-GC-MS | Supercritical fluid extraction, GC-MS analysis | Reduced solvent use, faster extraction | Limited to extractable compounds, matrix effects | Limited - still requires standards for identification |
| MAE with HPLC-FLD | Microwave-assisted extraction, HPLC with fluorescence | Efficient extraction, selective for aromatic compounds | Limited compound range, interference from SOM | Limited - target-specific detection only |
| In Silico ML-SERS (Novel) | SERS with DFT-calculated spectra and ML algorithms | No reference standards needed, identifies unknown derivatives | Emerging technology, requires validation | Yes - specifically designed for unknown derivatives |
Protocol: In Silico ML-Enabled PAH Detection in Soil
Sample Preparation and SERS Analysis
Materials:
- Surface-enhanced Raman spectroscopy system with nanoshell substrates
- Soil sampling equipment (corer, spatula)
- Sieve (2 mm mesh)
- Portable balance (±0.001 g precision)
- DFT computational software (Gaussian, ORCA, or similar)
- Machine learning algorithms (CaPE and CaPSim)
Procedure:
- Soil Collection and Preparation:
- Collect soil samples using a stainless-steel corer from 0-10 cm depth at multiple locations within the study area.
- Air-dry samples at room temperature (20-25°C) for 48 hours.
- Homogenize and sieve through a 2 mm mesh to remove large debris and stones.
- Store prepared samples in sealed glass containers at 4°C until analysis.
SERS Substrate Preparation:
- Utilize signature nanoshells designed to enhance relevant traits in the spectra [8].
- Apply 100 μL of soil extract (prepared with hexane:acetone 1:1 v/v) to the SERS substrate.
- Allow solvent to evaporate completely under a gentle nitrogen stream.
Spectral Acquisition:
- Acquire Raman spectra using a laser excitation source at 785 nm to minimize fluorescence interference.
- Collect spectra across the range of 500-2000 cm⁻¹ with 5-second integration time.
- Perform triplicate measurements for each sample to ensure reproducibility.
In Silico Spectral Library Generation
Procedure:
- Molecular Structure Optimization:
- Obtain molecular structures of target PAHs and potential derivatives from databases (PubChem, NIST).
- Perform geometry optimization using density functional theory with B3LYP functional and 6-311+G(d,p) basis set.
- Raman Spectrum Calculation:
- Calculate theoretical Raman spectra for each optimized structure using the same DFT method.
- Apply appropriate scaling factors (0.96-0.98) to correct for systematic errors in frequency calculations.
- Generate a comprehensive library of theoretical spectra for PAHs and their derivatives.
Machine Learning-Enabled Compound Identification
Procedure:
- Characteristic Peak Extraction (CaPE):
- Input experimental SERS spectra into the CaPE algorithm.
- The algorithm identifies and isolates distinctive spectral features while filtering out background interference from soil organic matter.
- Generate a processed spectrum containing only characteristic peaks for each sample.
Characteristic Peak Similarity (CaPSim):
- Compare processed experimental spectra against the theoretical spectral library using the CaPSim algorithm.
- The algorithm calculates similarity scores (>0.6 indicates strong match) between experimental and theoretical spectra [7].
- Identify compounds present in the soil sample based on similarity scores and peak alignment.
Validation and Quantification:
- For compounds with available standards, validate identification with traditional GC-MS.
- Apply semi-quantitative analysis based on peak intensity correlation with concentration.
- Generate a comprehensive report of identified PAHs and derivatives with confidence scores.
The Scientist's Toolkit: Essential Research Reagents and Materials
Table 3: Key Research Reagents and Materials for Advanced PAH Analysis
| Item | Function | Application Notes |
|---|---|---|
| SERS Nanoshell Substrates | Enhancement of Raman signals for sensitive detection | Gold-coated silica nanoshells provide tunable plasmon resonance [8] |
| DFT Computational Software | Prediction of theoretical Raman spectra | Gaussian, ORCA, or similar packages for quantum chemical calculations |
| Characteristic Peak Extraction Algorithm | Isolation of distinctive spectral features from complex backgrounds | Machine learning algorithm that filters SOM interference [7] |
| Characteristic Peak Similarity Algorithm | Matching experimental and theoretical spectra | ML algorithm robust to spectral shifts and amplitude variations [7] |
| Hexane:Acetone (1:1 v/v) | Extraction of PAHs from soil matrices | Effective for both low and high molecular weight PAHs [10] |
| Reference PAH Standards | Method validation and quantification | Required for initial validation of novel approach |
| Portable Raman Spectrometer | Field-based spectral acquisition | Enables on-site analysis when integrated with ML algorithms [8] |
Implications and Future Directions
The integration of in silico spectroscopy with machine learning detection represents a paradigm shift in environmental contaminant analysis. This approach directly addresses the critical challenge of identifying unknown PAH derivatives in complex soil matrices without dependency on reference standards [7]. The methodology has significant implications for environmental monitoring, risk assessment, and remediation validation.
Future developments in this field will likely focus on expanding the theoretical spectral library to encompass an even broader range of potential PAH derivatives and adapting the approach for on-site field testing. As noted by researchers, "In the future, the method could enable on-site field testing by integrating the ML algorithms and theoretical spectral library with portable Raman devices into a mobile system" [8]. This advancement would make sophisticated contaminant analysis accessible to a wider range of stakeholders, including farmers, communities, and environmental agencies, potentially transforming how we monitor and manage soil contamination.
Furthermore, this analytical framework extends beyond PAH detection, offering a template for addressing similar challenges with other classes of emerging contaminants in complex environmental matrices. The combination of theoretical prediction and machine learning-enabled detection represents a powerful new paradigm in environmental analytical chemistry that can keep pace with the rapidly expanding universe of chemical contaminants of concern.
For decades, environmental monitoring of polycyclic aromatic hydrocarbons (PAHs) has relied heavily on the list of 16 priority pollutants established by the U.S. Environmental Protection Agency (EPA) in the 1970s [11]. These 16 EPA PAHs have served as valuable proxies, enabling standardized risk assessment across different laboratories and environmental samples worldwide [11]. However, this limited list represents only a tiny fraction of the thousands of polycyclic aromatic compounds (PACs) present in contaminated environments, creating significant blind spots in environmental risk assessment and remediation [11] [12]. The original selection criteria prioritized compounds with available analytical standards and known toxicity profiles, necessarily excluding numerous other hazardous compounds that occur in environmental samples [11].
The inherent limitations of focusing solely on the 16 EPA PAHs have become increasingly apparent. Traditional analytical methods such as gas chromatography and mass spectrometry, while highly accurate for targeted compounds, are labor-intensive, time-consuming, and require large amounts of organic solvents [13]. More critically, these conventional approaches fail to account for the complex mixture of PACs present in real-world samples, including alkylated PAHs, oxygenated PAHs (oxy-PAHs), nitrogen-containing heterocyclics (N-PACs), and sulfur-containing analogues [11] [12]. These uncharacterized compounds may exhibit significant toxicological effects, as evidenced by studies where targeted chemical analysis explained only 35-97% of the observed aryl hydrocarbon receptor (AhR) activity in contaminated soil extracts [12]. This significant fraction of unexplained toxicity underscores the critical need for analytical approaches that can detect and characterize the vast universe of PACs beyond the conventional 16 EPA PAHs.
The In Silico Machine Learning Paradigm for Expanded PAH Detection
The emerging paradigm of in silico machine learning (ML) represents a transformative approach for detecting and characterizing the vast chemical space of PACs in contaminated soils. In silico methodologies refer to experiments and analyses performed entirely through computer simulation, leveraging computational power to model complex biological and chemical processes [14] [15]. In the context of environmental monitoring, this approach combines theoretical chemistry, advanced spectroscopy, and machine learning algorithms to overcome the limitations of traditional analytical methods.
A groundbreaking application of this paradigm combines surface-enhanced Raman spectroscopy (SERS) with computational modeling and machine learning to identify PAHs and their derivatives without requiring physical reference standards [8]. This methodology employs density functional theory—a computational modeling technique that predicts molecular behavior—to generate a virtual library of spectral "fingerprints" for thousands of PACs based solely on their molecular structures [8]. Two complementary machine learning algorithms then parse spectral data from real-world soil samples and match them against this virtual library: characteristic peak extraction identifies relevant spectral features, while characteristic peak similarity matches these features to compounds in the computational database [8].
This integrated approach effectively decouples compound identification from the availability of analytical standards, addressing a fundamental limitation in traditional methods. As noted by researchers, "This method makes it possible to identify chemicals that have not yet been isolated experimentally" [8]. The machine learning component enhances the detection system's capability to identify compounds that may have undergone environmental transformation, with the computational models predicting how molecular structures and their corresponding spectral signatures might change over time [8].
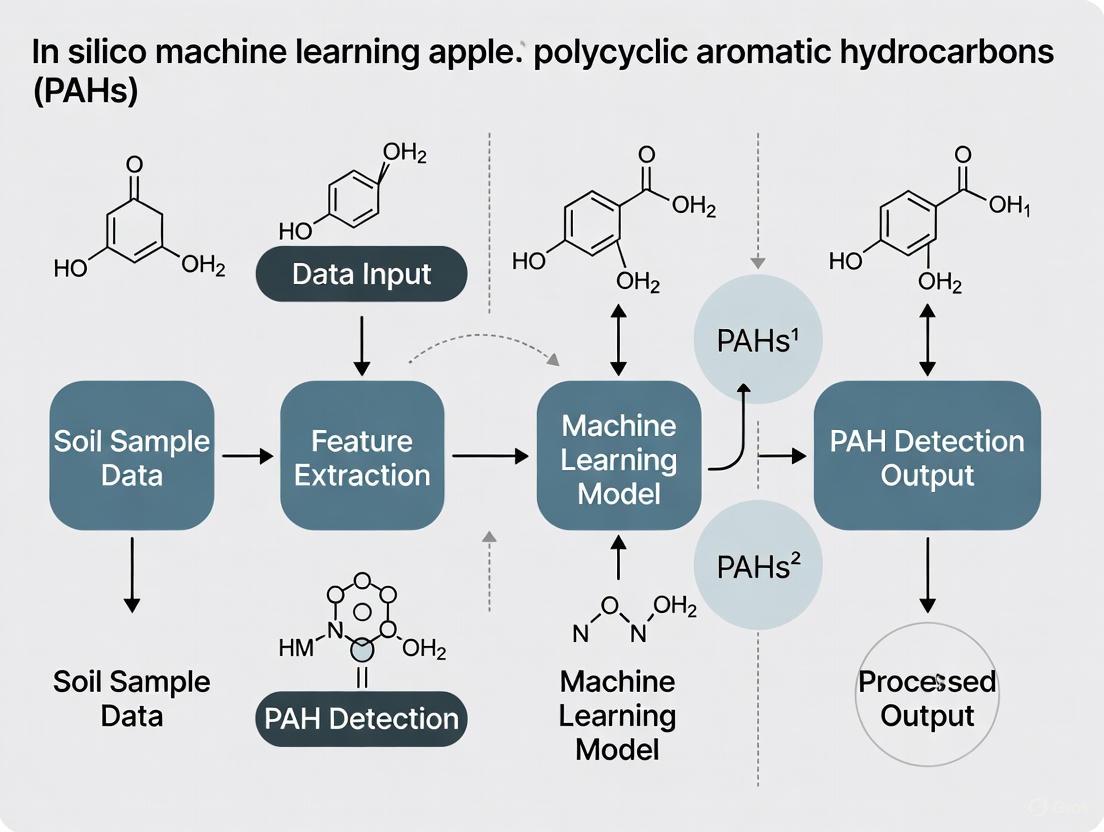
Workflow of Integrated In Silico and Machine Learning-Enabled PAH Detection
The following diagram illustrates the comprehensive workflow for detecting both characterized and uncharacterized PAHs in contaminated soil using integrated computational and machine learning approaches:
Expanded Lists of Polycyclic Aromatic Compounds for Environmental Monitoring
Research has consistently demonstrated that the 16 EPA PAHs inadequately represent the true toxicological profile of contaminated environmental samples. In response, scientists have proposed expanded lists of PACs that should be targeted in environmental monitoring programs. One significant proposal recommends a list of 40 environmental PAHs (40 EnvPAHs) that includes higher molecular weight PAHs and alkylated derivatives known to exhibit enhanced carcinogenicity and mutagenicity [11].
The following table summarizes key compounds from expanded PAH lists proposed for environmental monitoring:
Table 1: Proposed Expanded Lists of Polycyclic Aromatic Compounds for Environmental Monitoring
| Compound Category | Examples | Rationale for Inclusion | Toxicological Profile |
|---|---|---|---|
| High Molecular Weight PAHs | Benzo[j]aceanthrylene, Cyclopenta[cd]pyrene, Dibenzo[a,h]anthracene | Higher carcinogenic potential than many 16 EPA PAHs | Toxic Equivalency Factors (TEFs) up to 60 times greater than Benzo[a]pyrene [11] |
| Alkylated PAHs | 1-Methylpyrene, 5-Methylchrysene, 6-Methylbenzo[a]anthracene | Increased environmental prevalence and persistence | Some methylated chrysenes show carcinogenicity comparable to parent compounds [11] |
| Oxygenated PAHs (Oxy-PAHs) | Benz[a]anthracene-7,12-dione, Oxygenated benzo[a]pyrene derivatives | Formed through environmental transformation; exhibit direct mutagenicity | Can induce oxidative stress and demonstrate high mutagenic potential [11] |
| Nitrogen/Sulfur-containing Heterocyclics | Carbazole, Benzoquinoline, Dibenzothiophene | Common in petrogenic contamination; exhibit unique toxicological effects | Some show endocrine disruption potential and enhanced bioavailability [12] |
The need for these expanded lists is further supported by studies employing non-targeted analysis combined with bioassay testing. One comprehensive investigation of historically contaminated soil found significant contributions to overall toxicity from heterocyclic PACs and transformation products not included in standard monitoring programs [12]. Through non-targeted analysis using gas chromatography coupled with high-resolution mass spectrometry (GC-HRMS), researchers tentatively identified 114 unique candidate compounds, with 12 substances showing significant aryl hydrocarbon receptor activity meriting inclusion in future screening efforts [12].
Experimental Protocols for Comprehensive PAH Analysis
Protocol: Integrated Targeted and Non-Targeted Analysis of PACs in Soil
Principle: This protocol combines quantitative targeted analysis of known PACs with non-targeted screening to identify previously uncharacterized compounds, providing a comprehensive assessment of PAC contamination in soil samples [12].
Materials and Reagents:
- Soil samples (lyophilized and sieved to <2 mm)
- Deuterated internal standards (acenaphthene-d10, chrysene-d12, perylene-d12)
- Anhydrous sodium sulfate (pesticide grade)
- Dichloromethane, acetone, n-hexane (HPLC grade)
- Solid-phase extraction cartridges (silica, 1 g/6 mL)
- GC-MS system with electron impact ionization
- GC-HRMS system (Orbitrap technology recommended)
Procedure:
- Sample Preparation: Accurately weigh 2.0 g of lyophilized soil sample into a 40 mL vial. Spike with deuterated internal standards mixture (100 µL of 10 µg/mL solution).
- Extraction: Add 10 mL of dichloromethane:acetone (1:1, v/v) and extract using pressurized liquid extraction (100°C, 1500 psi) with three static cycles of 5 minutes each. Alternatively, perform ultrasonic extraction (3 × 30 minutes) if PLE is unavailable.
- Cleanup: Concentrate extracts to approximately 1 mL under gentle nitrogen stream. Transfer to silica SPE cartridge pre-conditioned with 5 mL n-hexane. Elute PAC fraction with 10 mL n-hexane:dichloromethane (3:7, v/v).
- Analysis:
- Targeted Analysis: Analyze 1 µL injection by GC-MS using a 30 m DB-5MS column with 0.25 mm i.d. and 0.25 µm film thickness. Use temperature program: 60°C (1 min) to 300°C at 10°C/min, hold 10 min.
- Non-Targeted Analysis: Analyze same extract by GC-HRMS using similar chromatographic conditions with full-scan acquisition (m/z 50-600 at resolution ≥60,000).
- Data Processing:
- For targeted analysis, quantify against 5-point calibration curve with internal standard correction.
- For non-targeted analysis, use software (e.g., Compound Discoverer, XCMS) for peak picking, componentization, and formula assignment.
Quality Control:
- Include procedural blanks every 10 samples
- Analyze continuing calibration verification standards every 12 samples
- Use recovery standards (deuterated PAHs) with acceptable recovery range of 70-130%
Protocol: In Silico Machine Learning-Enabled Detection of Uncharacterized PACs
Principle: This protocol uses computational chemistry to predict spectral signatures of potential PACs and machine learning to match these against experimental data from soil samples, enabling detection of compounds without analytical standards [8].
Materials and Reagents:
- Soil samples (lyophilized and sieved to <2 mm)
- Surface-enhanced Raman spectroscopy system with nanoshell substrates
- High-performance computing resources
- Density functional theory software (Gaussian, ORCA, or similar)
- Machine learning framework (Python with scikit-learn, TensorFlow, or PyTorch)
Procedure:
- Theoretical Spectral Library Generation: a. Curate molecular structures of known and potential PACs from databases (PubChem, CompTox) b. Optimize molecular geometries using density functional theory (B3LYP/6-311+G(d,p) level recommended) c. Calculate theoretical Raman spectra for each optimized structure d. Compile results into searchable spectral library
Experimental Data Acquisition: a. Prepare soil suspension in ultrapure water (1:10 w/v) b. Deposit 10 µL onto SERS substrate and dry at room temperature c. Acquire SERS spectra across multiple regions (minimum 20 spectra per sample) d. Pre-process spectra: cosmic ray removal, baseline correction, vector normalization
Machine Learning Analysis: a. Apply characteristic peak extraction algorithm to identify significant spectral features b. Use characteristic peak similarity algorithm to match experimental features against theoretical library c. Implement random forest classifier to prioritize potential matches based on spectral similarity and molecular properties d. Generate confidence scores for compound identifications
Validation: a. Compare results with GC-MS data where available b. Test method on artificially contaminated samples with known compounds c. Perform cross-validation with independent sample sets
The Scientist's Toolkit: Essential Research Reagents and Materials
Table 2: Essential Research Reagents and Materials for Comprehensive PAH Analysis
| Item | Function/Application | Technical Specifications |
|---|---|---|
| Deuterated PAH Standards | Internal standards for quantitative analysis; account for extraction efficiency and matrix effects | Acenaphthene-d10, Chrysene-d12, Perylene-d12; purity ≥98%, concentration 10-100 µg/mL in methanol [12] |
| SERS Nanoshell Substrates | Enhance Raman signals for sensitive detection of PACs; enable detection of compounds at low concentrations | Gold-silica core-shell nanoparticles; optimized for PAH adsorption; enhancement factor ≥10⁷ [8] |
| Silica SPE Cartridges | Cleanup of soil extracts; remove interfering compounds while retaining target PACs | 1 g/6 mL format; pre-conditioned with n-hexane; used with dichloromethane:hexane elution [12] |
| GC-HRMS System | Non-targeted screening and confident identification of unknown PACs | Orbitrap technology; resolution ≥60,000; mass accuracy <2 ppm; electron impact ionization source [12] |
| Density Functional Theory Software | Predict molecular structures and spectroscopic properties of potential PACs | Gaussian, ORCA, or similar; B3LYP functional; 6-311+G(d,p) basis set; vibrational frequency calculation [8] |
| Machine Learning Framework | Develop algorithms for spectral matching and compound identification | Python with scikit-learn, TensorFlow, or PyTorch; random forest, convolutional neural networks [8] |
The paradigm for detecting polycyclic aromatic compounds in contaminated soils is undergoing a fundamental transformation, moving beyond the limited scope of the 16 EPA PAHs to embrace a more comprehensive approach that acknowledges the complex chemical reality of environmental contamination. The integration of in silico methodologies with machine learning and advanced analytical techniques represents a powerful framework for addressing this challenge, enabling researchers to detect and characterize thousands of previously unmonitored compounds. This approach is not merely an incremental improvement but a fundamental shift from targeted analysis of known compounds to untargeted characterization of complex environmental mixtures.
As the field advances, the combination of computational prediction, sophisticated spectroscopy, and machine learning algorithms will continue to close the significant gap between observed toxicity and explained toxicity in environmental samples. This progress is essential for developing more accurate risk assessments and implementing more effective remediation strategies for PAH-contaminated sites worldwide. The methodologies and protocols outlined in this application note provide a roadmap for researchers to implement these advanced techniques in their own environmental monitoring programs, ultimately contributing to improved environmental and public health protection.
The detection and identification of polycyclic aromatic hydrocarbons (PAHs) and their derivatives in contaminated soil are critical for environmental health risk assessment. These compounds exhibit potent carcinogenic and mutagenic properties, posing significant threats through contact exposure, inhalation, and ingestion [16]. Traditional analytical methodologies for PAH detection face substantial limitations, primarily their fundamental reliance on commercially available physical reference standards and access to advanced laboratory infrastructure. This requirement creates a critical gap in environmental monitoring capabilities, as the vast majority of potentially hazardous PAH-derived chemicals lack experimentally derived reference data [8]. This application note details these limitations and presents a novel in silico machine learning-enabled framework that effectively bypasses these constraints, enabling comprehensive detection of known and previously unstudied soil contaminants.
Critical Limitations of Conventional Analytical Approaches
The Dependency on Physical Reference Standards
Traditional contaminant identification methods, such as gas chromatography-mass spectrometry (GC-MS), depend on direct comparison against a library of experimental spectra from purified analyte standards [16]. This poses a nearly insurmountable challenge for environmental monitoring of PAHs and polycyclic aromatic compounds (PACs) for several reasons:
- Commercially Unavailable Compounds: Thousands of potentially hazardous PACs, including environmental transformation products of parent PAHs, are not commercially available and are synthetically challenging or impossible to produce for reference purposes [16].
- Inadequate Library Coverage: Experimental spectral libraries cover only a fraction of the known environmental pollutants, leaving many compounds undetectable through traditional means [8].
- Matrix Interference: Complex soil organic matter—described as "the most complex biomaterial on our planet"—creates significant spectral background interference, complicating direct comparison with pristine reference spectra [16].
The Requirement for Advanced Laboratory Infrastructure
Conventional detection paradigms necessitate sophisticated laboratory equipment and complex procedures, limiting their practicality for widespread environmental monitoring:
- Specialized Equipment: Techniques like accelerated solvent extraction (ASE) require specialized high-temperature, high-pressure equipment that may not be accessible for field applications [16].
- Centralized Analysis: The need for advanced instrumentation typically requires sample transport to centralized laboratories, resulting in delays between sample collection and result availability [8].
- Resource Intensity: Traditional methods involve energy-intensive processes and significant operational expertise, increasing the cost and complexity of environmental monitoring programs [16].
Table 1: Quantitative Comparison of PAH Extraction Methods from Contaminated Soil
| Extraction Method | Equipment Requirements | PAH Concentration Range (μg/g) | Practical Limitations |
|---|---|---|---|
| Accelerated Solvent Extraction (ASE) | Specialized high-temperature/pressure equipment [16] | 1 to 600 [16] | Requires sophisticated, expensive instrumentation |
| Room-Temperature Filtration | Basic laboratory equipment (room temperature/pressure) [16] | 1 to 600 [16] | More accessible; results comparable to ASE |
Innovative Framework:In SilicoMachine Learning-Enabled Detection
To overcome the limitations of traditional methods, researchers have developed a novel analytical approach that integrates computational spectroscopy with machine learning. This framework eliminates the dependency on physical reference standards by creating a virtual spectral library and employs intelligent algorithms for contaminant identification in complex soil matrices [16] [8].
The methodology employs a physics-informed machine learning pipeline that operates in two distinct stages: the Characteristic Peak Extraction (CaPE) algorithm, which isolates distinctive spectral features from complex spectra, and the Characteristic Peak Similarity (CaPSim) algorithm, which identifies analytes with high robustness to spectral shifts and amplitude variations commonly encountered in environmental samples [16].
Core Technological Components
Table 2: Research Reagent Solutions for In Silico PAH Detection
| Component | Function/Description | Role in Overcoming Traditional Limitations |
|---|---|---|
| SiO₂ Core-Au Shell Nanoshells | SERS substrate with dipole plasmon resonance centered at 800 nm [16] | Enhances Raman signals for trace-level detection without complex sample preparation |
| Density Functional Theory (DFT) | Computational modeling method for predicting molecular spectra [16] [8] | Generates virtual spectral library, eliminating need for physical reference standards |
| Characteristic Peak Extraction (CaPE) | Machine learning algorithm that isolates distinctive spectral features [16] | Provides tolerance to spectral shifts and amplitude variations in complex matrices |
| Characteristic Peak Similarity (CaPSim) | ML algorithm for quantitative comparison of CaPE-processed spectra [16] | Enables matching against in silico library with high robustness |
| Acetone Extraction | Soil extraction solvent with minimal spectral interference [16] | Simplifies background compared to traditional solvents like toluene or DCM |
Experimental Protocol:In SilicoDetection of PAHs in Soil
Sample Preparation and SERS Substrate Fabrication
Materials:
- Soil samples (clay-sand mixture, e.g., 43% clay, 37% sand)
- PAH analytes (pyrene, anthracene, or custom mixtures)
- Acetone solvent (HPLC grade)
- Gold-silica nanoshells (165 ± 17 nm diameter) with dipole plasmon resonance at 800 nm
Procedure:
- Soil Contamination:
- Spike as-collected soil samples with target PAHs (PYR, ANTH, or mixtures) dissolved in acetone.
- Seal and shake the PAH-soil mixture for approximately 2 minutes to enhance absorption.
- Air-dry at room temperature until complete acetone evaporation [16].
PAH Extraction:
- Perform acetone extraction using either filtration or accelerated solvent extraction (ASE).
- For filtration: Add acetone to contaminated soil, agitate, and filter through standard filter paper.
- Note: Filtration provides comparable efficiency to ASE (1-600 μg/g range) without specialized equipment [16].
SERS Substrate Preparation:
- Deposit SiO₂ core-Au shell nanoshells onto appropriate substrate.
- Verify plasmon resonance alignment with 785 nm excitation laser [16].
Spectral Acquisition and Computational Analysis
Instrumentation:
- Raman spectrometer with 785 nm laser excitation
- SERS substrate with plasmonic nanoshells
Procedure:
- Spectral Collection:
- Deposit 20 μL of PAH extract onto SERS substrate by drop-drying.
- Collect approximately 25 spectra from different substrate regions per sample.
- Average acquired spectra to create representative spectral profile for each sample [16].
Computational Analysis:
Theoretical Library Generation:
Machine Learning Processing:
- Apply CaPE algorithm to isolate characteristic spectral features from experimental SERS data.
- Process DFT-calculated reference spectra through identical CaPE algorithm.
- Execute CaPSim analysis to quantitatively compare experimental and theoretical CaPE-processed spectra.
- Identify analytes based on similarity values (>0.6 indicates strong match) [16].
Validation:
- Method validation shows strong similarity values (>0.6) between DFT-calculated and experimental SERS spectra for multiple PAHs [16].
- The approach successfully identifies PAHs in artificially contaminated soil samples from a restored watershed [16] [8].
Significance and Applications
This integrated framework fundamentally transforms environmental monitoring capabilities by addressing the core limitations of traditional methods. The approach successfully detects both known PAHs and their previously unstudied derivatives without requiring physical reference standards [8]. The methodology has been validated on soil from a restored watershed, reliably identifying minute traces of PAHs through a simpler and faster process than conventional techniques [8].
Professor Thomas Senftle of Rice University aptly compares this innovative process to facial recognition technology: "You can imagine we have a picture of a person when they're a teenager, but now they're in their 30s. On the theory side, we can predict what the picture will look like" [8]. This powerful analogy captures the transformative potential of combining theoretical prediction with machine learning for environmental monitoring.
Future applications could integrate the machine learning algorithms and theoretical spectral library with portable Raman devices into mobile field testing systems. This would empower farmers, communities, and environmental agencies to test soil for hazardous compounds without needing to send samples to specialized laboratories and wait for results [8], truly democratizing environmental monitoring capabilities and overcoming the traditional limitations of advanced laboratory dependency.
Building the In Silico Pipeline: From Theoretical Spectra to Machine Learning Identification
Surface-Enhanced Raman Spectroscopy (SERS) is a powerful analytical technique that leverages nanostructured metallic surfaces to enhance Raman scattering signals, providing exceptional sensitivity for detecting molecules at very low concentrations, often down to single-molecule levels [17] [18]. The integration of SERS with in silico spectral libraries represents a transformative approach for detecting environmental contaminants, such as polycyclic aromatic hydrocarbons (PAHs) in soil, particularly when experimental reference data are unavailable [8] [7]. This application note details protocols and workflows for employing this combined strategy, contextualized within a research thesis focused on in silico machine learning for environmental analysis.
Traditional SERS detection relies on experimental reference spectra, which are absent for many environmentally transformed or novel pollutants, creating a "dark chemical space" [19]. This workflow overcomes that limitation by using density functional theory (DFT) to generate theoretical Raman spectra for target compounds, which are then used with machine learning to analyze experimental SERS data from soil samples [8] [7]. This method enables the identification of PAHs and their derivatives without physical reference standards, significantly advancing environmental monitoring capabilities [8].
The following diagram illustrates the integrated SERS and in silico workflow for detecting soil contaminants, from sample preparation to final identification.
Research Reagent Solutions and Materials
The following table details the essential materials and reagents required for the SERS analysis of PAHs in soil.
Table 1: Key Research Reagents and Materials
| Item | Function/Description | Example Specifications |
|---|---|---|
| Silver Nanoparticles (Ag NPs) | SERS-active substrate; electromagnetic field enhancement via localized surface plasmon resonance [17] [20]. | Colloidal suspension, synthesized via hydroxylamine hydrochloride reduction [21]. |
| Gold Nanoparticles (Au NPs) | Alternative SERS substrate; preferred for better chemical stability with certain lasers [20]. | Spherical, citrate-reduced colloids [21]. |
| Aggregation Agent (e.g., KNO₃) | Induces controlled nanoparticle clustering to form electromagnetic "hot spots" for signal amplification [21]. | Potassium nitrate (KNO₃), 0.5 mol/L solution [21]. |
| PAH Standards | Positive controls for method validation. | Compounds like pyrene or benzo[a]pyrene in solvent [8]. |
| Solvents | Soil extraction and dilution of analytes. | Ultrapure water (18.2 MΩ·cm), ethanol [21]. |
Experimental Protocols
Protocol 1: Preparation of SERS-Active Silver Colloid
This protocol describes the synthesis of a hydroxylamine-reduced silver colloid, optimized for SERS measurements [21].
- Reagents: Hydroxylamine hydrochloride (NH₂OH·HCl, 1.66 × 10⁻³ mol/L), Sodium hydroxide (NaOH, 1.0 mol/L), Silver nitrate (AgNO₃, 1.0 × 10⁻² mol/L), Ultrapure water.
- Procedure:
- Add 300 µL of NaOH (1.0 mol/L) to 90 mL of hydroxylamine hydrochloride solution (1.66 × 10⁻³ mol/L) under constant magnetic stirring.
- Continue stirring for 5 minutes.
- Add 10 mL of AgNO₃ solution (1.0 × 10⁻² mol/L) drop by drop to the mixture.
- Maintain agitation for 15 minutes after the final addition.
- Allow the resulting dispersion to age for at least 24 hours before use in experiments.
- Quality Control: The colloid should be characterized by UV-Vis spectroscopy to confirm a peak plasmon resonance around 400-420 nm.
Protocol 2: Soil Sample Preparation and SERS Measurement
This protocol covers the extraction of PAHs from soil and their subsequent SERS analysis using the prepared colloid.
- Reagents: Prepared Ag colloid, Potassium nitrate (KNO₃, 0.5 mol/L), Soil sample, Ethanol.
- Procedure:
- Soil Extraction: Extract PAHs from the soil matrix using a suitable solvent (e.g., ethanol or dichloromethane) via sonication or shaking. Concentrate the extract if necessary [8].
- Sample-Aggregation Mixing (Critical Step): For a 1:20 dilution of Ag colloid, mix in the following order:
- Analyte Addition: Add an aliquot of the soil extract (e.g., 100 µL) to the aggregated colloid mixture.
- SERS Measurement: Pipette the final mixture onto a glass slide or well plate. Acquire Raman spectra using a spectrometer with a 532 nm or 785 nm laser, appropriate power (e.g., 1-10 mW), and integration time (1-10 s). Collect multiple spectra from different spots to account for heterogeneity.
Protocol 3: Generation ofIn SilicoSpectral Library
This protocol outlines the computational generation of a reference spectral library using density functional theory (DFT).
- Software/Resources: Computational chemistry software (e.g., for DFT calculations), SMILES (Simplified Molecular-Input Line-Entry System) representations of target PAHs [8] [19].
- Procedure:
- Compound Selection: Curate a list of target PAHs and their potential derivatives. Obtain their canonical SMILES strings from chemical databases like PubChem [19].
- Spectral Calculation: Use DFT (e.g., at the B3LYP/6-311G level of theory) to calculate the equilibrium geometry and vibrational frequencies for each compound [8] [7].
- Library Curation: Convert the calculated vibrational frequencies into a theoretical Raman spectrum for each molecule. Compile these spectra into a searchable library format.
Machine Learning-Enabled Data Analysis
The experimental SERS data is analyzed using a specialized machine learning pipeline to match against the in silico library.
Machine Learning Pipeline and Performance
The core of the analysis uses a two-stage ML pipeline to bridge the gap between experimental data and theoretical predictions [8] [7].
Table 2: Machine Learning Pipeline Stages for SERS Data Analysis
| Stage | Algorithm/Action | Function | Key Outcome |
|---|---|---|---|
| 1. Feature Extraction | Characteristic Peak Extraction (CaPE) | Isolates distinctive, robust spectral features from the complex SERS background. | A simplified representation of the experimental spectrum, highlighting key peaks. |
| 2. Spectral Matching | Characteristic Peak Similarity (CaPSim) | Compares the extracted features against the in silico library, robust to spectral shifts and intensity variations. | A similarity score (e.g., >0.6 indicates strong match [7]) used to identify the analyte. |
The following diagram details the data analysis workflow, from raw spectral input to final identification.
Validation and Quantitative Data
This method was validated for detecting PAHs in soil, showing high reliability when compared to experimental standards [8] [7].
Table 3: Validation Metrics for In Silico SERS Approach
| Metric | Performance/Value | Context |
|---|---|---|
| Spectral Similarity Score | > 0.6 | Strong similarity between DFT-calculated and experimental SERS spectra for multiple PAHs [7]. |
| Detection Limit | Minute traces in soil | Capable of detecting low concentrations of PAHs and PACs in a complex soil matrix [8]. |
| Key Advantage | Identifies chemicals without experimental reference data | Overcomes a critical gap in environmental monitoring [8] [19]. |
The detection and analysis of polycyclic aromatic hydrocarbons (PAHs) in contaminated soil is critical for environmental monitoring and public health risk assessment. However, this task is hampered by the chemical complexity of soil organic matter, the vast number of potential PAH compounds, and the frequent lack of experimentally derived reference spectra for many toxicologically relevant PAHs and their derivatives [8] [7]. In silico approaches, which combine computational chemistry with machine learning (ML), present a powerful solution to this challenge. Central to this methodology is the use of Density Functional Theory (DFT) to generate virtual, ground-truth spectral libraries, enabling the identification of analytes without physical reference standards [8].
This application note details the protocols for employing DFT to calculate accurate fluorescence and Raman spectra for PAHs. These computationally generated spectra serve as the essential "virtual ground truth" for training machine learning models that can detect and identify PAHs in complex environmental samples like soil.
Theoretical Foundation and Key Applications
The Role of DFT inIn SilicoSpectroscopy
Density Functional Theory is a computational quantum mechanical modeling method used to investigate the electronic structure of many-body systems. In the context of spectroscopy, Time-Dependent DFT (TD-DFT) extends conventional DFT to excited states, allowing for the prediction of emission spectra [22]. This capability is fundamental for predicting optical properties, such as fluorescence and Raman activity, which are the basis for many detection techniques.
The primary application in environmental analysis is the creation of a virtual spectral library. For many PAHs, especially high molecular weight isomers and metabolic derivatives, pure standards are commercially unavailable, synthetically challenging, or prohibitively expensive [7] [22]. DFT calculations can predict the unique spectral "fingerprint" for these compounds, filling a critical gap in analytical chemistry. A recent breakthrough demonstrated that a physics-informed machine learning pipeline could use a DFT-calculated spectral library to identify PAHs in contaminated soil with high accuracy, even for compounds lacking experimental reference data [8] [7].
Quantitative Accuracy of DFT-Predicted Spectra
The utility of a virtual library depends on the accuracy of its predicted spectra. Studies have systematically evaluated this by comparing DFT-calculated spectra with high-resolution experimental data, often obtained via Shpol'skii spectroscopy at cryogenic temperatures [22].
The table below summarizes the performance of two common DFT functionals for predicting fluorescence spectra, both with and without an empirical correction:
Table 1: Accuracy of DFT-Predicted Fluorescence Spectra for PAHs
| DFT Functional | Solvent Treatment | Mean Absolute Error (Before Correction) | Mean Absolute Error (After Empirical Correction) | Key Findings |
|---|---|---|---|---|
| PBE0 | Included (n-octane) | Overestimation by 16.1 ± 6.6 nm [22] | 6.5 ± 5.1 nm [22] | Including solvent effects is crucial, shifts peaks by ~+11 nm on average [22] |
| CAM-B3LYP | Included (n-octane) | Underestimation by 14.5 ± 7.6 nm [22] | 5.7 ± 5.1 nm [22] | Effectively distinguishes structurally similar isomers (e.g., C24H14) [22] |
These results demonstrate that while systematic errors exist, empirical corrections can significantly enhance prediction accuracy, making the calculated spectra highly reliable for identifying PAHs in complex mixtures [22].
Experimental Protocols
Protocol 1: Calculating Vibrationally-Resolved Fluorescence Spectra
This protocol outlines the steps for computing high-resolution fluorescence spectra for PAHs, suitable for comparison with cryogenic spectroscopic methods.
I. Research Reagent Solutions Table 2: Essential Materials for Spectral Calculation and Validation
| Item | Function/Description |
|---|---|
| Computational Software (Gaussian) | Widely available software package that facilitates DFT and TD-DFT calculations for predicting spectra [22]. |
| n-Octane Solvent Model | A common n-alkane solvent used in Shpol'skii spectroscopy; its effects must be included in the calculation via a solvation model [22]. |
| PAH Standards (e.g., Benzo[a]pyrene) | Commercially available pure standards, essential for validating the accuracy of the computational methodology [22]. |
II. Step-by-Step Methodology
Molecular Structure Optimization:
- Begin with a initial 3D structure of the target PAH.
- Perform a ground-state geometry optimization using a functional like PBE0 or B3LYP and a basis set such as 6-31G(d). This finds the most stable arrangement of the molecule's atoms.
Excited-State Calculation:
- Using the optimized ground-state geometry, conduct a TD-DFT calculation to determine the energy and properties of the excited states. The CAM-B3LYP functional is often recommended for its improved treatment of charge-transfer excitations [22].
Inclusion of Solvent Effects:
- To accurately simulate experimental conditions, incorporate solvent effects (e.g., n-octane) using an implicit solvation model like the Polarizable Continuum Model (PCM). Neglecting this step can lead to errors, as solvent shifts peaks by an average of +11 nm [22].
Vibrational Analysis and Spectrum Generation:
- Calculate the vibrational modes for the excited state.
- Apply the Franck-Condon principle and a set of rules to identify non-negligible vibronic transitions, which allows for the construction of a vibrationally-resolved emission spectrum [22]. Modern computational packages can automate this process.
Empirical Correction (Optional):
- To maximize accuracy, apply an empirical correction factor to the entire spectrum based on validation studies using known PAH standards (see Table 1).
The following workflow diagram illustrates the core computational process:
Diagram 1: Workflow for DFT-based fluorescence spectrum calculation.
Protocol 2: Integrating DFT with Machine Learning for PAH Detection
This protocol describes how to integrate the virtual spectra from Protocol 1 into a machine learning pipeline for soil contaminant analysis, as demonstrated in recent research [8] [7].
I. Step-by-Step Methodology
Virtual Library Construction:
- Use the methods in Protocol 1 to calculate theoretical Surface-Enhanced Raman Spectroscopy (SERS) or fluorescence spectra for a wide range of PAHs and their derivatives. This forms the in silico spectral library.
Soil Sample Analysis:
- Collect a soil sample and acquire its experimental SERS spectrum using a portable spectrometer.
Machine Learning Analysis:
- Employ a two-stage ML pipeline: a. Characteristic Peak Extraction (CaPE): A machine learning algorithm isolates distinctive spectral features from the complex soil sample data, reducing background interference [8] [7]. b. Characteristic Peak Similarity (CaPSim): A second algorithm matches the extracted features against the virtual DFT library to identify the specific PAHs present. This algorithm is robust to spectral shifts and amplitude variations [8] [7].
The integration of these components is summarized below:
Diagram 2: Integration of DFT and ML for PAH detection in soil.
Troubleshooting and Optimization
- Functional Selection: If prediction errors are large, test different functionals. PBE0 may overestimate transition energies, while CAM-B3LYP may underestimate them [22]. The choice can be system-dependent.
- Handling Spectral Shifts: The consistent redshift caused by solvent effects must be accounted for. Ensure the solvation model is correctly parameterized for the solvent used in the target experimental method [22].
- Isomer Discrimination: The methodology has proven effective in distinguishing between toxic isomers (e.g., dibenzopyrenes) that are difficult to differentiate by other means. Verify calculations against any available standard for validation [22].
Density Functional Theory provides a robust and validated foundation for generating virtual ground-truth spectra for polycyclic aromatic hydrocarbons. When integrated with a modern, physics-informed machine learning pipeline, this in silico approach overcomes the critical limitation of unavailable analytical standards. The detailed protocols for spectral calculation and ML integration presented here empower researchers to accurately detect and identify a broader range of hazardous pollutants in soil, significantly advancing the capabilities of environmental monitoring and risk assessment.
The detection and identification of polycyclic aromatic hydrocarbons (PAHs) and their derivatives in complex environmental matrices like soil represents a significant challenge in analytical chemistry and environmental monitoring. These compounds, known for their toxicity and persistence, are traditionally identified by matching experimental data against libraries of reference spectra from pure, commercially available compounds. However, this approach fails for the thousands of PAH derivatives that are environmentally transformed, lack reference standards, or are challenging to synthesize. To address this critical gap, researchers have developed a novel analytical paradigm integrating in silico spectroscopy with physics-informed machine learning.
This approach centralizes around two core algorithms: Characteristic Peak Extraction (CaPE) and Characteristic Peak Similarity (CaPSim). This methodology leverages density functional theory (DFT) to computationally generate a virtual library of vibrational spectra for PAHs and polycyclic aromatic compounds (PACs). The machine learning pipeline then uses this theoretical library to identify these compounds in real-world samples, even without prior experimental reference data. This document details the application notes and experimental protocols for implementing CaPE and CaPSim, specifically within the context of detecting PAHs in contaminated soil.
Algorithmic Foundations: CaPE and CaPSim
The CaPE and CaPSim algorithms form a two-stage physics-informed machine learning pipeline designed for robust molecular identification from vibrational spectral data.
Characteristic Peak Extraction (CaPE)
The CaPE algorithm serves as the feature extraction front-end of the pipeline. Its primary function is to isolate the distinctive, analyte-specific spectral features from the complex and often noisy background of a raw surface-enhanced Raman spectroscopy (SERS) or surface-enhanced infrared absorption (SEIRA) spectrum.
- Objective: To identify and select the most representative and chemically significant peaks from a spectrum while mitigating the influence of nuisance variations such as spectral background interference, solvent effects, and instrument noise.
- Process: CaPE operates by analyzing the spectral landscape, identifying local maxima, and applying physics-based rules to distinguish true analyte signals from the background. It effectively performs a high-level "denoising" function, creating a refined set of characteristic peaks for subsequent analysis [23] [24].
Characteristic Peak Similarity (CaPSim)
The CaPSim algorithm performs the identification task. It compares the characteristic peaks isolated by CaPE against a reference library of spectra—which can include both experimental and in silico DFT-calculated spectra—to find the best match.
- Objective: To quantitatively measure the similarity between the characteristic peaks of an unknown sample and the reference spectra in the library.
- Process: The algorithm calculates a similarity value, robust to spectral shifts and amplitude variations that are common in techniques like SERS. A high similarity score (e.g., >0.6 as reported in validation studies) indicates a confident identification of the analyte [7] [24]. This robustness is key to its high performance in real-world applications.
Application Notes: In Silico ML for PAH Detection in Soil
The integration of CaPE and CaPSim with in silico spectroscopy creates a powerful tool for environmental monitoring. The following workflow diagram illustrates the complete process from soil sampling to compound identification.
Diagram 1: Workflow for in silico ML-enabled PAH detection in soil.
Key Advantages in Soil Analysis
The application of this pipeline to soil contamination analysis offers several distinct advantages over traditional methods:
- Detection of Uncharacterized Pollutants: It can identify PAH derivatives and transformed products that are not commercially available and for which no experimental reference spectra exist [7] [8]. This is critical because soil is a dynamic environment where parent PAHs can undergo chemical and microbial transformations.
- Overcoming Matrix Interference: Soil organic matter presents a highly complex chemical background. The CaPE algorithm is specifically designed to isolate analyte-specific features from such complex backgrounds [7].
- Functional Alternative to Traditional Methods: This approach provides a faster, less labor-intensive alternative to traditional techniques like gas chromatography-mass spectrometry (GC-MS), which require extensive sample preparation and are less effective for distinguishing structurally similar compounds [24].
Quantitative Performance Data
Validation studies on contaminated soil samples have demonstrated the effectiveness of this methodology. The following table summarizes key quantitative performance metrics as reported in the literature.
Table 1: Quantitative Validation Metrics for CaPE/CaPSim in PAH Detection
| Metric | Reported Value | Context / Analytes |
|---|---|---|
| Similarity Value (CaPSim) | > 0.6 | For multiple PAHs, between DFT-calculated and experimental SERS spectra [7]. |
| Distinction Capability | Clear distinction achieved | Between contaminated and control soil samples; between placentas of smokers vs. nonsmokers [23] [8]. |
| SERS Enhancement Substrate | Au Nanoshells (SiO2-Au) | Core diameter: 168 ± 10 nm; shell thickness: ~10 nm; plasmon resonance at ~800 nm [24]. |
Experimental Protocols
This section provides a detailed methodology for applying the CaPE and CaPSim pipeline to detect PAHs in soil, from sample preparation to data analysis.
Protocol 1: Soil Sample Preparation and SERS Analysis
Objective: To extract PAHs from a soil matrix and prepare them for SERS analysis to generate the experimental spectral data required for CaPE/CaPSim processing.
Materials and Reagents:
- Soil sample (e.g., from a restored watershed or natural area)
- Organic solvents (e.g., dichloromethane, acetone) for PAH extraction
- Gold nanoshell (SiO2-Au) SERS substrate [8] [24]
- Sonicator and centrifuge
- Portable Raman spectrometer with 785 nm laser excitation
Procedure:
- Soil Extraction: Weigh 1 g of homogenized soil sample. Extract PAHs using an appropriate organic solvent (e.g., 10 mL dichloromethane) via sonication for 30 minutes.
- Concentration: Centrifuge the mixture at 3000 rpm for 10 minutes to separate solid particles. Transfer the supernatant to a clean vial and concentrate the extract under a gentle stream of nitrogen gas to near dryness.
- Sample Application: Re-dissolve the concentrate in a minimal volume of solvent (e.g., 50 µL). Deposit a 5 µL aliquot of this solution onto the gold nanoshell SERS substrate and allow the solvent to evaporate completely.
- SERS Measurement: Place the substrate under the Raman spectrometer. Acquire spectra using a 785 nm laser, which aligns with the plasmon resonance of the nanoshells for maximum signal enhancement. Collect spectra from multiple random spots on the substrate to account for heterogeneity.
Protocol 2: In Silico Spectral Library Generation using DFT
Objective: To computationally generate a reference library of Raman spectra for target PAHs and their potential derivatives.
Computational Resources and Software:
- High-performance computing cluster
- Quantum chemistry software (e.g., Gaussian, ORCA) with DFT capability
Procedure:
- Molecular Structure Input: Define the initial three-dimensional molecular structure for the target PAH (e.g., Benzo[a]pyrene).
- Geometry Optimization: Perform a DFT calculation to optimize the molecular geometry to its ground-state energy configuration. A functional such as B3LYP and a basis set like 6-311G(d,p) are commonly used.
- Vibrational Frequency Calculation: Using the optimized geometry, run a frequency calculation at the same level of theory. This calculation outputs the Raman activities and vibrational wavenumbers for the molecule.
- Spectrum Simulation: Convert the computed Raman activities into a simulated spectrum by applying a line-shape function (e.g., a Lorentzian function with a specified half-width) to each vibrational frequency.
- Library Curation: Repeat steps 1-4 for all PAHs and PACs of interest to build a comprehensive in silico spectral library.
Protocol 3: ML-Enabled Spectral Analysis with CaPE and CaPSim
Objective: To process the experimental SERS spectrum through the CaPE and CaPSim pipeline to identify PAHs by matching against the in silico library.
Software and Tools:
- Custom Python or MATLAB scripts implementing the CaPE and CaPSim algorithms.
- Library of DFT-calculated spectra.
Procedure:
- Data Preprocessing: Load the raw experimental SERS spectrum. Perform baseline correction and cosmic ray removal if necessary.
- Characteristic Peak Extraction (CaPE):
- Input the preprocessed spectrum into the CaPE algorithm.
- The algorithm will analyze the spectral features and return a list of characteristic peaks, defined by their Raman shift (cm⁻¹) and intensity.
- Characteristic Peak Similarity (CaPSim):
- Input the characteristic peaks from CaPE into the CaPSim algorithm.
- The algorithm will sequentially compare these peaks against the entries in the in silico DFT library.
- For each reference compound, CaPSim will calculate a similarity score based on the alignment of peak positions and relative intensities, while remaining robust to minor spectral shifts.
- Identification and Reporting: The compound with the highest similarity score above a predefined threshold (e.g., 0.6) is reported as the identified analyte. The results can be compiled into a report listing detected PAHs and the confidence of identification.
The Scientist's Toolkit: Research Reagent Solutions
The following table lists the essential materials and computational tools required to implement the described protocols.
Table 2: Essential Research Reagents and Tools for In Silico ML-Enabled PAH Detection
| Item Name | Function / Application | Example Specifications / Notes |
|---|---|---|
| Gold Nanoshell (SiO2-Au) Substrate | SERS signal enhancement; amplifies the Raman scattering of target molecules adsorbed to its surface [24]. | Core diameter: ~168 nm; Au shell thickness: ~10 nm; plasmon resonance tuned to 785 nm laser. |
| Density Functional Theory (DFT) Code | Computational generation of theoretical vibrational spectra for PAHs and PACs to build the in silico reference library [7] [8]. | Software packages: Gaussian, ORCA. Common functional/basis set: B3LYP/6-311G(d,p). |
| CaPE/CaPSim Algorithms | Machine learning pipeline for extracting spectral features and identifying analytes from complex spectral data [7] [23]. | Custom scripts in Python/MATLAB; robust to spectral shifts and background interference. |
| Portable Raman Spectrometer | On-site acquisition of vibrational spectra from prepared soil samples; enables potential field deployment [8]. | Laser excitation: 785 nm to match nanoshell plasmon resonance and minimize soil fluorescence. |
Polycyclic aromatic hydrocarbons (PAHs) like pyrene and anthracene are persistent organic pollutants of significant environmental concern due to their carcinogenic, teratogenic, and mutagenic properties. The United States Environmental Protection Agency (US EPA) has identified 16 PAHs as priority pollutants, necessitating their monitoring in contaminated sites [25] [26]. Accurate detection of these compounds in soil is crucial for environmental risk assessment and remediation planning. Traditional analytical methods, including gas chromatography-mass spectrometry (GC-MS) and high-performance liquid chromatography (HPLC), while sensitive, require complex sample preparation, sophisticated instrumentation, and are often time-consuming and costly [26] [27]. This case study explores the integration of advanced sensing technologies with in silico machine learning approaches to overcome these limitations, enabling rapid, high-accuracy detection of pyrene and anthracene in contaminated soil. We demonstrate how these innovative methodologies enhance analytical precision and provide a framework for next-generation environmental monitoring.
State of the Art in PAH Detection
Conventional Analytical Techniques
The conventional workflow for PAH analysis in soil involves sample collection, extraction, purification, and instrumental analysis. A typical protocol, as described in a study of contaminated soil from a former coking wastewater treatment plant, involves collecting soil samples from a depth of 0.5 m using a hand-held drill [25]. The samples are then extracted in an automatic Soxhlet extractor with a 100 mL acetone/dichloromethane mixture (1:1 volume ratio) at 110°C for 2 hours. The extracts are concentrated via rotary evaporation and purified using fluorinated chromatography columns before quantitative analysis by GC-MS equipped with an HP-5 capillary column [25]. While this method provides reliable results, its complexity underscores the need for simpler, faster alternatives.
Emerging Sensing Technologies
Surface-enhanced Raman spectroscopy (SERS) has emerged as a powerful technique for trace-level PAH detection, leveraging the enhancement of Raman signals on nanostructured metallic surfaces. Recent advancements have focused on developing hybrid photonic-plasmonic substrates that generate intense electromagnetic fields ("hot spots") for signal amplification [26] [28]. Concurrently, high-resolution mass spectrometry (HRMS) coupled with stable isotope-assisted metabolomics (SIAM) has shown promise for tracing PAH biotransformation and identifying metabolites in complex environmental samples like soil [29].
Advanced Sensing Platforms for Pyrene and Anthracene Detection
Hybrid Photonic-Plasmonic SERS Sensors
A breakthrough in SERS technology involves a hybrid architecture comprising an Au film, poly(ionic liquid) (PIL) nanobowls, and Au nanospheres [26] [28]. This structure creates a synergistic coupling between photonic nanocavities and plasmonic hotspots, generating high-intensity electromagnetic field regions crucial for signal enhancement. The PIL nanobowls play a critical role in enriching PAHs via hydrophobic interactions and π-π stacking, significantly improving substrate-analyte affinity, which is often a challenge for PAH detection due to their lack of strong affinity groups like -SH or -NH₂ [26].
Table 1: Performance of Advanced Sensing Platforms for PAH Detection
| Detection Platform | Target PAHs | Limit of Detection (LOD) | Matrix | Key Features |
|---|---|---|---|---|
| Hybrid Photonic-Plasmonic SERS [26] [28] | Pyrene, Anthracene, Benzo[a]pyrene, Phenanthrene | 6.1 to 8.5 × 10⁻¹⁰ mol/L | River water | PIL nanobowls for enrichment; PCA-SVM analysis |
| Gold Nanostars (GNS) SERS [30] | Pyrene, Anthracene, Benzo[a]pyrene, Nitro-pyrene, Triphenylene | Nanomolar range | Drinking water, River water | CTAB-capped GNS; CNN model with 90% accuracy |
| PAH-Finder with HRMS [31] | Broad-spectrum PAHs and derivatives | - | Particulate matter | Random forest model; normalized fragment analysis |
Gold Nanostar-Based SERS Platforms
An alternative SERS approach utilizes surfactant-free gold nanostars (GNSs) with multibranched sharp spikes that generate strong SERS signals [30]. These GNSs are capped with cetyltrimethylammonium bromide (CTAB) for stability and to trap PAH molecules. This platform enables a simple solution-based 'mix and detect' SERS sensing strategy for various PAHs, including pyrene and anthracene, spiked in real water samples using a portable Raman module [30]. The system achieved limits of detection in the nanomolar range and maintained reproducible signal detection for over 90 days after synthesis, highlighting its practicality for field applications.
Machine Learning Integration for Enhanced Discrimination
Data Processing Workflows
The integration of machine learning with analytical data is revolutionizing PAH detection. For SERS data analysis, dimensionality reduction and classification algorithms are vital for interpreting complex spectral data from structurally similar PAHs [26]. The standard workflow involves:
- Spectral Preprocessing: Normalizing and aligning raw SERS spectra.
- Feature Extraction: Using Principal Component Analysis (PCA) to reduce data dimensionality while retaining key information. A strong linear relationship (R²=0.998) has been demonstrated between PCA-derived Euclidean distances and molar ratios in binary PAH mixtures [26].
- Classification: Applying Support Vector Machine (SVM) algorithms to identify optimal hyperplanes for classifying different PAHs based on their spectral fingerprints [26].
Figure 1: ML Workflow for SERS Data Analysis. This diagram illustrates the machine learning pipeline for processing SERS spectral data to identify specific PAHs.
Convolutional Neural Networks for SERS Analysis
For more complex pattern recognition, Convolutional Neural Networks (CNNs) have been successfully applied to SERS data. In the gold nanostar platform, a CNN classification model achieved 90% prediction accuracy in the nanomolar detection range, with an f1 score of 94% [30]. A separate CNN regression model achieved an RMSE of 1.07 × 10⁻¹ μM for concentration prediction, demonstrating the capability of deep learning models for both identification and quantification of PAHs in complex environmental matrices [30].
PAH-Finder for Nontargeted Analysis
For HRMS data, the PAH-Finder workflow employs a random forest model trained on 98 PAH spectra and 1,003 background spectra to identify PAHs and their derivatives [31]. This novel approach normalizes fragment m/z values to a 0-100% range relative to the molecular ion peak and uses seven machine learning features to capture PAH fragmentation characteristics. The model achieved an F1 score of approximately 0.9 in 5-fold cross-validation and demonstrated a 246% increase in annotation efficiency compared to traditional NIST20 library searches, identifying 135 PAHs including previously unreported formulas in particulate matter samples [31].
Experimental Protocol: SERS-ML Detection of Pyrene and Anthracene in Soil
Sample Collection and Preparation
- Soil Sampling: Collect soil samples from a depth of 0.5 m using a hand-held drill [25]. Store samples in 250 mL brown glass bottles at 4°C until analysis.
- PAH Extraction: Weigh 4 g of soil and perform Soxhlet extraction with 100 mL of acetone/dichloromethane (1:1 v/v) at 110°C for 2 hours [25].
- Extract Concentration: Concentrate the extracts to approximately 2 mL using a rotary evaporator.
- Sample Purification: Purify extracts using a fluorinated chromatography column packed with skimmed cotton, anhydrous sodium sulfate, and silica gel. Elute with n-hexane/dichloromethane (1:1 v/v) and concentrate to 0.5 mL [25].
SERS Analysis with Hybrid Substrate
- Substrate Preparation: Fabricate the hybrid photonic-plasmonic substrate comprising Au film-PIL nanobowl-Au nanosphere architecture [26] [28].
- Sample Exposure: Deposit the purified soil extract onto the SERS substrate and allow sufficient time for PAH enrichment via hydrophobic interactions and π-π stacking with the PIL nanobowls.
- Spectral Acquisition: Acquire SERS spectra using a portable Raman spectrometer with a 785 nm laser excitation source. Use an integration time of 10 seconds and three accumulations per spectrum.
Machine Learning Analysis
- Data Preprocessing: Normalize all acquired spectra to the same intensity scale and perform baseline correction.
- Model Application: Input the preprocessed spectra into a pre-trained PCA-SVM model for classification of pyrene and anthracene [26]. Alternatively, use a CNN model for both identification and concentration prediction [30].
- Validation: Validate model predictions against known standards and calculate accuracy metrics.
Figure 2: SERS-ML PAH Detection Workflow. This diagram outlines the comprehensive experimental protocol from soil sampling to final PAH identification.
The Scientist's Toolkit: Essential Research Reagents and Materials
Table 2: Key Research Reagent Solutions for PAH Detection Experiments
| Reagent/Material | Function | Application Notes |
|---|---|---|
| Acetone/Dichloromethane (1:1) [25] | PAH extraction from soil | Soxhlet extraction at 110°C for 2 hours |
| Hybrid Photonic-Plasmonic Substrate (Au film-PIL nanobowl-Au nanosphere) [26] [28] | SERS signal enhancement | Enriches PAHs via hydrophobic interactions and π-π stacking |
| Gold Nanostars (GNS) [30] | SERS signal generation | Multibranched sharp spikes create "hot spots"; CTAB-capped for stability |
| n-Hexane/Dichloromethane (1:1) [25] | Chromatographic elution | Purifies PAH extracts before analysis |
| U-¹³C Labeled PAHs [29] | Isotopic tracing in SIAM | Enables tracking of PAH biotransformation in complex samples |
| PCA-SVM Algorithm [26] | Spectral data classification | Discriminates structurally similar PAHs with high accuracy |
| Convolutional Neural Network (CNN) [30] | Spectral pattern recognition | Achieves high prediction accuracy for PAH identification and quantification |
The integration of advanced sensing platforms like hybrid photonic-plasmonic SERS substrates with machine learning algorithms represents a paradigm shift in detecting pyrene, anthracene, and other PAHs in contaminated soil. These methodologies offer significant advantages over traditional techniques, including ultra-sensitive detection (LODs as low as 6.1 to 8.5 × 10⁻¹⁰ mol/L), high classification accuracy (up to 90-100%), and the potential for rapid, on-site analysis [26] [28] [30]. The implementation of in silico approaches, including PCA-SVM, CNN, and random forest models, enables robust discrimination of structurally analogous PAHs even in complex environmental matrices. As these technologies continue to evolve, they will play an increasingly vital role in environmental monitoring, risk assessment, and remediation efforts, providing more accurate, efficient, and comprehensive tools for managing PAH-contaminated sites.
This application note details a robust framework for overcoming data scarcity in environmental machine learning (ML) research, specifically for detecting polycyclic aromatic hydrocarbons (PAHs) in soil. By integrating in silico-generated data with experimental measurements and fusing molecular descriptors, the outlined protocols enhance the predictive performance and generalizability of models, even when initial datasets are small. The strategies presented—including the use of density functional theory (DFT) to create virtual spectral libraries and data fusion techniques to combine multiple data types—provide a pathway to more accurate and reliable environmental monitoring [8] [7].
Detecting polycyclic aromatic hydrocarbons (PAHs) and their derivatives in soil is critical for human health risk assessment, as these compounds are linked to cancer and developmental issues [8]. However, the experimental measurement of these contaminants is often hampered by the complexity of soil organic matter, the high cost of laboratory analysis, and the sheer number of potential PAH derivatives that lack experimental reference data [7]. This results in a "small data" problem, where machine learning models cannot be trained effectively, limiting their accuracy and real-world applicability.
To address this, researchers are turning to data fusion strategies that merge limited experimental datasets with in silico-generated data and integrate multiple types of molecular descriptors. This approach enriches the information available for model training, leading to more robust predictions. A prime example is a novel method that combines surface-enhanced Raman spectroscopy (SERS) with a DFT-calculated spectral library and a two-stage ML pipeline to identify PAHs in soil without needing physical reference samples for every compound [8] [7].
The tables below summarize key quantitative data from relevant studies, highlighting the performance gains achieved through data fusion and augmentation strategies.
Table 1: Performance of Machine Learning Models in PAH Detection and Prediction
| Model / Approach | Key Data Fusion Strategy | Performance Metrics | Context / Application |
|---|---|---|---|
| Two-Stage ML with DFT Library [8] [7] | Fusion of experimental SERS data with in silico DFT-calculated spectra | Strong similarity (>0.6) between DFT and experimental spectra; accurate identification of PAHs. | Detecting PAHs/PACs in contaminated soil without experimental reference samples. |
| AE-GAN with Bayes-ESN [32] | Data augmentation using Auto-Encoders & Generative Adversarial Networks (AE-GAN) on spectral/chemical data. | Best model performance with R²P = 0.8238 (epoch=3000, data increment=750). | Predicting a Comprehensive PAHs Index (CPI) in roasted lamb. |
| QSPR Model [33] | Integration of quantum-chemical descriptors (polarizability, electrostatic potential). | R² = 0.846, RMSE = 0.122 for predicting distribution ratio (f) of PAHs/X-PAHs. | Predicting the distribution of PAHs and derivatives in atmospheric particulate phase. |
Table 2: Key Quantum-Chemical Descriptors for Molecular Property Prediction
| Descriptor | Symbol | Role in QSAR/QSPR Models | Example Use Case |
|---|---|---|---|
| Average Molecular Polarizability [33] | α | Influences distribution between gas and particulate phases; characterizes van der Waals interactions. | Predicting atmospheric distribution ratio (f) of PAHs/X-PAHs [33]. |
| Molecular Electrostatic Potential Equilibrium Parameter [33] | τ | Describes charge distribution and electrophilic attack sites; significant for phase partitioning. | Predicting atmospheric distribution ratio (f) of PAHs/X-PAHs [33]. |
| Energy of HOMO/LUMO [34] | E(HOMO), E(LUMO) | Indicates electron-donating/accepting potential; related to phototoxic activity. | Assessing photoinduced toxicity of PAHs in aquatic species [34]. |
| Electrophilicity Index [34] | ω | Measures the energy lowering due to maximal electron flow between donor and acceptor. | QSAR models for PAH phototoxicity [34]. |
Experimental Protocols
Protocol 1: Constructing an In Silico Spectral Library using Density Functional Theory (DFT)
This protocol generates a virtual library of Raman spectra for PAHs and their derivatives, which is crucial when experimental standards are unavailable [8] [7].
- Objective: To calculate the theoretical Raman spectra of target PAH molecules based on their molecular structure.
- Materials & Software: Quantum computational software (e.g., Gaussian, ORCA), computer cluster.
- Procedure:
- Molecular Structure Input: Obtain or draw the 3D molecular structure of the target PAH in a suitable file format (e.g., .mol, .sdf).
- Geometry Optimization: Use a density functional theory (DFT) method (e.g., B3LYP) with a basis set (e.g., 6-311+G(d,p)) to fully optimize the geometry of the molecule. This finds the most stable conformation with the lowest energy [33] [34].
- Frequency Calculation: On the optimized geometry, perform a frequency calculation using the same DFT method and basis set. This calculation outputs the theoretical Raman spectrum.
- Spectra Collection: Compile the calculated spectra for all target compounds into a searchable virtual library.
Protocol 2: A Two-Stage Machine Learning Pipeline for PAH Identification
This protocol fuses experimental sensor data with the in silico library to identify PAHs in complex soil samples [8] [7].
- Objective: To detect and identify PAHs in soil samples using surface-enhanced Raman spectroscopy (SERS) and a physics-informed ML pipeline.
- Materials: Portable Raman spectrometer, SERS substrates (e.g., signature nanoshells), soil samples, computer with Python/R environment.
- Procedure:
- Data Acquisition: Collect experimental SERS spectra from the soil sample using the portable spectrometer.
- Feature Extraction (CaPE Algorithm): Process the raw SERS data using the Characteristic Peak Extraction (CaPE) algorithm. This machine learning step isolates the most distinctive spectral features from the complex sample background.
- Spectral Matching (CaPSim Algorithm): Compare the extracted characteristic peaks against the virtual DFT spectral library using the Characteristic Peak Similarity (CaPSim) algorithm. This identifies the analytes present by finding the highest similarity matches (>0.6 similarity value is a strong indicator [7]).
Protocol 3: Data Augmentation for Regression Models using AE-GAN
This protocol is designed to expand small spectral and chemical datasets, improving the performance of subsequent regression models [32].
- Objective: To generate high-quality synthetic data that mimics the structure of a limited original dataset for PAH prediction.
- Materials & Software: Python with deep learning libraries (e.g., TensorFlow, PyTorch).
- Procedure:
- Data Preparation: Compile a dataset of original spectral and chemical PAH measurements. Preprocess the data (e.g., normalization).
- Model Training: Train an Auto-Encoder Generative Adversarial Network (AE-GAN). The Auto-Encoder (AE) first learns to compress and reconstruct the data, capturing its intrinsic structure. The Generative Adversarial Network (GAN) then uses this encoded information to generate new, realistic synthetic data points through an adversarial process between a generator and a discriminator.
- Data Validation: Assess the quality of the generated data using visualization, Principal Component Analysis (PCA), and box-plots to ensure it overlaps with the distribution of the real data.
- Model Application: Use the augmented dataset (original + synthetic data) to train a regression model like a Bayesian Echo State Network (Bayes-ESN) for final prediction tasks [32].
Workflow Visualization
PAH Prediction Data Fusion Workflow
The Scientist's Toolkit: Essential Research Reagents & Materials
Table 3: Key Solutions and Materials for In Silico PAH Detection Research
| Item | Function / Application | Specific Examples / Notes |
|---|---|---|
| Computational Chemistry Software | Performs quantum chemical calculations (DFT) to generate in silico spectral libraries. | Gaussian, ORCA; uses methods like B3LYP/6-311+G(d,p) for geometry optimization [33] [7]. |
| Surface-Enhanced Raman Spectroscopy (SERS) | A sensing technique that provides the experimental spectral data from soil samples. | Portable Raman spectrometers; signature nanoshells used to enhance spectral signals [8] [7]. |
| Data Augmentation Algorithm (AE-GAN) | Generates realistic synthetic data to expand small training datasets. | Auto-Encoders (AE) compress data; Generative Adversarial Networks (GAN) create new samples [32]. |
| Machine Learning Pipelines | Algorithms that fuse data and make predictions. | Two-stage ML (CaPE, CaPSim) for identification [7]; Bayes-ESN for regression [32]. |
| Quantum-Chemical Descriptors | Numeric representations of molecular properties used in QSPR models. | Molecular polarizability (α), electrostatic potential (τ), HOMO/LUMO energies [33] [34]. |
Overcoming Real-World Hurdles: Data, Complexity, and Model Generalization
The accurate detection of polycyclic aromatic hydrocarbons (PAHs) in contaminated soil is critical for environmental monitoring and public health risk assessment. However, this task is significantly complicated by two major analytical challenges: complex soil backgrounds and solvent effects, which introduce substantial spectral interference. These interferences obscure the unique spectral "fingerprints" of target analytes, leading to reduced detection sensitivity and accuracy. This Application Note details integrated strategies that combine in silico machine learning with advanced spectroscopic techniques to overcome these limitations, enabling reliable PAH detection even in complex environmental samples. The protocols herein are framed within a broader thesis on developing computational approaches for environmental contaminant analysis, moving beyond traditional dependency on experimental reference standards.
Theoretical Background and Key Concepts
Origins of Spectral Interference
Spectral interference in soil analysis arises from multiple sources, each requiring distinct mitigation strategies:
- Soil Matrix Effects: Complex soil organic matter and mineral assemblages create overlapping spectral signatures that mask PAH signals. Different mineral types, such as silicate clay minerals and skarn minerals, exhibit varying adsorption characteristics for heavy metals, which indirectly affects PAH detection through modified background signals [35].
- Moisture Interference: Water content in soil significantly alters reflectance spectra, particularly in moisture-rich soils like black soils, where water molecules produce strong absorption features that overlap with analyte signals [36].
- Solvent Effects: In analytical preparations, solvents cause spectral shifts through solute-solvent interactions. Polar solvents like ethanol differentially stabilize electronic states (n→π* and π→π* transitions), causing blueshift or redshift transitions that vary with molecular structure [37].
The In Silico Paradigm Shift
Traditional analytical methods rely on experimental reference standards for compound identification, creating a critical gap for previously unstudied or transformed environmental pollutants. The in silico machine learning framework overcomes this limitation by using density functional theory (DFT) to computationally generate reference spectra based on molecular structure, effectively creating a virtual spectral library that encompasses known PAHs and their derivatives [8] [7].
Computational Strategies and Protocols
Protocol 1: Building a Virtual Spectral Library Using DFT
Objective: To generate accurate theoretical Raman and UV-Vis spectra for PAHs and their derivatives to create a comprehensive reference library without synthetic standards.
Materials and Reagents:
- Quantum chemistry software (e.g., Gaussian 09) with TD-DFT capability
- High-performance computing cluster
- Molecular modeling and visualization software
Procedure:
- Molecular Structure Optimization:
- Obtain initial PAH structures from databases or build using molecular editors
- Perform geometry optimization in gas phase using DFT with B3LYP functional and 6-311+G basis set
- Confirm optimized structures represent energy minima through frequency calculations (no imaginary frequencies)
Excited State Calculations:
- Perform TD-DFT calculations on optimized structures to determine excited state energies and transition moments
- Include solvent effects using Polarizable Continuum Model (PCM) with appropriate solvent parameters
- Compare results from different solvation methods (cLR, IBSF) to assess consistency
Spectral Simulation:
- Convert calculated transition energies and oscillator strengths to simulated spectra using Gaussian broadening
- Validate computational approach against available experimental standards
- Curate calculated spectra in searchable database format with associated metadata
Troubleshooting Tips:
- If solvent shifts appear underestimated, employ state-specific solvation methods (IBSF) for improved accuracy
- For large PAH systems (>30 atoms), use CAM-B3LYP functional for better description of charge transfer states
- Computational cost can be reduced using 6-31+G* basis set with minimal accuracy loss
Protocol 2: Machine Learning-Enabled Spectral Matching
Objective: To identify PAHs in complex soil spectra by matching observed features against the in silico spectral library using a specialized machine learning pipeline.
Materials and Reagents:
- Python environment with scikit-learn, pandas, numpy
- Pre-processed soil spectral data
- Virtual spectral library from Protocol 1
Procedure:
- Characteristic Peak Extraction (CaPE):
- Apply wavelet transform to raw spectra for multi-scale feature detection
- Implement baseline correction using asymmetric least squares smoothing
- Detect local maxima satisfying prominence and width thresholds
- Extract peak parameters (position, intensity, width, asymmetry)
Feature Vector Construction:
- Create binary presence/absence vectors for predefined spectral regions
- Calculate normalized intensity ratios for diagnostic peak clusters
- Include second-derivative features to enhance resolution of overlapping peaks
Characteristic Peak Similarity (CaPSim):
- Compute similarity metric between sample feature vector and library entries
- Apply weighting scheme prioritizing diagnostically significant regions
- Implement consensus scoring across multiple similarity measures (cosine, correlation, Euclidean)
Identification and Validation:
- Establish significance threshold based on negative control samples
- Generate confidence scores using ensemble approach
- Apply domain knowledge constraints (environmental plausibility)
Troubleshooting Tips:
- If false positives persist, increase weighting of specific fingerprint regions
- For complex mixtures, implement non-negative matrix factorization as preprocessing step
- Optimize peak detection parameters using representative training set
The following workflow diagram illustrates the integrated computational and experimental approach for PAH detection in complex soil matrices:
Protocol 3: Bayesian-Optimized Moisture Correction
Objective: To mitigate moisture-induced spectral distortions in soil reflectance spectra using dynamic optimization.
Materials and Reagents:
- High-throughput hyperspectral imaging system
- Soil samples with controlled moisture content
- Computing resources for Bayesian optimization
Procedure:
- Spectral Library Development:
- Collect spectra from soil samples across moisture gradient (5-30% w/w)
- Measure reference spectra from dried and processed equivalents
- Establish paired dataset (moist vs. dry) for algorithm training
BO-DMM Algorithm Implementation:
- Define objective function to minimize spectral angle between moist and dry spectra
- Initialize Bayesian optimization with default kernel parameters
- Iterate to find optimal correction parameters
- Apply transformation to shrink moist soil spectral angle by 50% toward dry reference
Validation:
- Assess correction effectiveness with independent validation set
- Evaluate improvement in TN and SOM prediction accuracy
- Compare performance across different machine learning models
Troubleshooting Tips:
- If overcorrection occurs, adjust shrinkage factor in objective function
- For soil-specific optimization, include mineralogical parameters in feature set
- Ensure moisture gradient adequately represents field conditions
Experimental Validation and Performance Metrics
Quantitative Performance of Integrated Approach
The following table summarizes the experimental performance of the described methodologies for PAH detection and soil analysis:
Table 1: Performance Metrics of Spectral Interference Mitigation Strategies
| Method | Application Context | Key Performance Metrics | Limitations/Challenges |
|---|---|---|---|
| In Silico ML with SERS [8] [7] | PAH detection in contaminated soil | - Similarity values >0.6 between DFT and experimental spectra- Successful identification without reference standards- Detection of previously unstudied PAH derivatives | - Matrix effects in complex soils- Requires spectral enhancement with designed nanoshells |
| BO-DMM Method [36] | Moisture correction in black soils | - 50% reduction in spectral angle toward dry soil reference- Enhanced prediction accuracy for TN and SOM across models- Effective in quantitative inversion of moist soil | - Soil-specific optimization required- Performance varies with mineral composition |
| Mineral-Assemblage Specific Models [35] | Heavy metal detection in mine soils | - Statistically significant prediction of Cu, Zn, As, Pb in Group A soils- Accurate Zn and Pb prediction in Group B soils- Different spectral models for different mineral assemblages | - Site-specific models limit universal application- Requires prior mineralogical characterization |
The Scientist's Toolkit: Essential Research Reagents and Materials
Table 2: Key Research Reagent Solutions for Spectral Analysis of Soil Contaminants
| Item | Function/Application | Specification Notes |
|---|---|---|
| Surface-Enhanced Raman Spectroscopy (SERS) Substrates | Signal amplification for PAH detection | Nanoshells designed to enhance relevant spectral traits [8] |
| Hyperspectral Imaging System | High-throughput soil spectral analysis | Capable of VNIR-SWIR range (350-2500 nm) for mineral and organic assessment [36] |
| Portable X-ray Fluorescence Spectrometer (PXRF) | Rapid elemental analysis in soil | USEPA-approved method for heavy metal detection; requires calibration [35] |
| Density Functional Theory (DFT) Computational Package | Prediction of molecular spectra | Gaussian 09 with TD-DFT and PCM solvation models [37] |
| Polarizable Continuum Model (PCM) | Computational simulation of solvent effects | Three versions compared: cLR, cLR2, and IBSF for solvent shift prediction [37] |
Advanced Integration and Specialized Applications
Mineral Assemblage-Specific Modeling
Different mineral compositions in soil require customized spectral models due to varying heavy metal adsorption characteristics:
Table 3: Spectral Model Customization for Different Soil Mineral Assemblages
| Mineral Group | Composition | Primary Spectral Associations | Recommended Modeling Approach |
|---|---|---|---|
| Group A (Silicate Clay) [35] | Clay minerals, iron oxides | - OH absorption features at 1400, 1900, 2200 nm- Iron oxide features at 500, 900 nm | Focus on clay mineral and iron oxide correlations for Cu, Zn, As, Pb prediction |
| Group B (Silicate-Carbonate-Skarn) [35] | Skarn minerals, carbonates, clays | - Carbonate features at 2300-2350 nm- Skarn mineral features at 2200-2250 nm- Combined clay-carbonate iron oxide features | Integrate skarn mineral absorptions with iron oxide and clay features for Zn and Pb prediction |
Diagram: Mineral-Assemblage Specific Spectral Modeling Approach
This Application Note has detailed comprehensive strategies for addressing spectral interference challenges in complex soil backgrounds. The integration of in silico machine learning with advanced spectroscopic techniques represents a paradigm shift in environmental contaminant analysis, particularly for PAH detection. By combining virtual spectral libraries generated through DFT calculations with specialized machine learning algorithms like CaPE and CaPSim, researchers can now identify pollutants without dependency on experimental reference standards. Furthermore, the implementation of Bayesian-optimized moisture mitigation and mineral assemblage-specific modeling provides robust solutions to the persistent challenges of environmental variability. These protocols establish a foundation for more accurate, comprehensive soil contamination assessment, ultimately enhancing environmental monitoring and public health protection.
Accurately detecting polycyclic aromatic hydrocarbons (PAHs) in contaminated soil is critical for environmental risk assessment and remediation, yet this task presents significant machine learning challenges due to data scarcity. Soil organic matter represents one of the most complex biomaterials on Earth, consisting of an extensive mixture of plant and microbial matter in various stages of decay, making PAH detection particularly challenging [16]. The traditional approach of using supervised learning requires large volumes of labeled data that are often unavailable for many environmental contaminants, especially modified PAH derivatives that lack experimental reference spectra [16] [8]. This data scarcity problem is exacerbated by the high costs of soil sampling, laboratory analysis, and the sheer diversity of potential PAH compounds and their environmental transformation products.
Fortunately, innovative machine learning approaches are emerging to overcome these limitations. This application note explores two powerful frameworks—ensemble models and multi-task learning—that demonstrate considerable promise for mitigating data scarcity in PAH detection research. These approaches enable researchers to build more robust and accurate models even when working with limited sample sizes, which is a common constraint in environmental monitoring and remediation projects.
Multi-Task Learning Framework for Simultaneous Pollutant Prediction
Theoretical Foundations and Environmental Applications
Multi-task learning (MTL) represents a machine learning paradigm where multiple related tasks are learned simultaneously, allowing the model to leverage common patterns and relationships across these tasks. In the context of PAH detection, this approach is particularly valuable because contaminated sites typically contain multiple pollutants that often share common sources, transport pathways, and geochemical behaviors [38]. By learning these tasks jointly, MTL enables more efficient use of limited data and often leads to improved generalization compared to training separate models for each task.
The fundamental principle behind MTL is that learning multiple related tasks simultaneously allows the model to discover a representation that captures the underlying factors common to all tasks. This approach is especially beneficial when data for individual tasks is scarce, as the model can leverage information from all tasks to build a more robust internal representation. For PAH detection, this means that a model trained to detect multiple PAH compounds simultaneously can learn generalized features about PAH-soil interactions that would be difficult to learn from limited data for any single compound.
Implementation Protocol: Multi-Task Convolutional Neural Network for 3D Pollutant Mapping
Objective: To simultaneously map the three-dimensional distributions of multiple soil pollutants using a multi-task convolutional neural network (MT-CNN) architecture.
Materials and Requirements:
- Soil sample data with measured pollutant concentrations
- Multisource covariate data (topography, hydrogeological conditions, industrial history)
- Computational resources capable of running deep learning models
- Python with TensorFlow/PyTorch and specialized geospatial libraries
Step-by-Step Procedure:
Data Preparation and Integration
- Collect borehole sample data with measured concentrations for multiple PAHs and heavy metals
- Compile multisource environmental covariates including geological, topographical, and historical industrial activity data
- Preprocess all data to consistent 3D spatial grids with uniform resolution
- Normalize all concentration values and covariates to standard scales
Model Architecture Design
- Implement a patch-based CNN architecture that processes neighborhood information from covariates
- Design shared convolutional layers to extract common features across all prediction tasks
- Create task-specific output layers for each target pollutant (Zn, Pb, Ni, Cu, or specific PAHs)
- Configure appropriate loss functions that balance learning across all tasks
Model Training and Validation
- Partition data into training, validation, and test sets with spatial consideration to avoid leakage
- Implement cross-validation procedures to assess model stability
- Train model using backpropagation with a multi-task loss function
- Monitor performance on individual tasks to ensure balanced learning
- Apply early stopping based on validation performance to prevent overfitting
Performance Metrics: The performance of MT-CNN models in predicting 3D distributions of heavy metals demonstrates the effectiveness of this approach, even with limited sample data [38]:
Table 1: Performance Metrics of MT-CNN Model for Heavy Metal Prediction
| Heavy Metal | R² Value | Comparative Advantage Over Traditional Methods |
|---|---|---|
| Zn | 0.58 | Outperformed RF, OK, and IDW |
| Pb | 0.56 | Outperformed RF, OK, and IDW |
| Ni | 0.29 | Outperformed RF, OK, and IDW |
| Cu | 0.23 | Outperformed RF, OK, and IDW |
The MT-CNN model achieved more stable predictions with reasonable accuracy compared to single-task CNN models, highlighting its potential for mapping multiple pollutants while balancing model training, maintenance, and accuracy for rapid assessment of soil pollution at industrial sites [38].
Ensemble Learning Approaches for Imbalanced Data
Theoretical Framework for Data Scarcity Scenarios
Ensemble learning methods combine multiple base models to produce a single, more robust predictive model. This approach is particularly valuable for addressing data scarcity in PAH detection because it reduces variance, mitigates overfitting, and improves generalization—all critical challenges when working with limited datasets. The fundamental principle behind ensemble methods is that a collection of models, each with different strengths and weaknesses, can collectively make more accurate and reliable predictions than any single model.
In environmental applications like PAH detection, ensemble methods offer additional advantages for handling imbalanced datasets where failure instances or rare contamination events are underrepresented. Techniques such as weighted average ensembles and error-correcting output codes (ECOC) have demonstrated remarkable success in addressing multiclass imbalanced data classification difficulties commonly encountered in subsurface geological heterogeneities [39]. These approaches are particularly relevant for PAH detection where certain compounds may appear only rarely in environmental samples.
Implementation Protocol: Weighted Average Ensemble for Lithology Classification
Objective: To implement an enhanced weighted average ensemble approach for reliable classification tasks with imbalanced multiclass data distributions.
Materials and Requirements:
- Imbalanced dataset with multiple classes
- Computational environment with machine learning libraries
- Cross-validation framework for model evaluation
Step-by-Step Procedure:
Base Model Selection and Training
- Select diverse base classifiers (e.g., Random Forest, SVM, XGBoost) to ensure prediction diversity
- Train each base model independently on the training dataset
- Apply error-correcting output codes (ECOC) to extend binary classification techniques to multiclass environments
- Implement cost-sensitive learning (CSL) to address class imbalance by assigning higher misclassification costs to minority classes
Ensemble Construction and Optimization
- Develop weighted averaging mechanism based on individual model performance
- Assign weights to each model's predictions according to their validation accuracy
- Optimize weighting scheme through iterative validation on holdout datasets
- Implement stacking procedure to combine base model predictions using a meta-learner
Validation and Performance Assessment
- Evaluate ensemble performance using kappa statistic and F-measure alongside traditional accuracy metrics
- Assess model stability through repeated cross-validation with different data partitions
- Compare ensemble performance against individual base models to quantify improvement
Performance Metrics: Research has demonstrated that properly configured ensemble methods can achieve remarkable performance even with challenging, imbalanced datasets. In lithology classification tasks, an enhanced weighted average ensemble based on Random Forest and SVM achieved an average Kappa statistic of 84.50% and mean F-measures of 91.04%, signifying almost-perfect agreement and highlighting the robustness of the designed ensemble-based workflow [39].
In Silico Machine Learning for PAH Detection
Theoretical Background and Innovation
The novel approach of in silico machine learning represents a paradigm shift in detecting PAHs in contaminated soil by overcoming the fundamental limitation of requiring experimental reference samples. Traditional detection methods rely on extensive libraries of experimental spectra for known compounds, which are unavailable for the thousands of lesser-known and virtually unstudied environmental PAH derivatives that also pose public health risks [16] [8]. This innovative methodology combines surface-enhanced Raman spectroscopy (SERS) with a Raman spectral library constructed in silico using density functional theory (DFT)-calculated spectra.
The theoretical foundation of this approach rests on using computational modeling to predict the spectral fingerprints of PAH compounds based on their molecular structure, effectively creating a virtual reference library that can encompass even compounds that have never been synthesized or isolated in laboratory settings. This addresses a critical gap in environmental monitoring, as soil is a dynamic environment where chemicals are subject to transformations that can render them harder to detect using traditional methods [8]. The method employs a physics-informed machine learning pipeline that operates through a two-stage process: the Characteristic Peak Extraction (CaPE) algorithm isolates distinctive spectral features, while the Characteristic Peak Similarity (CaPSim) algorithm identifies analytes with high robustness to spectral shifts and amplitude variations [16].
Implementation Protocol: Physics-Informed ML for PAH Detection
Objective: To detect and identify PAHs and their modified derivatives in contaminated soil using in silico spectral libraries and machine learning.
Materials and Requirements:
- Soil samples from target sites
- SERS substrate (SiO₂ core-Au shell nanoparticles)
- Portable Raman spectrometer with 785 nm laser excitation
- Computational resources for DFT calculations and machine learning
Step-by-Step Procedure:
Sample Preparation and Processing
- Collect soil samples from target sites using standardized sampling protocols
- Contaminate reference soil samples with controlled concentrations of target PAHs for validation
- Extract PAHs from soil using acetone extraction with simple filtration or accelerated solvent extraction
- Deposit extracted solutions onto SERS substrate by drop-drying
Spectral Data Acquisition
- Conduct SERS measurements using 785 nm laser excitation
- Collect approximately 25 spectra from different regions of each SERS substrate
- Average collected spectra to improve signal-to-noise ratio
- Validate approach using GC-MS for quantitative comparison
In Silico Library Development
- Perform density functional theory (DFT) calculations to predict Raman spectra for target PAHs
- Compile theoretical spectra into a comprehensive digital library
- Validate theoretical spectra against available experimental standards
Machine Learning Detection Pipeline
- Apply Characteristic Peak Extraction (CaPE) algorithm to isolate distinctive spectral features from experimental SERS data
- Implement Characteristic Peak Similarity (CaPSim) algorithm to compare extracted features with in silico library
- Calculate similarity values between experimental and theoretical spectra
- Establish threshold values (>0.6) for confident compound identification
Performance Validation: The methodology has demonstrated strong similarity values (>0.6) between DFT-calculated and experimental Surface-Enhanced Raman Spectra for multiple PAHs, confirming its accuracy and discriminative capability [16]. This approach has been successfully validated on soil from a restored watershed and natural area using both artificially contaminated samples and control samples, with results showing the approach reliably picks out even minute traces of PAHs using a simpler and faster process than conventional techniques [8].
Table 2: Research Reagent Solutions for PAH Detection
| Reagent/Material | Function | Specifications |
|---|---|---|
| SiO₂ core-Au shell nanoparticles | SERS substrate for signal enhancement | 165 ± 17 nm diameter, dipole plasmon resonance at 800 nm |
| Acetone | PAH extraction solvent | Enables simpler Raman signal background compared to alternatives |
| DFT-calculated spectral library | Virtual reference for compound identification | Contains theoretical spectra for PAHs and derivatives |
| Characteristic Peak Extraction (CaPE) algorithm | Feature isolation from complex spectra | Robust to spectral shifts and amplitude variations |
Data Augmentation and Synthesis Techniques
Advanced Approaches for Data Scarcity Mitigation
When real experimental data is severely limited, data augmentation and synthesis techniques provide powerful alternatives for generating additional training samples. These approaches are particularly valuable for PAH detection applications where collecting and processing large numbers of soil samples is prohibitively expensive or time-consuming. The core principle involves creating synthetic data that preserves the statistical properties and underlying relationships of the original limited dataset while expanding its size and diversity.
Generative Adversarial Networks (GANs) have emerged as particularly effective tools for addressing data scarcity in environmental machine learning applications [40] [41]. These networks consist of two neural networks—a generator and a discriminator—that engage in adversarial training to produce synthetic data nearly identical to real datasets. The generator creates synthetic data while the discriminator evaluates its authenticity, leading to progressively more realistic synthetic data generation through iterative training [40]. For PAH detection, this approach can generate synthetic spectral data or contamination distribution patterns that expand limited training datasets.
Implementation Protocol: Data Volume Prior Judgment Strategy
Objective: To determine the minimum data volume necessary for optimal model performance while maintaining data correlation in small-data environments.
Materials and Requirements:
- Limited initial dataset
- Computational resources for model training and evaluation
- Multiple machine learning algorithms for comparative assessment
Step-by-Step Procedure:
Data Collection and Feature Selection
- Compile available experimental data from multiple sources
- Identify key features influencing PAH detection and distribution
- Categorize features as controllable experimental parameters or environmental conditions
Progressive Model Training and Evaluation
- Divide dataset into increments (e.g., 100 data points per subset)
- Construct models for each data subset across multiple algorithms
- Evaluate performance metrics across different data volumes
- Identify inflection points where performance gains diminish
Optimal Model Selection and Application
- Select best-performing algorithm based on comprehensive evaluation
- Apply data volume prior judgment strategy (DV-PJS) to determine minimum sufficient data
- Deploy optimized model for prediction tasks
- Validate predictions against experimental results
Performance Metrics: Research on sludge-based catalytic degradation of bisphenols pollutants has demonstrated that implementing a data volume prior judgment strategy (DV-PJS) can significantly improve model performance with limited data. In one study, the XGBoost model trained with DV-PJS exhibited a 58.5% improvement in computational efficiency and a 17.9% increase in accuracy (reaching 96.8%) compared to the model without this strategy [42]. The relative deviation between the predicted degradation rate and the actual experimental degradation rate was only 3.2%, demonstrating the effectiveness of this approach for small-data machine learning scenarios.
Integrated Workflow and Implementation Guidelines
Comprehensive Framework for PAH Detection
Successfully implementing machine learning approaches for PAH detection in data-scarce environments requires a systematic integration of the previously discussed methodologies. The following workflow provides a visual representation of the comprehensive approach combining multi-task learning, ensemble methods, and in silico techniques for robust PAH detection in contaminated soil:
Implementation Considerations and Best Practices
When deploying these advanced machine learning approaches for PAH detection, several practical considerations can significantly impact success:
Data Quality Assurance: While pursuing methods to overcome data scarcity, maintaining rigorous data quality standards remains essential. Implement comprehensive data validation procedures to identify outliers, measurement errors, and inconsistencies. For spectral data, establish protocols for handling background interference and instrument-specific variations that could compromise model performance.
Computational Resource Management: The in silico components of these approaches, particularly DFT calculations and deep learning models, can be computationally intensive. Consider leveraging cloud computing resources or high-performance computing clusters for the most demanding computations. For field applications, develop optimized versions of models that can run on portable devices with limited computational capacity.
Model Interpretability and Validation: As machine learning approaches grow more complex, ensuring model interpretability becomes increasingly important for scientific acceptance and regulatory approval. Implement techniques such as SHAP (SHapley Additive exPlanations) analysis to identify which features most significantly influence predictions. Establish rigorous validation protocols using holdout datasets and external validation samples to demonstrate model reliability.
Adaptive Learning Frameworks: Environmental conditions and contamination patterns can change over time, potentially reducing model performance. Implement continuous learning frameworks that allow models to adapt to new data while retaining previously learned knowledge. This approach is particularly valuable for long-term monitoring programs where seasonal variations or remediation activities may alter contamination dynamics.
By integrating these practical considerations with the technical approaches outlined in this application note, researchers can develop robust, accurate, and practical machine learning solutions for PAH detection even when faced with significant data scarcity challenges.
Surface-Enhanced Raman Spectroscopy (SERS) is a powerful analytical technique renowned for its high sensitivity and molecular fingerprinting capability. However, its quantitative application and reliability are often compromised by spectral shifts and amplitude variations arising from instrumental differences, substrate inhomogeneity, and complex sample matrices. This is particularly critical in environmental monitoring, where detecting trace levels of polycyclic Aromatic Hydrocarbons (PAHs) in contaminated soil demands robust analytical methods. This Application Note details integrated experimental and computational protocols to enhance the robustness of SERS data analysis, framed within a research context of in silico machine learning for detecting PAHs in soil. We present a standardized workflow encompassing sample preparation, SERS measurement, data transformation, and machine learning analysis to achieve reliable chemical identification amidst spectral variability.
Technical Challenges and Proposed Framework
Key Challenges in SERS for Environmental Detection
The primary obstacles for robust SERS-based detection of PAHs in soil include:
- Instrument-Dependent Variations: SERS spectra acquired on different instruments exhibit shifts in peak location and amplitude due to varying laser wavelengths, detector efficiencies, and optical components [43].
- Substrate Inhomogeneity: Nanoscale variations in SERS-active structures lead to significant fluctuations in signal intensity, complicating quantitative analysis [44].
- Complex Sample Matrices: Soil organic matter creates a complex SERS spectral background, which can obscure the characteristic peaks of target PAHs [16].
- Lack of Reference Spectra: For many emerging environmental pollutants and transformation products, experimentally obtained reference spectra are unavailable [16].
Integrated Framework for Robust Analysis
Our proposed solution combines experimental SERS measurements with a physics-informed machine learning pipeline. The framework employs two complementary strategies:
- Cross-Device Spectral Transformation: A functional regression model standardizes spectra from various portable devices to a laboratory-grade reference, mitigating instrument-specific variations [45] [43].
- Characteristic Peak-Centric Machine Learning: A two-stage algorithm isolates distinctive spectral features and performs identification, reducing sensitivity to spectral shifts and amplitude changes [16].
The complete workflow, from sample preparation to final identification, is visualized below.
Experimental Protocols
Soil Sample Preparation and PAH Extraction
Principle: Efficiently extract PAHs from complex soil matrices while minimizing spectral interference from co-extracted organic matter.
Materials:
- Contaminated soil samples (e.g., from a restored watershed or industrial site).
- High-purity acetone (HPLC grade or better).
- Accelerated Solvent Extractor (ASE) or standard filtration apparatus.
- Silver nanoshell (SiO₂ core-Au shell) SERS substrates [16].
Procedure:
- Soil Contamination (For Spiked Samples): For method validation, spike as-collected soil with known concentrations (e.g., 1–600 µg/g) of target PAHs (e.g., Pyrene, Anthracene) dissolved in acetone. Seal the container, shake for 2 minutes to ensure homogeneous absorption, and air-dry at room temperature until the solvent fully evaporates [16].
- PAH Extraction:
- Option A: Filtration Extraction: Weigh 1 g of soil. Add 10 mL of acetone and vortex for 5 minutes. Filter the supernatant through a 0.22 µm PTFE syringe filter. This low-energy, room-temperature method is effective and accessible [16].
- Option B: Accelerated Solvent Extraction (ASE): For higher throughput, use ASE with acetone as the solvent under standardized conditions (e.g., 100°C, 1500 psi). Collect the extract [16].
- Extract Concentration (Optional): If necessary, gently evaporate the extract under a nitrogen stream and reconstitute in a smaller volume of acetone to concentrate the analytes, enhancing SERS detectability.
SERS Measurement with Multiple Instruments
Principle: Acquire robust spectral data that accounts for device-to-device variability, mimicking real-world scenarios where portable devices are used in the field.
Materials:
- Laboratory-grade Raman spectrometer (e.g., Renishaw).
- Portable Raman spectrometers (e.g., Tec5, First Defender, Rapid ID).
- Prepared SERS substrates with deposited soil extracts.
Procedure:
- Sample Deposition: Pipette 20 µL of the acetone soil extract onto the SERS substrate (e.g., Ag nanoshells or AgNR arrays) and allow it to dry at room temperature [16] [43].
- Instrument Calibration: Calibrate all spectrometers (both lab-grade and portable) using a silicon wafer standard (characteristic peak at 520 cm⁻¹) prior to measurement.
- Spectral Acquisition:
- For each soil extract sample, collect approximately 25-500 spectra from different, randomly selected locations on the substrate to account for spot-to-spot heterogeneity [16] [43].
- Use a 785 nm laser wavelength. Maintain consistent acquisition parameters where possible (e.g., 1-10 s integration time), but also record data using each instrument's default settings to capture real-world variability [43].
- Collect spectra over a standardized wavenumber range (e.g., 400–1800 cm⁻¹).
SERS Spectral Preprocessing
Principle: Prepare raw spectral data for downstream transformation and analysis by removing artifacts and normalizing intensities.
Procedure:
- Despiking: Identify and remove cosmic ray spikes using algorithms (e.g., by comparing adjacent spectra or using derivative filters).
- Baseline Correction: Apply the airPLS (adaptive iterative reweighted Penalized Least Squares) algorithm to subtract fluorescent backgrounds [43].
- Cropping and Interpolation: Crop all spectra to the common range of 400–1800 cm⁻¹. Interpolate spectra onto a uniform wavenumber grid with a 1 cm⁻¹ step to ensure consistency across instruments with different native resolutions [43].
- Normalization: Perform area-under-the-curve normalization on each preprocessed spectrum to minimize the influence of absolute intensity variations caused by laser power fluctuations or substrate enhancement differences [43].
Computational Methods and Data Analysis
Protocol A: Cross-Instrument Spectral Transformation
Principle: Transform SERS spectra from a portable (target) instrument to resemble those from a high-quality (standard) instrument, enabling the use of a single, standardized spectral library for classification [45] [43].
Procedure:
- Model Training:
- Select a training set comprising paired spectra from the same analytes measured on both the standard (e.g., Renishaw) and target (e.g., Tec5) instruments.
- Fit a Penalized Functional Regression Model (SpectraFRM). This model treats spectra as continuous curves and learns a nonlinear mapping function, ( Y{std}(v) = f(Y{tar}(v)) ), where ( Y{std} ) is the standard instrument spectrum and ( Y{tar} ) is the target instrument spectrum [43]. A smoothness penalty is applied to the coefficient functions to prevent overfitting.
- Transformation of New Data: Apply the fitted SpectraFRM model to transform new, unseen spectra from the target instrument into "pseudo-spectra" of the standard instrument.
- Validation: Quantify the transformation performance by calculating the Mean Absolute Error (MAE) between the transformed pseudo-spectra and the actual standard instrument spectra. Successful transformation should lead to a significant reduction in MAE (e.g., ~11% error reduction has been demonstrated) [43].
Table 1: Performance Metrics of Spectral Transformation and Identification Techniques
| Method | Key Function | Performance Metric | Reported Result | Reference |
|---|---|---|---|---|
| SERS-D2DNet | Cross-device spectrum transformation | Mean Absolute Error (MAE) | 0.01 (MAE), >98% (R²) | [45] |
| SpectraFRM | Cross-instrument spectrum mapping | Reduction in Mean Absolute Error | ~11% error reduction | [43] |
| CaPE/CaPSim | Feature extraction & identification | Similarity to DFT-calculated spectra | Similarity > 0.6 | [16] |
| SuperRaman (Super-ONN) | Classification post-transformation | Multiclass Accuracy | Up to 100% | [45] |
Protocol B: Physics-Informed ML for PAH Identification
Principle: Directly identify PAHs in complex SERS spectra by comparing them against a library of theoretically calculated spectra, bypassing the need for experimental references for every compound [16].
Procedure:
- Create an In Silico Spectral Library:
- For target PAHs (e.g., Pyrene, Anthracene) and their derivatives, calculate their theoretical Raman spectra using Density Functional Theory (DFT). This provides a library of "pure," high-fidelity spectral fingerprints [16].
- Feature Extraction with CaPE:
- Process both the preprocessed experimental SERS spectra and the DFT-calculated spectra using the Characteristic Peak Extraction (CaPE) algorithm. CaPE isolates the distinctive, analyte-specific peaks while suppressing broad backgrounds and handling minor spectral shifts [16].
- Identification with CaPSim:
- Use the Characteristic Peak Similarity (CaPSim) algorithm to quantitatively compare the CaPE-processed experimental spectrum against all CaPE-processed spectra in the DFT library.
- The analyte with the highest CaPSim similarity score (values >0.6 indicate strong confidence) is assigned as the identification result [16].
The logical flow and output of this computational pipeline are summarized in the following diagram.
The Scientist's Toolkit
Table 2: Essential Research Reagents and Materials for SERS-Based PAH Detection
| Item Name | Specifications / Example | Primary Function in Protocol |
|---|---|---|
| SERS Substrate | Silver Nanoshells (SiO₂ core, Au shell, ~165 nm) [16] or Silver Nanorod (AgNR) arrays [45] [43] | Provides plasmonic enhancement of the Raman signal for trace-level detection. |
| Extraction Solvent | High-Purity Acetone [16] | Efficiently extracts PAHs from soil with minimal interfering Raman background. |
| Reference Materials | Pyrene, Anthracene (and other PAH standards) | Used for method development, validation, and creating spiked samples. |
| Silicon Wafer | (100) orientation, single crystal | Provides a sharp Raman peak at 520 cm⁻¹ for instrument calibration. |
| Computational Library | DFT-Calculated Raman Spectra [16] | Serves as a ground-truth reference for identifying PAHs lacking experimental spectra. |
This Application Note provides a comprehensive guide for researchers tackling the critical challenges of spectral shifts and amplitude variations in SERS data. By integrating robust experimental protocols for soil analysis with advanced computational strategies like spectral transformation and physics-informed machine learning, the framework significantly enhances the reliability of SERS for detecting PAHs in complex environmental samples. The outlined methods, which leverage in silico spectral libraries and characteristic peak analysis, offer a scalable solution not only for PAHs but also for a broad range of other environmental contaminants where reference standards are scarce. This approach paves the way for more accurate, field-deployable environmental monitoring technologies.
The accurate detection of polycyclic aromatic hydrocarbons (PAHs) in contaminated soil is a critical step in environmental monitoring and risk assessment. This process forms the foundational data layer for advanced, in silico machine learning (ML) models aimed at predicting contamination patterns and ecological risks [46] [16]. The performance of these ML algorithms is inherently dependent on the quality and consistency of the input analytical data, making optimized sample preparation not merely a preliminary step but a pivotal factor in the success of computational approaches [16]. Efficient extraction of PAHs from the complex soil matrix is challenging due to their strong affinity for soil organic matter and their sequestration over time, which can lead to variable recovery rates and introduce significant uncertainty into datasets used for model training [47] [16].
This document provides detailed application notes and protocols for evaluating extraction solvents and a low-energy filtration method. The primary objective is to standardize sample preparation to generate reliable, high-fidelity data compatible with ML-driven analytical frameworks. We place particular emphasis on a room-temperature filtration technique that offers a practical and accessible alternative to energy-intensive methods, without compromising extraction efficiency, making it particularly suitable for high-throughput laboratory environments supporting large-scale ML data generation [16].
The Role of Sample Preparation in Machine Learning Workflows
In the context of in silico machine learning for environmental monitoring, sample preparation is the first and most critical data-generating step. Advanced ML pipelines, such as those utilizing surface-enhanced Raman spectroscopy (SERS) combined with computational chromatography, are capable of deconvoluting signals from complex mixtures [16]. However, these models require consistent and well-characterized input data to function accurately.
Variations in extraction efficiency, solvent effects, and the presence of co-extracted interferents directly influence the spectral or chromatographic profiles used as ML input features. For instance, incomplete extraction of certain PAHs can skew congener patterns and lead to inaccurate predictions in models trained to identify contamination sources or assess risk. Therefore, optimizing and standardizing sample preparation is equivalent to improving the quality of a training dataset, which directly enhances model performance, robustness, and predictive accuracy [46] [16].
Evaluating Extraction Solvents
The choice of solvent is a primary determinant of extraction efficiency, influencing the solubility of target analytes and the desorption of PAHs from the soil matrix.
Key Solvent Properties
An ideal solvent for PAH extraction should exhibit high solubility for a wide range of PAHs, possess low toxicity, and be compatible with downstream analytical techniques and ML data-processing algorithms. Key properties to consider include polarity, vapor pressure, and environmental friendliness.
Solvent Performance Comparison
The following table summarizes the performance of various solvents as reported in the literature for the extraction of PAHs from soil.
Table 1: Comparison of Extraction Solvents for PAHs from Soil
| Solvent | Mechanism of Action | Advantages | Disadvantages/Limitations | Recommended Application |
|---|---|---|---|---|
| Acetone [16] | Solubilization, with a simple Raman background | Effective for common PAHs (e.g., pyrene, anthracene); minimal spectral interference in SERS. | Moderate volatility. | Ideal for extractions prior to SERS analysis and ML model training. |
| n-Hexane/Acetone Mixture [48] | Solubilization (n-hexane) with enhanced microwave absorption (acetone). | High efficiency for a wide range of PAHs; well-established protocol. | Requires high-temperature for MAE; hexane is hazardous. | MAE protocols for comprehensive PAH profiling. |
| Supercritical CO₂ (with Ethanol modifier) [48] | Diffusion and solubilization in supercritical fluid. | Rapid, low solvent consumption; tunable selectivity with pressure/temperature; greener profile with ethanol. | High equipment cost; requires optimization of parameters. | High-throughput, green chemistry-focused laboratories. |
| Eucalyptus Oil [48] | Desorption and solubilization via eucalyptol. | Biodegradable, low-cost, low-tech, low-temperature operation. | Long extraction time; less efficient for soils with high carbon content. | Sustainable, low-energy extraction strategies. |
Low-Energy Filtration Method: A Protocol
Accelerated Solvent Extraction (ASE) is a standard method but requires specialized high-temperature/pressure equipment [48]. As validated by recent research, a low-energy filtration method at room temperature provides comparable recovery for key PAHs like pyrene and anthracene, making it a viable and accessible alternative [16].
Experimental Protocol
Title: Room-Temperature Solvent Extraction and Filtration for PAH Analysis
Objective: To efficiently extract PAHs from contaminated soil using a low-energy filtration method, generating reliable data for downstream analytical techniques and machine learning model input.
Materials and Reagents
- Soil Sample: Air-dried, homogenized, and sieved to <2 mm.
- Extraction Solvent: HPLC-grade Acetone (as per Table 1 recommendations).
- Internal Standards: Deuterated PAHs (e.g., CHR-d12, BaP-d12) for quantification [49].
- Apparatus: Erlenmeyer flask with stopper or screw-cap centrifuge tube, glass-fiber filter paper (e.g., Whatman GF/F), filtration funnel, vacuum flask and pump (optional), glass syringe (e.g., 20 µL), and volumetric flask.
Procedure
- Weighing: Accurately weigh 10.0 g of prepared soil sample into a clean Erlenmeyer flask or centrifuge tube [49].
- Spiking (Optional but Recommended for QA/QC): Spike with internal standard solution (e.g., 1 mL of 100 µg/kg working solution) to monitor extraction efficiency and matrix effects [49].
- Solvent Addition: Add 30 mL of acetone to the flask. The solvent-to-soil ratio should be maintained at approximately 3:1 (v/w).
- Agitation: Securely cap the flask and agitate vigorously on a mechanical shaker or by hand for 2 minutes to ensure thorough contact between the solvent and soil [16].
- Equilibration: Allow the mixture to stand at room temperature (15-25°C) for a predetermined period (e.g., 60 minutes), with occasional shaking to promote desorption.
- Filtration: Decant the supernatant through glass-fiber filter paper into the vacuum flask. Apply a gentle vacuum if necessary to accelerate filtration. Alternatively, centrifugation may be used for phase separation.
- Washing (Optional): To maximize recovery, wash the soil residue with a second 10-20 mL aliquot of acetone and filter, combining the filtrates.
- Filtrate Collection: Transfer the combined filtrate (acetone extract) to a volumetric flask.
- Concentration (If Required): If necessary, gently concentrate the extract under a stream of nitrogen gas at 40°C to a precise volume (e.g., 1 mL) to meet the sensitivity requirements of the analytical instrument [49].
- Analysis: Analyze the final extract using GC-MS or deposit onto SERS substrates as required [16] [49].
Workflow Visualization
Diagram Title: Low-Energy Filtration Workflow
Data Integration and Machine Learning
The analytical data generated from this protocol serves as the input for machine learning models. For example, in a SERS-based ML pipeline [16]:
- The acetone extract is drop-dried onto a SERS substrate.
- The resulting SERS spectra are processed using algorithms like the Characteristic Peak Extraction (CaPE) to isolate distinctive spectral features of PAHs.
- These extracted features are then compared against a ground-truth, in silico Raman library (theoretical spectra calculated using Density Functional Theory) using a similarity metric (CaPSim).
- The final output is the accurate identification of PAHs in the complex soil matrix, a task that is challenging without ML assistance.
The Scientist's Toolkit: Research Reagent Solutions
Table 2: Essential Materials and Reagents for PAH Extraction
| Item | Function/Description | Example/Specification |
|---|---|---|
| Acetone (HPLC Grade) | Primary extraction solvent for low-energy filtration; offers good PAH solubility and low spectral interference. | Purity ≥99.9% [16]. |
| Deuterated Internal Standards | To correct for analyte loss during sample preparation and quantify analytes via internal standard method. | Chrysene-d12, Benzo[a]pyrene-d12 [49]. |
| Eucalyptus Oil | A sustainable, biodegradable solvent for green extraction approaches. | High eucalyptol content (>80%) [48]. |
| Supercritical CO₂ with Ethanol Modifier | A greener alternative to industrial solvents for high-efficiency Supercritical Fluid Extraction. | CO₂ (SFE grade), Ethanol (anhydrous) as a polar modifier [48]. |
| Solid-Phase Extraction (SPE) Cartridges | For post-extraction clean-up to remove interfering co-extractives (e.g., lipids, humic acids). | Florisil (MgSiO₃) cartridges [49]. |
| SERS Substrates | For enhancing Raman signals, enabling detection of trace-level PAHs for spectral-based ML identification. | SiO₂ core-Au shell nanoparticles (Nanoshells) [16]. |
| Certified Reference Materials (CRMs) | For quality control and assurance, ensuring method accuracy and precision. | NIST 2710a and NIST 8704 [50]. |
In the field of in silico machine learning for detecting polycyclic aromatic hydrocarbons (PAHs) in contaminated soil, model interpretability is not merely advantageous—it is essential for scientific validation and regulatory acceptance. While complex ensemble and deep learning models can achieve high predictive accuracy for PAH concentration estimation, their "black box" nature impedes understanding of the underlying decision-making processes. SHapley Additive exPlanations (SHAP) analysis has emerged as a powerful framework that addresses this critical interpretability challenge by quantifying the contribution of each input feature to individual predictions based on cooperative game theory [51] [52].
The application of SHAP-based interpretability methods to environmental science represents a paradigm shift from purely predictive modeling to explainable artificial intelligence that generates testable hypotheses. In PAH contamination research, this approach enables researchers to move beyond simple concentration predictions to identify which soil characteristics, chemical properties, and environmental factors most significantly influence model outputs [53]. This interpretability is particularly valuable for prioritizing remediation efforts, understanding PAH transport mechanisms, and developing targeted sampling strategies. Recent studies have demonstrated SHAP's effectiveness in similar environmental contexts, including predicting heavy metal contamination in lake soils with 93% accuracy and interpreting the response of soil microbiomes to drought stress [51] [53].
Theoretical Foundation of SHAP Analysis
Core Mathematical Principles
SHAP values are rooted in Shapley values from cooperative game theory, providing a mathematically rigorous framework for feature importance allocation. The fundamental SHAP value for a specific feature (i) is calculated using the following formula:
The calculation involves evaluating the model output for all possible subsets of features that include and exclude the feature of interest. Formally, the SHAP value for feature (i) is given by:
[ \phii = \sum{S \subseteq F \setminus {i}} \frac{|S|!(|F| - |S| - 1)!}{|F|!} [f{S \cup {i}}(x{S \cup {i}}) - fS(xS)] ]
where (F) is the complete set of features, (S) represents a subset of features excluding (i), (|S|) is the cardinality of subset (S), and (fS(xS)) denotes the model prediction using only the feature subset (S) [52] [53]. This formulation ensures that the contribution of each feature is fairly distributed according to its marginal contribution across all possible feature combinations, satisfying important mathematical properties including efficiency, symmetry, dummy, and additivity.
SHAP Variants for Different Data Types
The computational complexity of exact SHAP value calculation grows exponentially with the number of features, making approximation methods essential for practical applications with high-dimensional data, such as PAH contamination studies that may incorporate dozens of soil parameters, spectral features, and spatial covariates. KernelSHAP provides a model-agnostic approximation approach that works with any predictive model, while TreeSHAP offers polynomial-time computation specifically for tree-based ensembles like Random Forests and Gradient Boosting Machines [51] [54]. For deep learning models applied to spectral data of contaminated soils, DeepSHAP provides efficient approximations leveraging the model's specific architecture.
SHAP-IQ Protocol for PAH Contamination Modeling
Experimental Design and Data Preparation
The following protocol outlines a standardized approach for implementing SHAP analysis in PAH contamination studies:
Phase 1: Model Training and Validation
- Data Collection and Preprocessing: Compile a comprehensive dataset of PAH concentrations paired with relevant soil characteristics (organic matter content, pH, texture), environmental factors (land use history, precipitation), and spectral features where available. Employ appropriate data cleaning, handling of censored data (values below detection limits), and spatial normalization techniques [51].
- Model Selection and Training: Implement multiple machine learning algorithms suitable for contamination prediction, including Random Forest, XGBoost, and Artificial Neural Networks. Utilize nested cross-validation to optimize hyperparameters and prevent overfitting [51] [54].
- Model Performance Assessment: Evaluate models using appropriate metrics for environmental contamination prediction, including R², root mean square error (RMSE), and mean absolute error (MAE). The Extra Trees model has demonstrated particularly strong performance in similar environmental applications, achieving R² = 0.96 and NSE = 0.93 in crop coefficient modeling [54].
Phase 2: SHAP Implementation and Interpretation
- SHAP Value Calculation: Compute SHAP values for the entire dataset using the appropriate variant (TreeSHAP for tree-based models, KernelSHAP for other models). For large datasets, calculate SHAP values on a representative subset to reduce computational burden [53].
- Global Interpretation Analysis: Generate summary plots to identify the most important features overall in predicting PAH contamination. Analyze feature importance rankings across multiple models to identify robust determinants of contamination [51] [53].
- Local Interpretation Analysis: Select individual samples (e.g., highly contaminated sites, false predictions) for detailed case study analysis using force plots and decision plots to understand specific prediction rationales [52].
- Interaction Effects Analysis: Implement SHAP interaction values to identify and quantify feature interactions that influence PAH contamination patterns, such as between organic matter content and specific land use practices [53].
Workflow Visualization
Quantitative Analysis of SHAP Performance
Benchmarking Studies Across Environmental Applications
Table 1: Performance Metrics of Interpretable Machine Learning Models in Environmental Science
| Application Domain | Best-Performing Model | Accuracy (R²) | Key Features Identified via SHAP | Reference |
|---|---|---|---|---|
| Soil Heavy Metal Risk Assessment | XGBoost | 93% | Cadmium (Cd), Mercury (Hg) | [51] |
| Drought Stress Classification | Random Forest | 92.3% | Specific bacterial marker taxa | [53] |
| Soybean Crop Coefficient Estimation | Extra Trees | 0.96 | Antecedent Kc, Solar Radiation | [54] |
| Frozen Soil Property Prediction | AutoML | 0.987 | Temperature, Strain Rate, Dry Density | [52] |
Impact of SHAP Analysis on Model Interpretation
Table 2: Comparison of Interpretation Methods for ML Models in Environmental Science
| Interpretation Method | Mathematical Foundation | Global Interpretation | Local Interpretation | Interaction Analysis | Implementation Complexity |
|---|---|---|---|---|---|
| SHAP | Game Theory (Shapley values) | Excellent (Summary plots) | Excellent (Force plots) | Good (Interaction values) | Medium |
| LIME | Local surrogate models | Limited | Excellent | Limited | Low |
| Partial Dependence Plots | Marginal probability | Good | Limited | Limited | Low |
| Permutation Importance | Feature permutation | Good | Limited | Limited | Low |
| Sobol Sensitivity | Variance decomposition | Good | Limited | Good | High |
Research Reagent Solutions for SHAP-Enhanced PAH Studies
Table 3: Essential Research Materials and Computational Tools for SHAP Analysis in PAH Research
| Research Reagent / Tool | Specification / Purpose | Application in PAH Contamination Studies |
|---|---|---|
| Soil Sampling Kits | HJ/T 166-2004 standard protocols | Standardized collection of contaminated soil samples for PAH analysis [51] |
| ICP-MS Apparatus | HJ 1315-2023 certified systems | Quantification of co-occurring heavy metals that may correlate with PAH contamination [51] |
| SHAP Python Library | Version 0.4.0+ with TreeExplainer | Calculation of SHAP values for tree-based models commonly used in environmental prediction [51] [53] |
| Tree-Based ML Algorithms | XGBoost, Random Forest implementations | High-performance models with native SHAP support for PAH concentration prediction [51] [54] |
| Visualization Tools | Matplotlib, Seaborn, Plotly | Generation of SHAP summary plots, dependence plots, and force plots for interpretation [51] [52] |
| Atomic Fluorescence Spectrometer | HJ 680-2013 compliant systems | Detection of mercury and other metallic indicators that may associate with PAH contamination profiles [51] |
Feature Engineering for Source Apportionment
Beyond basic contamination prediction, SHAP analysis enables sophisticated hypothesis generation regarding PAH sources and transport mechanisms:
- Molecular Ratio Features: Calculate diagnostic ratios of specific PAH compounds (e.g., Fluo/(Fluo+Pyr), BaA/(BaA+Chry)) as model inputs to capture chemical fingerprints of different contamination sources [51].
- Spatial Covariates: Incorporate distance-based features to potential point sources (industrial facilities, roadways), hydrological flow paths, and land use classifications to capture spatial determinants of PAH distribution.
- Soil Property Interactions: Create interaction terms between fundamental soil characteristics (organic carbon content, clay percentage, pH) and specific PAH compounds to capture retention and transformation dynamics.
Temporal SHAP Analysis for Trend Assessment
For longitudinal PAH contamination data, implement windowed SHAP analysis to track evolving feature importance over time:
Validation Framework for SHAP Findings
Cross-Validation with Traditional Methods
Establish rigorous validation protocols to ensure SHAP-derived insights align with established environmental science principles:
- Statistical Correlation Analysis: Compare SHAP feature rankings with results from traditional statistical methods (Pearson/Spearman correlation, principal component analysis) to identify consistent patterns [53].
- Domain Expert Evaluation: Convene panels of environmental scientists and contamination specialists to assess the plausibility and novelty of SHAP-identified feature importance rankings.
- Experimental Validation Design: Use SHAP-generated hypotheses to design targeted field sampling campaigns and laboratory experiments that test predicted relationships between soil characteristics and PAH concentrations.
Quantitative Stability Assessment
Implement computational checks to ensure the robustness of SHAP results:
- Bootstrap Stability Testing: Calculate SHAP values across multiple bootstrap resamples of the dataset to quantify the uncertainty in feature importance rankings.
- Model Class Consistency: Compare SHAP results across different model architectures (tree-based, neural networks, linear models) to identify robust insights versus model-specific artifacts.
- Feature Ablation Studies: Systematically remove top SHAP-identified features and measure performance degradation to confirm their functional importance to model accuracy.
This comprehensive framework for SHAP analysis in PAH contamination research provides both theoretical foundation and practical protocols, enabling environmental researchers to leverage cutting-edge interpretable machine learning while maintaining scientific rigor and generating actionable insights for contamination assessment and remediation planning.
Benchmarking Performance: Accuracy, Scalability, and Future Potential
The detection and identification of polycyclic aromatic hydrocarbons (PAHs) in contaminated soil represents a significant challenge in environmental monitoring. Traditional methods rely on experimental reference samples for calibration, which are unavailable for many hazardous pollutants and their transformation products [8]. A groundbreaking approach combines Density Functional Theory (DFT) with machine learning algorithms to overcome this limitation, creating a virtual library of spectral fingerprints for PAH identification [7]. This application note details the experimental protocols and presents quantitative validation data demonstrating strong similarity scores (>0.6) between DFT-calculated and experimental Surface-Enhanced Raman Spectroscopy (SERS) spectra, establishing the viability of this in silico method for accurate environmental analysis [7].
Experimental Protocols
The following diagram illustrates the integrated computational and experimental workflow for the in silico machine learning-enabled detection of PAHs.
Protocol 1: DFT Spectral Library Generation
Objective: To create a virtual library of Raman spectra for PAHs and their derivatives via computational modeling.
Step 1: Molecular Structure Definition
- Obtain or draw the molecular structures of target PAHs using computational chemistry software (e.g., GaussView, Avogadro).
- Include both parent compounds and known environmental derivatives.
Step 2: Quantum Chemical Calculation
- Apply Density Functional Theory (DFT) using software such as Gaussian ORCA.
- Utilize functionals (e.g., B3LYP) and basis sets (e.g., 6-311+G(d,p)) appropriate for organic molecules [7].
- Optimize all molecular geometries to their ground state.
- Calculate the vibrational frequencies and Raman activities.
Step 3: Spectrum Simulation
- Convert calculated Raman activities into predicted spectra.
- Apply a scaling factor to correct for systematic DFT errors and approximate the experimental conditions.
- Store the resulting spectra in a searchable database—the in silico spectral library.
Protocol 2: Soil Sample Preparation and SERS Measurement
Objective: To acquire high-quality experimental SERS spectra from contaminated soil samples.
Step 1: Soil Sampling and Pre-processing
- Collect soil samples using standard coring techniques.
- Air-dry samples and homogenize using a sterile mortar and pestle.
- Sieve to a fine particle size (<2 mm) to ensure consistency.
Step 2: PAH Extraction
- Extract PAHs from soil using pressurized solvent extraction or sonication with dichloromethane or hexane [55].
- Concentrate the extract under a gentle stream of nitrogen.
Step 3: Surface-Enhanced Raman Spectroscopy (SERS)
- Prepare SERS-active substrates (e.g., gold or silver nanoshells) designed to enhance the Raman signal [8].
- Deposit the concentrated soil extract onto the SERS substrate.
- Acquire Raman spectra using a spectrometer equipped with a laser excitation source (e.g., 785 nm).
- Collect multiple spectra from different spots on the substrate to account for heterogeneity.
Protocol 3: Machine Learning-Enabled Spectral Matching
Objective: To identify PAHs in soil samples by matching experimental SERS spectra to the in silico library.
Step 1: Characteristic Peak Extraction (CaPE)
- Input the raw experimental SERS spectrum into the CaPE algorithm.
- This physics-informed machine learning algorithm isolates distinctive, analyte-specific spectral features while filtering out broad background interference and noise [7].
Step 2: Characteristic Peak Similarity (CaPSim)
- Input the purified characteristic peaks from CaPE into the CaPSim algorithm.
- The algorithm compares these features against the virtual DFT spectral library.
- It calculates a similarity score (ranging from 0 to 1) for each potential match, robust to spectral shifts and amplitude variations [7].
Step 3: Identification and Validation
- Assign a positive identification for similarity scores exceeding a validated threshold (e.g., >0.6) [7].
- Confirm the results using a separate validation set with known standards, if available.
Quantitative Data and Validation
Similarity Score Validation
The core validation of this method lies in the strong quantitative agreement between DFT-calculated and experimental SERS spectra. The table below summarizes similarity scores for multiple PAHs, demonstrating the efficacy of the approach.
Table 1: Similarity Scores Between DFT-Calculated and Experimental SERS Spectra for Select PAHs
| Polycyclic Aromatic Hydrocarbon (PAH) | Similarity Score | Validation Level |
|---|---|---|
| Benz(a)anthracene | >0.6 | High Confidence |
| Chrysene | >0.6 | High Confidence |
| Benzo(b)fluoranthene | >0.6 | High Confidence |
| Benzo(k)fluoranthene | >0.6 | High Confidence |
| Benzo(a)pyrene | >0.6 | High Confidence |
The consistency of similarity scores exceeding 0.6 across multiple PAHs confirms that DFT-calculated spectra serve as reliable references for identification, even in the absence of experimental standards [7]. This benchmark indicates that the method accurately discriminates between different analytes in a complex soil matrix.
Comparative Method Performance
The in silico ML method addresses critical limitations of traditional analysis. The following table compares key features against standard chromatographic techniques.
Table 2: Comparison of PAH Detection Methods
| Analytical Feature | Traditional GC-MS/MS | In Silico ML SERS |
|---|---|---|
| Requires Physical Standards | Yes [56] [55] | No [8] [7] |
| Detection Limit | ~1.3 μg/kg [55] | Minute traces [8] |
| Analysis Time | Hours to days [55] | Minutes (post-setup) [8] |
| Identifies Unknown Derivatives | Limited | Yes [8] [7] |
The Scientist's Toolkit
This section lists key reagents, software, and equipment essential for implementing the described protocols.
Table 3: Research Reagent Solutions and Essential Materials
| Item | Function/Application |
|---|---|
| Gold or Silver Nanoshells | SERS-active substrate; enhances Raman signal for sensitive detection [8]. |
| Dichloromethane | Organic solvent for efficient extraction of PAHs from soil matrices [55]. |
| DFT Software (Gaussian, ORCA) | Performs quantum chemical calculations to generate predicted Raman spectra [7]. |
| CaPE & CaPSim Algorithms | Machine learning pipeline for processing and matching spectral data [7]. |
| Florisil SPE Cartridge | Solid-phase extraction material for cleaning complex samples [56]. |
| GC-MS/MS System | Reference instrument for traditional, standards-dependent validation [56] [55]. |
The validated protocol for in silico machine learning-enabled detection of PAHs, supported by strong DFT-experimental similarity scores (>0.6), represents a paradigm shift in environmental analysis [7]. This approach eliminates the dependency on hard-to-obtain physical standards, enabling the identification of a broader range of environmental contaminants, including previously uncharacterized transformation products [8]. The integration of DFT-calculated spectral libraries with robust machine learning algorithms like CaPE and CaPSim provides a powerful, generalizable framework that can be extended to other classes of environmental pollutants.
The accurate detection of polycyclic aromatic hydrocarbons (PAHs) in contaminated soil is a critical challenge in environmental science and public health. Traditional analytical methods often rely on experimental reference samples, which are unavailable for many hazardous pollutants and their transformation products. In silico machine learning represents a paradigm shift, using computational power to predict molecular signatures and identify contaminants without physical reference standards. This application note frames a comparative analysis of machine learning models—Random Forest (RF), Support Vector Machine (SVM), XGBoost, and Ensemble Stacking—within the context of a broader thesis on advanced environmental monitoring. We provide detailed protocols and performance data to guide researchers in developing robust PAH detection systems.
Comparative Performance Analysis
Quantitative Model Performance
Performance metrics across various domains, including environmental science, healthcare, and education, provide a benchmark for expected model efficacy in PAH detection. The following table summarizes key findings from recent studies.
Table 1: Comparative Performance of Machine Learning Models Across Various Studies
| Study / Domain | Model(s) | Reported Accuracy | Key Performance Notes |
|---|---|---|---|
| Liver Cancer Diagnosis (Gene Expression) [57] | Stacking (MLP, RF, KNN, SVM meta-learner: XGBoost) | 97% | Also demonstrated sensitivity of 96.8% and specificity of 98.1%. [57] |
| Diabetes Prediction (PIMA Dataset) [58] | Stacked Ensemble (RF, XGBoost, etc.) | 92.91% | Ensemble outperformed individual base models. [58] |
| Early Student Performance Prediction [59] | LightGBM (Best Base Model) | AUC = 0.953, F1 = 0.950 | Gradient boosting outperformed Random Forest. [59] |
| Early Student Performance Prediction [59] | Stacking Ensemble | AUC = 0.835 | Stacking did not offer a significant improvement over the best base model and showed instability. [59] |
| Iris Dataset (General ML Benchmark) [60] | Random Forest (Bagging) | Test Accuracy: 0.8947 | Performance can vary on small datasets. [60] |
| Iris Dataset (General ML Benchmark) [60] | AdaBoost & Gradient Boosting | Test Accuracy: 0.9737 | Boosting demonstrated superior performance on this benchmark task. [60] |
Performance Trends and Insights
- Ensemble Advantage: Stacking ensembles consistently achieve high accuracy (e.g., 97% in liver cancer diagnosis) by leveraging the strengths of diverse base models [57] [58].
- Boosting Power: Gradient boosting methods (XGBoost, LightGBM) often outperform other algorithms, including Random Forest, on structured/tabular data by sequentially correcting errors [59] [60].
- Context is Key: Stacking does not always guarantee superior performance and can sometimes be outperformed by a single well-tuned model, highlighting the need for rigorous, context-specific validation [59].
Experimental Protocols
Core Protocol: In Silico Machine Learning for PAH Detection in Soil
This protocol is adapted from the innovative workflow developed by researchers at Rice University for detecting PAHs and their derivatives in contaminated soil using a physics-informed machine learning pipeline [8] [7].
Table 2: Research Reagent Solutions for PAH Detection Workflow
| Item | Function / Description |
|---|---|
| Surface-Enhanced Raman Spectroscopy (SERS) | A light-based imaging technique that analyzes unique "chemical fingerprint" patterns (spectra) emitted when molecules interact with light. Nanoshells are used to enhance spectral traits. [8] [7] |
| Density Functional Theory (DFT) | A computational modeling technique used to predict the theoretical Raman spectra of PAH molecules based solely on their molecular structure, creating a virtual spectral library. [8] [7] |
| Characteristic Peak Extraction (CaPE) Algorithm | A machine learning algorithm designed to isolate distinctive, relevant spectral features from the complex SERS data, filtering out noise and background interference. [7] |
| Characteristic Peak Similarity (CaPSim) Algorithm | A second-stage ML algorithm that matches the extracted spectral features from CaPE to the theoretical spectra in the DFT library to identify specific PAH analytes. [7] |
| Soil Samples | Contaminated soil from a restored watershed and natural area, artificially contaminated with specific PAHs for method validation. [8] |
Workflow Steps:
- Sample Preparation: Collect and prepare surface soil samples. For validation, use both artificially contaminated samples and a control sample [8].
- Spectral Acquisition: Use Surface-enhanced Raman Spectroscopy (SERS) to obtain spectral data from the soil samples. This technique enhances the relevant traits in the spectra [8] [7].
- Generate Theoretical Library: Use Density Functional Theory (DFT) to computationally calculate and generate a virtual library of spectral "fingerprints" for a wide range of PAHs and their derivative compounds (PACs) [8] [7].
- Feature Extraction: Apply the Characteristic Peak Extraction (CaPE) machine learning algorithm to the raw SERS spectra to parse and isolate relevant spectral traits [7].
- Analyte Identification: Use the Characteristic Peak Similarity (CaPSim) algorithm to match the extracted features from step 4 against the virtual DFT library from step 3 to identify the specific PAHs and PACs present in the sample [7].
- Validation: Validate the method's reliability by testing on soil samples with known contamination and comparing results against conventional techniques [8].
Figure 1: In Silico ML Workflow for PAH Detection. This diagram outlines the core protocol for detecting soil contaminants using a physics-informed machine learning approach, integrating experimental data with a computationally generated spectral library [8] [7].
Protocol for Building a Stacking Ensemble Classifier
This general protocol can be adapted to combine predictions from various base models for a classification task, such as identifying the presence of high-risk PAHs.
Workflow Steps:
- Data Preparation: Split the dataset into training and testing sets. It is critical to use cross-validation (e.g., 5-fold) within the training set to generate meta-features for the meta-learner to prevent data leakage [59] [61].
- Define Base Models (Level-0): Select a diverse set of algorithms. A common and effective combination includes:
- Define Meta-Model (Level-1): Choose a relatively simple algorithm that will learn to best combine the base models' predictions. Logistic Regression is a popular and effective choice due to its simplicity and tendency not to overfit the meta-features [61] [60]. XGBoost can also be used as a more powerful meta-learner [57] [61].
- Train Base Models: Train all base models on the same training dataset.
- Generate Meta-Features: Use the trained base models and cross-validation to make predictions on the training data (the hold-out folds). These predictions form the new training dataset (meta-features) for the meta-model [62].
- Train Meta-Model: Train the chosen meta-model (e.g., Logistic Regression) on the dataset of meta-features.
- Final Prediction: To make a prediction on new, unseen test data, the base models first make their individual predictions. These predictions are then fed as input to the trained meta-model, which produces the final ensemble prediction [62] [61].
Figure 2: Stacking Ensemble Architecture. The stacking ensemble uses predictions from diverse base models (Level-0) as input features for a meta-model (Level-1), which learns the optimal combination for final prediction [62] [61] [60].
The advent of in silico machine learning (ML) frameworks has revolutionized the detection of polycyclic aromatic hydrocarbons (PAHs) in soil. These frameworks overcome the limitations of traditional analytical methods, which often require pure reference standards for each target compound. As demonstrated in foundational PAH research, the core methodology combines spectroscopic techniques with a virtual library of theoretical chemical signatures and specialized ML algorithms to identify contaminants without relying on experimental reference samples [8] [7]. This application note details how this established framework is inherently scalable and can be systematically adapted for the detection of a broader spectrum of environmental pollutants, thereby significantly enhancing the capabilities of environmental monitoring and risk assessment.
Scalable Machine Learning Framework: Core Components and Workflow
The framework's power and scalability stem from its core components, which can be modified or extended to target new classes of pollutants. The foundational PAH research established a physics-informed ML pipeline that integrates Surface-enhanced Raman Spectroscopy (SERS) with a spectral library generated in silico using Density Functional Theory (DFT) [7] [16]. This approach bypasses the need for physical reference samples, a major bottleneck in environmental analysis.
The workflow, depicted in the diagram below, involves two key ML algorithms: the Characteristic Peak Extraction (CaPE) algorithm, which isolates distinctive spectral features from complex sample data, and the Characteristic Peak Similarity (CaPSim) algorithm, which robustly matches these features to the in silico library for identification [16].
Target Pollutant Classes and Quantitative Performance
The framework established for PAHs is directly applicable to a wide range of other environmental contaminants. The table below summarizes key pollutant classes, their specific detection challenges, and the adapted computational approaches required for their identification.
Table 1: Target Pollutant Classes for the Scalable ML Framework
| Pollutant Class | Specific Examples | Key Detection Challenges | Proposed ML & Computational Adaptations |
|---|---|---|---|
| Polycyclic Aromatic Hydrocarbons (PAHs) | Pyrene, Anthracene [16] | Complex soil matrix interference, lack of reference spectra for derivatives [8] | DFT-calculated spectra library; CaPE & CaPSim algorithms for feature matching [16] |
| Per-/Polyfluoroalkyl Substances (PFAS) | PFOA, PFOS | Structural diversity, trace-level concentrations, complex environmental transformation pathways | Expand in silico library with diverse PFAS structures; optimize DFT for fluorine-rich molecules [63] |
| Pharmaceuticals & Personal Care Products (PPCPs) | Antibiotics, analgesics | High polarity, complex transformation products, low concentrations in water | Integrate liquid chromatography-MS data; develop hybrid spectral-compositional models |
| Pesticides & Herbicides | Atrazine, Glyphosate | Wide variety of functional groups and degradation products | Include 3D conformational analysis in DFT; model characteristic heteroatom signatures (e.g., P, Cl) |
| Heavy Metals | Arsenic, Lead, Chromium | Elemental speciation determines toxicity and mobility | Couple with X-ray spectroscopy; ML models to interpret oxidation state from spectral shifts |
The performance of ML models in environmental prediction tasks is well-established. For instance, in predictive toxicology, models like the Knowledge-guided Pre-trained Graph Transformer (KPGT) have achieved an Area Under the Curve (AUC) of 0.83 for predicting the carcinogenicity of pollutants, outperforming traditional models [64]. Similarly, ensemble models like Random Forest have demonstrated high accuracy (R² up to 0.89) in forecasting air quality indices, confirming the robustness of ML approaches for diverse environmental data types [65].
Detailed Experimental Protocol for Framework Application
This protocol provides a step-by-step guide for applying the scalable in silico ML framework to a new class of environmental pollutants, using the detection of PFAS in water as an exemplar.
Phase 1:In SilicoLibrary Development
Pollutant Selection and Structural Digitization:
- Curate a list of target pollutants and their known environmental transformation products from databases like the EPA CompTox Chemistry Dashboard [64].
- Obtain or draw the 2D/3D molecular structures of these compounds in standard formats (e.g., SMILES, InChI) using cheminformatics tools like RDKit [64].
Theoretical Spectral Calculation:
- Use Density Functional Theory (DFT) computational modeling software (e.g., Gaussian, ORCA) to calculate the theoretical Raman spectra for each structure in the digital library.
- Optimization Note: For new pollutant classes like PFAS, calibration of DFT functional and basis sets may be required using any available experimental spectra for validation [7].
Phase 2: Sample Processing and Spectral Acquisition
Sample Preparation:
- For Water Samples: Solid-phase extraction (SPE) is recommended to concentrate target PFAS. Elute the analytes using a solvent compatible with SERS analysis, such as methanol or acetone, and evaporate to dryness under a gentle nitrogen stream. Reconstitute the residue in a minimal volume (e.g., 20 µL) of acetone [16].
Substrate Preparation and Spectral Acquisition:
- Use plasmonic nanoparticles, such as gold-coated silica nanoshells, as the SERS substrate to enhance the Raman signal [16].
- Deposit the reconstituted sample onto the SERS substrate via drop-drying.
- Acquire SERS spectra using a Raman spectrometer with a 785 nm laser. Collect approximately 25 spectra from different regions of the substrate to account for spatial heterogeneity and ensure statistical robustness [16].
Phase 3: Machine Learning-Enabled Identification
Spectral Pre-processing:
- Apply the Characteristic Peak Extraction (CaPE) algorithm to the raw SERS spectra. This physics-informed ML algorithm isolates distinctive, analyte-specific spectral features while filtering out background noise and matrix interference [16].
Pattern Matching and Identification:
- Input the CaPE-processed spectral features into the Characteristic Peak Similarity (CaPSim) algorithm.
- The CaPSim algorithm calculates a similarity score (values > 0.6 indicate strong matches) by comparing the sample's features against the pre-computed in silico library of DFT-calculated spectra [16].
- Pollutants are identified based on the highest similarity scores, providing a confident identification even without a physical reference standard.
The Scientist's Toolkit: Essential Research Reagents and Materials
The following table lists key reagents, materials, and software essential for implementing the described framework.
Table 2: Essential Research Reagents and Computational Tools
| Category | Item | Function / Application | Exemplars / Notes |
|---|---|---|---|
| Analytical Instrumentation | SERS Spectrometer | Acquires enhanced Raman signals from trace-level analytes | Systems with 785 nm laser excitation are ideal [16]. |
| SERS Substrate | Enhances the Raman signal of target molecules | Gold-silica nanoshells; reproducible, commercial substrates [16]. | |
| Laboratory Reagents | Extraction Solvents | Extracts pollutants from environmental matrices | Acetone, Methanol, Dichloromethane. Acetone offers low spectral interference [16]. |
| Internal Standards | Corrects for extraction and instrumental variance | Isotope-labeled analogs of target analytes (e.g., ¹³C-PCBs) [66]. | |
| Computational Software | DFT Calculation Suite | Predicts theoretical Raman spectra from molecular structure | Gaussian, ORCA; requires high-performance computing [7]. |
| Cheminformatics Library | Handles molecular structure and descriptor calculation | RDKit (open-source) for parsing SMILES and generating molecular fingerprints [64]. | |
| Machine Learning Algorithms | Identifies patterns and matches spectral features | Random Forest, XGBoost, and custom algorithms like CaPE and CaPSim [67] [16] [63]. | |
| Data Resources | Chemical Databases | Provides molecular structures and toxicological data | EPA CompTox Chemistry Dashboard, PubChem, T3DB [64]. |
| Spectral Libraries | Serves as a reference for validation | In silico libraries generated via DFT; experimental libraries (e.g., NIST) for calibration [7]. |
The in silico ML framework for PAH detection represents a paradigm shift in environmental analytics, moving from a reliance on physical standards to a predictive, computation-based approach. Its core architecture—integrating theoretical spectral prediction with robust, physics-informed machine learning—is inherently scalable. As demonstrated, this framework can be systematically extended to a multitude of other critical pollutant classes, from PFAS to pesticides. This scalability promises to address a critical gap in environmental monitoring, ultimately providing a powerful and versatile tool for comprehensive public health risk assessment in the face of evolving chemical threats.
Conventional methods for detecting polycyclic aromatic hydrocarbons (PAHs) in soil, particularly gas chromatography-mass spectrometry (GC-MS), face two significant limitations: the dependency on physically available reference standards for compound identification and the confinement of analysis to laboratory settings. These challenges hinder the ability to identify novel or transformed pollutants and conduct rapid, on-site environmental monitoring. A novel methodology integrating surface-enhanced Raman spectroscopy (SERS) with in silico machine learning (ML) presents a transformative solution. This approach leverages a virtual library of spectral fingerprints, calculated using density functional theory (DFT), to accurately identify PAHs without analytical reference samples. Combined with portable SERS instrumentation, this technology enables precise, on-site detection of soil contaminants, representing a significant advancement for environmental science and public health protection [8] [16].
The Core Technological Advantage: In Silico Reference Libraries
The foundational innovation of this method is the replacement of physical reference standards with a computationally generated spectral library.
- Virtual Spectral Library: Density functional theory (DFT), a computational modeling method, is used to predict the Raman spectra of PAH molecules based solely on their molecular structure. This process generates a comprehensive library of "chemical fingerprints" for a vast range of known PAHs, including their derivatives and compounds that are challenging to synthesize or isolate in a lab [8] [16] [7].
- Overcoming the Reference Sample Bottleneck: Traditional GC-MS analysis requires a physical sample of each target compound to create a reference spectrum for identification. For many emerging or transformed environmental pollutants, these reference materials are commercially unavailable or prohibitively expensive to produce. The in silico library effectively eliminates this requirement, enabling the identification of chemicals that lack experimental data [8].
This paradigm shift is summarized in the table below, which compares the key features of conventional and novel approaches.
Table 1: Comparison of Conventional GC-MS and the In Silico ML-Enabled SERS Approach
| Feature | Conventional GC-MS | In Silico ML-Enabled SERS |
|---|---|---|
| Reference Library | Experimental, requires physical reference samples [68] | In silico, generated via DFT calculations [16] [7] |
| Identification of Unavailable Compounds | Not possible without synthesis/isolation [8] | Possible via theoretical spectral prediction [8] [16] |
| Field Deployment | Limited; requires laboratory infrastructure [68] | Enabled with portable Raman systems [8] [68] |
| Analysis Time | Hours to days (including transport and prep) [68] | Minutes to hours for on-site analysis [68] |
| Primary Limitation | Inability to identify compounds without a reference standard [8] | Reliance on accurate theoretical modeling and signal processing |
The Machine Learning Pipeline: CaPE and CaPSim Algorithms
Translating a raw SERS signal from a complex soil sample into a reliable identification requires a robust machine learning pipeline designed to handle spectral noise and interference. This pipeline operates in two key stages [16]:
- Characteristic Peak Extraction (CaPE): This algorithm processes the complex SERS spectra obtained from soil extracts to isolate the distinctive, analyte-specific spectral features from the background matrix interference. The soil organic matter creates a highly complex SERS spectral background, and CaPE is crucial for isolating the relevant peaks of the PAHs [16].
- Characteristic Peak Similarity (CaPSim): The CaPE-processed experimental spectrum is then quantitatively compared to the CaPE-processed theoretical Raman spectra from the DFT library. This algorithm is highly robust to spectral shifts and amplitude variations, providing a reliable similarity score for identification. Validation studies have shown strong similarity values (>0.6) between DFT-calculated and experimental SERS spectra for multiple PAHs, confirming the accuracy of this approach [16] [7].
The following diagram illustrates the complete workflow, from sample preparation to final identification.
Protocol for In Silico ML-Enabled Detection of PAHs in Soil
Materials and Equipment
Table 2: Research Reagent Solutions and Essential Materials
| Item | Function/Description |
|---|---|
| SERS Substrate | SiO2 core-Au shell nanoparticles (nanoshells). The Au shell provides surface plasmon resonance that enhances the Raman signal of target analytes [16]. |
| Extraction Solvent | Acetone. Effectively recovers PAHs from soil while generating a simpler Raman background signal compared to solvents like toluene or dichloromethane [16]. |
| Portable Raman Spectrometer | A spectrometer with a 785 nm laser excitation, chosen to match the plasmon resonance of the nanoshell substrates for optimal signal enhancement [16] [68]. |
| DFT Computational Software | Software for performing density functional theory calculations to generate the ground-truth theoretical Raman spectra for the virtual library [16]. |
| Machine Learning Platform | A computing environment (e.g., Python with relevant libraries) to run the CaPE and CaPSim algorithms for spectral processing and identification [16]. |
Detailed Experimental Workflow
Step 1: Soil Sampling and Contamination Collect soil samples from the area of interest. For method validation, pristine soil can be artificially contaminated with target PAHs (e.g., pyrene, anthracene). Seal the PAH-soil mixture, shake for 2 minutes to ensure absorption, and allow it to dry at room temperature until the solvent fully evaporates [16].
Step 2: PAH Extraction from Soil Two extraction methods are validated, with room-temperature filtration presented as a practical, equipment-free alternative:
- Accelerated Solvent Extraction (ASE): Use standardized high-pressure/temperature conditions.
- Filtration Extraction: Add acetone to the soil sample, shake or vortex to mix, and filter the solution. Research demonstrates this low-energy method provides results comparable to ASE for PAH recovery [16].
Step 3: SERS Substrate Preparation and Measurement
- Deposit a 20 µL aliquot of the filtered acetone extract onto the nanoshell-based SERS substrate by drop-drying [16].
- Using a portable Raman spectrometer with a 785 nm laser, collect approximately 25 spectra from different regions of the substrate to account for spatial heterogeneity and ensure representative sampling [16].
Step 4: Data Processing and ML-Driven Identification
- Process the collected raw SERS spectra using the Characteristic Peak Extraction (CaPE) algorithm to isolate the distinctive spectral features of PAHs from the complex background [16].
- Compare the CaPE-processed spectrum against the in silico DFT library using the Characteristic Peak Similarity (CaPSim) algorithm.
- A CaPSim similarity score exceeding 0.6 indicates a confident identification of the target PAH, as validated in controlled studies [16] [7].
Data Presentation and Analysis
The method's effectiveness is demonstrated through its ability to detect specific PAHs at varying concentrations and in mixtures, without physical separation.
Table 3: Characteristic SERS Peaks for Target PAHs
| PAH Analyte | Characteristic SERS Peaks (cm⁻¹) | Assignment |
|---|---|---|
| Pyrene (PYR) | 408, 590, 1250, 1408 | C-C stretch, C-C skeletal stretch, C-C stretch/CH in-plane bending, C-C stretch/ring stretch [16] |
| Anthracene (ANTH) | 392, 754, 1539 | C-C skeletal deformation, C-C skeletal stretch, C-C stretch [16] |
Validation experiments confirm the method's capability for mixture analysis. The SERS spectrum of a PYR-ANTH mixture is a linear superposition of the individual components' characteristic peaks, indicating the PAHs adsorb independently onto the SERS substrate and can be distinguished simultaneously without physical separation [16]. The following diagram conceptualizes the advantage of the ML pipeline over a simple spectral comparison.
The integration of SERS with in silico machine learning creates a powerful analytical framework that surmounts two critical limitations of conventional GC-MS. By replacing physical reference standards with a computationally generated spectral library, it enables the detection and identification of a much broader range of environmental pollutants, including those that are previously unstudied. Furthermore, the compatibility of this analytical approach with portable Raman instrumentation shifts the paradigm from centralized laboratory analysis to rapid, on-site field deployment. This combined advancement provides researchers and environmental agencies with a robust, scalable, and practical tool for the accurate assessment and monitoring of PAH contamination in soil, thereby significantly enhancing public health risk mitigation and environmental remediation efforts.
Application Note: Advanced Detection and Analysis of PAHs in Soil
Polycyclic aromatic hydrocarbons (PAHs) are persistent organic pollutants comprising fused aromatic rings, originating predominantly from incomplete combustion of fossil fuels and other industrial processes such as coking [69] [70]. Their presence in soil ecosystems poses significant ecological and human health risks, including carcinogenicity, mutagenicity, and association with various diseases including liver conditions and cardiovascular problems [69] [71]. This application note details integrated methodologies for detecting PAHs, assessing their ecological impact on soil microbial communities, and evaluating associated human health risks, with particular emphasis on a novel machine learning-enabled detection strategy.
In Silico Machine Learning-Enabled Detection Protocol
A groundbreaking approach developed by Rice University researchers leverages machine learning (ML) and surface-enhanced Raman spectroscopy (SERS) to identify PAHs in soil without requiring physical reference samples [8]. This method is particularly valuable for detecting unknown or transformed PAH derivatives.
Workflow: Machine Learning-Enabled PAH Detection
The following diagram illustrates the integrated computational and analytical workflow for detecting PAHs without experimental reference standards.
Key Materials and Equipment
Table 1: Essential Research Reagent Solutions for ML-Enabled PAH Detection
| Item | Function/Description | Application Note |
|---|---|---|
| Surface-Enhanced Raman Spectroscopy (SERS) System | Analyzes light-molecule interactions to generate unique spectral "fingerprints" | Custom-designed signature nanoshells enhance relevant spectral traits [8] |
| Density Functional Theory (DFT) Computational Model | Predicts theoretical spectra based on molecular structure | Generates virtual library of spectral fingerprints for PAHs/PACs without experimental data [8] |
| Characteristic Peak Extraction Algorithm | Machine learning algorithm parses relevant spectral traits in soil samples | Identifies key spectral features from complex sample data [8] |
| Characteristic Peak Similarity Algorithm | Second ML algorithm matches sample spectra to theoretical library | Enables identification of unknown or transformed PAH compounds [8] |
Analytical Chemistry Methods for PAH Analysis
Traditional chromatographic methods remain essential for validation and targeted quantification of specific PAH compounds.
Protocol: Gas Chromatography-Mass Spectrometry (GC-MS) Analysis
This protocol consolidates the analysis of PAHs and other contaminants like PCBs into a single GC-MS method, based on Thermo Fisher Scientific application notes [72].
Sample Preparation (Modified QuEChERS Extraction):
- Extraction: Extract soil samples using acetonitrile with salt-based partitioning (e.g., magnesium sulfate for salting-out).
- Clean-up: Employ dispersive solid-phase extraction (d-SPE) with sorbents such as C18 or primary secondary amine (PSA) to remove matrix interferences.
- Concentration: Evaporate extracts under gentle nitrogen stream and reconstitute in appropriate solvent (e.g., hexane or toluene) compatible with GC-MS injection.
Instrumental Analysis (GC-MS):
- GC Column: Use a mid-polarity stationary phase column (e.g., 5% phenyl polysilphenylene-siloxane) capable of separating PAH isomers.
- Oven Program: Employ a temperature ramp from 60°C (1-2 min hold) to 330°C at a controlled rate to resolve higher molecular weight PAHs.
- Injection: Pulsed splitless injection (e.g., 250°C) to ensure efficient transfer of higher mass PAHs prone to poor peak shape.
- MS Detection: Operate in Selected Ion Monitoring (SIM) mode for enhanced sensitivity, targeting characteristic molecular ions for each PAH and PCB congener.
Quality Control:
- Include procedural blanks, matrix spikes, and continuing calibration verification every 10-12 samples.
- Monitor internal standard response for extraction efficiency correction.
Magnetic Ionic Liquids (MILs) for PAH Extraction
MILs provide an efficient, reusable alternative for extracting PAHs from aqueous environments or soil extracts [70].
Synthesis of [P₆₆₆₁₄]₂[CoCl₄] MIL:
- Combine trihexyltetradecylphosphonium chloride ([P₆₆₆₁₄][Cl]) with cobalt chloride hexahydrate (CoCl₂·6H₂O) in a 2:1 molar ratio in ethanol.
- Stir mixture at room temperature for 24 hours under inert atmosphere.
- Remove solvent under vacuum to yield viscous blue liquid [P₆₆₆₁₄]₂[CoCl₄].
- Characterize product using FT-IR, elemental analysis, and thermogravimetric analysis (TGA).
Extraction Procedure:
- Adjust sample pH to 2 using dilute HCl.
- Add NaCl to 7.5% (w/v) ionic strength.
- Add 15 mg of [P₆₆₆₁₄]₂[CoCl₄] MIL per sample.
- Extract for 60 minutes with continuous mixing.
- Separate MIL phase magnetically from aqueous phase.
- For reuse, wash MIL with appropriate solvent (e.g., methanol) to desorb PAHs, confirming extraction efficiency remains >99% after five cycles [70].
Ecological Impact Assessment: Microbial Community Response
Soil microbial communities serve as sensitive indicators of PAH contamination and play crucial roles in natural attenuation through biodegradation.
Microbial Community Analysis Protocol
Experimental Design (Microcosm):
- Collect pristine surface soil (0-20 cm depth) from agricultural area.
- Sieve through 2 mm mesh to remove stones and plant debris.
- Spike soil with model PAHs: naphthalene (NAP), phenanthrene (PHE), and pyrene (PYR) at concentrations of 1, 10, and 100 mg kg⁻¹.
- Incubate microcosms at controlled temperature (e.g., 25°C) and moisture for 32 days, sacrificing replicates at days 0, 2, 4, 8, 16, and 32 for analysis [73].
Molecular Analysis:
- DNA Extraction: Extract total genomic DNA from soil samples using commercial kit (e.g., PowerSoil DNA Isolation Kit).
- High-Throughput Sequencing: Amplify 16S rRNA gene (V3-V4 region) for bacteria and ITS region for fungi using primer sets 338F/806R and ITS1F/ITS2R, respectively. Sequence on Illumina MiSeq platform.
- Bioinformatic Processing: Process raw sequences using QIIME2 or Mothur pipelines. Cluster sequences into operational taxonomic units (OTUs) at 97% similarity threshold.
- Quantitative PCR (qPCR): Quantify PAH-degrading genes using specific primers:
- nahAc (Gram-negative bacteria): Forward 5'-TGGCGAGCTGAACTGCAT-3', Reverse 5'-CGGTAGAGCGTCCTTGAA-3'
- nidA (Gram-positive bacteria): Forward 5'-GAGCTGGAGATGATCAAC-3', Reverse 5'-GTACTTGTCGTTGCTCAC-3'
- phe (phenol monooxygenase): Forward 5'-GGYATGCGYCCHGGYCAY-3', Reverse 5'-GCRTGRTGRTCSAGYTG-3'
Data Analysis:
- Calculate alpha-diversity indices (Shannon, Chao1) for microbial diversity.
- Perform principal coordinates analysis (PCoA) based on Bray-Curtis dissimilarity for community structure differences.
- Construct co-occurrence networks using Molecular Ecological Network Analysis Pipeline (MENAP) with Random Matrix Theory-based threshold detection.
Key Findings on Microbial Community Response
Table 2: Microbial Community Responses to PAH Contamination in Soil
| Parameter | Findings | Significance |
|---|---|---|
| PAH Dissipation Rates | NAP: 94.36%; PHE: 72.60%; PYR: 47.70% over 32 days [73] | Demonstrates soil self-purification capacity; rate decreases with increasing PAH molecular weight |
| Bacterial Community Shifts | Significant enrichment of Actinobacteria (Mycobacterium, Rhodococcus, Nocardioides) [73] | Identifies keystone PAH-degrading taxa; essential for natural attenuation and bioremediation strategies |
| Fungal Community Response | Reduced richness inside coking plant; increased competitive relationships [74] | Fungi adopt competition-based survival strategy under combined PAH-PTE stress |
| Gene-Specific Responses | nahAc enriched with NAP; nidA and phe upregulated under PHE/PYR stress [73] | Substrate-specific genetic responses inform biomarker selection for monitoring remediation |
| Microbial Interaction Networks | Bacterial networks show cooperation (co-occurrence); fungal networks show competition (co-exclusion) [74] | Reveals different ecological strategies; bacterial cooperation may enhance biodegradation potential |
Biomedical Risk Assessment
Epidemiological studies reveal significant associations between PAH exposure and human health outcomes, particularly liver disease.
Protocol: Epidemiological Risk Assessment for PAH-Related Health Outcomes
This protocol is based on cross-sectional analysis of the China Health and Retirement Longitudinal Study (CHARLS) database [71].
Data Collection:
- PAH Exposure Assessment: Estimate ambient PAH concentrations using regulatory monitoring data or modeling approaches for 16 EPA-priority PAHs across multiple geographic regions.
- Health Outcome Data: Collect self-reported liver disease diagnoses through standardized questionnaires, confirming with medical records where possible.
- Covariate Data: Document demographic (age, sex, location), socioeconomic (education, income), and behavioral factors (smoking, alcohol consumption, medication use).
Statistical Analysis:
- Model Building: Employ multivariable logistic regression with progressive adjustment:
- Model 1: Adjusted for age and sex
- Model 2: Additionally adjusted for socioeconomic status
- Model 3: Additionally adjusted for behavioral factors (smoking, alcohol)
- Effect Modification: Conduct stratified analyses by age, sex, and behavioral factors to identify susceptible subpopulations.
- Sensitivity Analysis: Perform multiple testing corrections and assess model fit using standard diagnostics.
Quantitative Risk Estimates for PAH-Associated Liver Disease
Table 3: Association Between Specific PAHs and Liver Disease Risk Based on CHARLS Data [71]
| PAH Compound | Odds Ratio (OR) | 95% Confidence Interval | Statistical Significance (p-value) |
|---|---|---|---|
| Fluorene | 1.13 | 1.01 - 1.26 | p < 0.05 |
| Anthracene | 1.30 | 1.04 - 1.62 | p < 0.05 |
| Fluoranthene | 1.04 | 1.00 - 1.08 | p < 0.05 |
| Benz[a]anthracene | 1.02 | 1.00 - 1.04 | p < 0.05 |
| Benzo[k]fluoranthene | 1.05 | 1.00 - 1.11 | p < 0.05 |
| Benzo[a]pyrene | 1.04 | 1.00 - 1.08 | p < 0.05 |
| Acenaphthylene | 0.73 | 0.58 - 0.92 | p < 0.05 |
Integrated Risk Assessment Framework
The Interstate Technology and Regulatory Council (ITRC) provides guidance for evaluating risks at petroleum-contaminated sites, emphasizing that complete remediation to generic criteria is often infeasible [75]. A tiered approach is recommended:
Tier 1: Screening against default regulatory levels Tier 2: Site-specific modification of screening levels Tier 3: Complete site-specific risk assessment considering all exposure pathways
This framework acknowledges that while indicator compounds (e.g., benzene, naphthalene) may degrade below concern levels, broader TPH fractions and transformation products may still pose risks, necessitating comprehensive assessment integrating both chemical and biological data [75].
This application note provides integrated methodologies for detecting PAHs, assessing their ecological impacts on soil microbial communities, and evaluating associated human health risks. The novel machine learning-enabled detection approach offers a powerful tool for identifying previously undetectable PAH compounds, while traditional analytical methods provide validation and quantification. Understanding microbial community responses enables more effective bioremediation strategies, and epidemiological risk assessment clarifies the human health implications. Together, these protocols form a comprehensive framework for addressing PAH contamination from detection through risk assessment, supporting both environmental management and public health protection.
Conclusion
The integration of in silico spectral libraries with advanced machine learning algorithms marks a paradigm shift in environmental monitoring, moving beyond the constraints of traditional analytical chemistry. This approach provides a powerful, scalable, and reference-free methodology for detecting not only known PAHs but also the vast universe of uncharacterized and transformed derivatives present in contaminated soil. The validated high accuracy of models like Random Forest and novel physics-informed algorithms (CaPE/CaPSim) underscores the reliability of this framework. For biomedical and clinical research, these advancements offer a critical tool for more accurately assessing exposure risks and understanding the complex interactions between soil contaminants, microbial degraders, and human health. Future directions should focus on the development of integrated, portable systems for real-time field analysis, the expansion of in silico libraries to cover a wider spectrum of emerging contaminants, and the application of these techniques to model the bioavailability and toxicological impact of PAHs, thereby directly informing drug development and public health interventions.
References
- 1. Polycyclic Aromatic Hydrocarbons (PAHs) | Public Health ... [https://wwwn.cdc.gov/TSP/PHS/PHS.aspx?phsid=120&toxid=25]
- 2. Recent Evidence on Polycyclic Aromatic Hydrocarbon ... [https://pmc.ncbi.nlm.nih.gov/articles/PMC10341535/]
- 3. A systematic review of the genotoxic, mutagenic, and ... [https://www.sciencedirect.com/science/article/abs/pii/S0269749121004188]
- 4. Public health burden of polycyclic aromatic hydrocarbons in ... [https://enveurope.springeropen.com/articles/10.1186/s12302-025-01193-8]
- 5. Polycyclic aromatic hydrocarbons and associated ... - NCBI [https://www.ncbi.nlm.nih.gov/books/NBK570325/]
- 6. How Do PAHs Induce Pathogenic Changes? - CDC Archive [https://archive.cdc.gov/www_atsdr_cdc_gov/csem/polycyclic-aromatic-hydrocarbons/pathogenic_changes.html]
- 7. In silico machine learning-enabled detection of polycyclic ... [https://pubmed.ncbi.nlm.nih.gov/40339117/]
- 8. Machine learning powers new approach to detecting soil ... [https://news.rice.edu/news/2025/machine-learning-powers-new-approach-detecting-soil-contaminants]
- 9. Identification and Toxicological Evaluation of Unsubstituted ... [https://pmc.ncbi.nlm.nih.gov/articles/PMC6075666/]
- 10. Polycyclic aromatic hydrocarbon contamination in soils and ... [https://www.sciencedirect.com/science/article/abs/pii/S0045653521034536]
- 11. Time to Say Goodbye to the 16 EPA PAHs? Toward an Up- ... [https://pmc.ncbi.nlm.nih.gov/articles/PMC4714241/]
- 12. Characterization of polycyclic aromatic compounds in ... [https://www.sciencedirect.com/science/article/pii/S0269749121014925]
- 13. Detection and identification of polyaromatic hydrocarbons ... [https://www.sciencedirect.com/science/article/pii/S0269749120366999]
- 14. In Silico - an overview | ScienceDirect Topics [https://www.sciencedirect.com/topics/medicine-and-dentistry/in-silico]
- 15. In silico [https://en.wikipedia.org/wiki/In_silico]
- 16. In silico machine learning–enabled detection of polycyclic ... [https://pmc.ncbi.nlm.nih.gov/articles/PMC12088428/]
- 17. What is Surface-enhanced Raman Scattering (SERS)? [https://www.horiba.com/usa/scientific/technologies/raman-imaging-and-spectroscopy/raman-explained-faq/what-is-surface-enhanced-raman-scattering-sers/]
- 18. Surface-enhanced Raman spectroscopy [https://en.wikipedia.org/wiki/Surface-enhanced_Raman_spectroscopy]
- 19. Large-scale generation of in silico based spectral libraries ... [https://link.springer.com/article/10.1007/s00216-025-06034-4]
- 20. What is Surfaced Enhanced Raman Scattering (SERS)? [https://www.edinst.com/resource/surfaced-enhanced-raman-scattering-sers/]
- 21. Influence of Sample Preparation on SERS Signal [https://www.mdpi.com/2227-9040/13/1/22]
- 22. Predicting accurate fluorescent spectra for high molecular ... [https://www.sciencedirect.com/science/article/abs/pii/S0022285216301187]
- 23. Rice-BCM research enables detection of hazardous ... [https://news.rice.edu/news/2025/rice-bcm-research-enables-detection-hazardous-chemicals-human-placentas-unprecedented]
- 24. Machine learning–enhanced surface- ... [https://pmc.ncbi.nlm.nih.gov/articles/PMC11848310/]
- 25. Characteristics and Risk Assessment of PAH Pollution in ... [https://pmc.ncbi.nlm.nih.gov/articles/PMC10223012/]
- 26. Trace-Level Discrimination and Detection of Polycyclic ... [https://www.sciencedirect.com/science/article/abs/pii/S0304389425029322]
- 27. Targeting the right parameters in PAH remediation studies [https://www.sciencedirect.com/science/article/abs/pii/S0269749121004395]
- 28. Trace-level discrimination and detection of polycyclic ... [https://pubmed.ncbi.nlm.nih.gov/41037908/]
- 29. Tracing the Biotransformation of Polycyclic Aromatic ... [https://pmc.ncbi.nlm.nih.gov/articles/PMC6767928/]
- 30. Multiplex SERS detection of polycyclic aromatic ... [https://pubs.rsc.org/en/content/articlelanding/2023/an/d3an00636k]
- 31. PAH-Finder: A Pattern Recognition Workflow for ... [https://pubmed.ncbi.nlm.nih.gov/39772487/]
- 32. new insights from spectral and chemical data [https://www.sciencedirect.com/science/article/abs/pii/S0308814625029784]
- 33. Prediction study on the distribution of polycyclic aromatic ... [https://www.sciencedirect.com/science/article/pii/S0147651322009514]
- 34. The use of quantum-chemical descriptors for predicting ... [https://pubmed.ncbi.nlm.nih.gov/22527279/]
- 35. Variations in Spectral Signals of Heavy Metal ... [https://www.mdpi.com/2072-4292/12/20/3273]
- 36. Bayesian-optimized dynamic moisture mitigation [https://www.sciencedirect.com/science/article/pii/S1574954125002493]
- 37. A Theoretical Study of Solvent Effects on the Structure and UV ... [https://pmc.ncbi.nlm.nih.gov/articles/PMC10249394/]
- 38. Simultaneously mapping the 3D distributions of multiple ... [https://www.sciencedirect.com/science/article/abs/pii/S0304389424025792]
- 39. An ensemble-based machine learning solution for ... [https://www.nature.com/articles/s41598-023-49080-7]
- 40. Strategies for overcoming data scarcity, imbalance, and ... [https://www.nature.com/articles/s41598-024-59958-9]
- 41. Addressing Data Scarcity in Machine Learning [https://datahubanalytics.com/synthetic-data-generation-addressing-data-scarcity-in-machine-learning/]
- 42. Revealing the Threshold Effect in Sludge-Based Catalytic ... [https://www.sciencedirect.com/science/article/abs/pii/S2213343725048808]
- 43. Functional regression for SERS spectrum transformation ... [https://pubs.rsc.org/en/content/articlehtml/2025/an/d4an01177e]
- 44. Robust quantitative SERS analysis with Relative Raman ... [https://www.sciencedirect.com/science/article/abs/pii/S0039914020307566]
- 45. Deep learning-based cross-device standardization of ... [https://www.sciencedirect.com/science/article/pii/S1386142525012387]
- 46. A machine learning and experimental-based model for ... [https://www.sciencedirect.com/science/article/abs/pii/S0013935123027020]
- 47. Extraction Techniques for Polycyclic Aromatic ... [https://pmc.ncbi.nlm.nih.gov/articles/PMC2853853/]
- 48. Optimization and Comparison of Microwave‐Assisted ... [https://academic.oup.com/etc/article/42/5/982/7729581]
- 49. Quantitative Analysis and Risk Assessment of Polycyclic ... [https://pmc.ncbi.nlm.nih.gov/articles/PMC12607612/]
- 50. Innovative isotopic modeling and risk assessment of PTEs ... [https://www.nature.com/articles/s41598-025-22183-z]
- 51. Prediction of Soil Pollution Risk Based on Machine Learning ... [https://pmc.ncbi.nlm.nih.gov/articles/PMC12030823/]
- 52. Automated machine learning and interpretability analysis ... [https://www.sciencedirect.com/science/article/pii/S0165232X25003337]
- 53. Interpretable machine learning decodes soil microbiome's ... [https://environmentalmicrobiome.biomedcentral.com/articles/10.1186/s40793-024-00578-1]
- 54. An interpretable machine learning approach based on ... [https://www.nature.com/articles/s41598-025-20386-y]
- 55. Methods of analysis by the U.S. Geological Survey ... [https://pubs.usgs.gov/publication/wri034318]
- 56. GC-MS/MS Method for Determination of Polycyclic Aromatic ... [https://pmc.ncbi.nlm.nih.gov/articles/PMC10179879/]
- 57. An enhanced machine learning approach with stacking ... [https://www.sciencedirect.com/science/article/pii/S2772442524000753]
- 58. A stacked ensemble machine learning approach for the ... [https://pmc.ncbi.nlm.nih.gov/articles/PMC11196524/]
- 59. Evaluating ensemble models for fair and interpretable ... [https://www.nature.com/articles/s41598-025-15388-9]
- 60. Bagging vs Boosting vs Stacking: Which Ensemble Method ... [https://machinelearningmastery.com/bagging-vs-boosting-vs-stacking-which-ensemble-method-wins-in-2025/]
- 61. Stacking Ensemble With XGBoost Meta Model (Final Model) [https://xgboosting.com/stacking-ensemble-with-xgboost-meta-model-final-model/]
- 62. Comparing Bagging, Boosting, Voting, and Stacking with ... [https://medium.com/@patwariraghottam/ensemble-learning-unveiled-comparing-bagging-boosting-voting-and-stacking-with-xgboost-leading-eab2de794c16]
- 63. Mapping the Rise in Machine Learning in Environmental ... [https://www.mdpi.com/2305-6304/13/10/817]
- 64. Computational insights into exploring the potential effects ... [https://www.nature.com/articles/s41598-025-96193-2]
- 65. Interpretable machine learning framework for predicting Urban ... [https://pmc.ncbi.nlm.nih.gov/articles/PMC12594417/]
- 66. 基于气相色谱-静电场轨道阱高分辨质谱的海参中风险物质的 ... [https://pmc.ncbi.nlm.nih.gov/articles/PMC9577705/]
- 67. Machine learning models reveal how polycyclic aromatic ... [https://www.sciencedirect.com/science/article/abs/pii/S0048969724071894]
- 68. Portable and in situ rapid detection of benzo[a]pyrene [https://www.sciencedirect.com/science/article/abs/pii/S0308814625043821]
- 69. Polycyclic aromatic hydrocarbon and its effects on human ... [https://pubmed.ncbi.nlm.nih.gov/35151703/]
- 70. Extraction of poly aromatic hydrocarbons (PAHs) using ... [https://www.sciencedirect.com/science/article/abs/pii/S1383586624011092]
- 71. A study on the impact of polycyclic aromatic hydrocarbons ... [https://www.sciencedirect.com/science/article/pii/S0147651325008383]
- 72. Simplified Environmental Analysis Method Consolidation of ... [https://www.thermofisher.com/blog/analyteguru/simplified-environmental-analysis-method-consolidation-of-pah/]
- 73. Responses of soil bacterial communities and PAH ... [https://www.sciencedirect.com/science/article/abs/pii/S0929139325002859]
- 74. Community response of soil microorganisms to combined ... [https://pmc.ncbi.nlm.nih.gov/articles/PMC10025358/]
- 75. TPH Risk Evaluation at Petroleum-Contaminated Sites [https://tphrisk-1.itrcweb.org/]