Optimizing Photocatalytic Processes for Water Remediation: Strategies, Challenges, and Future Directions
This article provides a comprehensive examination of recent advancements and optimization strategies in photocatalytic water remediation, tailored for researchers and scientists in environmental technology.
Optimizing Photocatalytic Processes for Water Remediation: Strategies, Challenges, and Future Directions
Abstract
This article provides a comprehensive examination of recent advancements and optimization strategies in photocatalytic water remediation, tailored for researchers and scientists in environmental technology. It explores the fundamental mechanisms of semiconductor photocatalysis, including charge carrier dynamics and reactive oxygen species generation. The review systematically analyzes innovative material design such as heterojunctions, doped semiconductors, and nanocomposites for enhanced visible-light activity and stability. Critical operational parameters, reactor configurations, and strategies to overcome key challenges like charge recombination and catalyst deactivation are detailed. Through comparative analysis of various advanced oxidation processes and real wastewater case studies, this work validates the practical viability and scalability of optimized photocatalytic systems for degrading persistent organic pollutants, emerging contaminants, and industrial wastewater components.
Fundamental Principles and Mechanisms of Photocatalytic Water Treatment
Basic Principles of Semiconductor Photocatalysis and Band Gap Theory
Fundamental Concepts: FAQ
What is the fundamental principle behind semiconductor photocatalysis? Semiconductor photocatalysis is a process where a semiconductor material absorbs light energy and uses it to accelerate a chemical reaction without being consumed itself. When the semiconductor absorbs photons with energy equal to or greater than its band gap, electrons are excited from the valence band to the conduction band, generating electron-hole pairs. These charge carriers then drive reduction and oxidation reactions at the semiconductor surface, which is particularly useful for environmental applications like breaking down organic pollutants in water [1] [2].
Why is band gap energy so critical in selecting a photocatalyst? The band gap energy determines what portion of the solar spectrum a photocatalyst can absorb and the redox power of the generated charge carriers. A smaller band gap allows absorption of visible light but may provide weaker redox potential, while a larger band gap offers stronger redox power but may only absorb ultraviolet light [3] [4]. For water remediation, the ideal photocatalyst must have a band gap that enables both efficient solar light absorption and sufficient energy to drive the degradation of pollutants [5].
What is the difference between direct and indirect band gaps, and why does it matter? In a direct band gap semiconductor, the top of the valence band and the bottom of the conduction band occur at the same momentum value, allowing direct electron transitions with high probability. In an indirect band gap, the valence band maximum and conduction band minimum occur at different momentum values, requiring involvement of a phonon (vibrational energy) for the transition to occur, making it less probable [3]. Direct band gap materials typically exhibit stronger light absorption and emission properties, making them more efficient for photocatalysis [3].
What common misconceptions should researchers avoid in photocatalysis experiments? A prevalent misconception is assuming that any reaction requiring both light and a solid material must proceed via semiconductor photocatalysis. However, alternative mechanisms like dye-sensitized reactions can satisfy the same control experiments. The only reliable method to confirm a photocatalytic mechanism is through action spectrum analysis, which matches the reaction efficiency to the absorption spectrum of the photocatalyst itself rather than any adsorbed compounds [6].
Troubleshooting Common Experimental Issues
Why is my photocatalytic material showing low degradation efficiency? Low efficiency typically stems from three main issues: (1) rapid recombination of photogenerated electron-hole pairs before they can participate in surface reactions, (2) insufficient light absorption due to inappropriate band gap, or (3) poor contact between the photocatalyst and the target pollutants [5] [7]. To address recombination, consider synthesizing heterojunction composites like Z-scheme systems that spatially separate electrons and holes [1] [8]. For better light absorption, consider doping or composite formation to reduce the band gap or create intra-band-gap states [7].
How can I confirm that my material is functioning as a semiconductor photocatalyst versus other mechanisms? Proper verification requires more than standard control experiments (dark controls and material-free controls). Implement action spectrum analysis by measuring the quantum efficiency or reaction rate at different wavelengths of incident light and comparing this action spectrum with the absorption spectrum of your photocatalyst material. If the action spectrum matches the absorption spectrum of your semiconductor rather than any adsorbed reactants, you have strong evidence for true semiconductor photocatalysis [6].
My photocatalyst deactivates quickly during repeated use - what could be causing this? Photocatalyst deactivation can occur due to several mechanisms: (1) photo-corrosion or chemical dissolution of the semiconductor material, (2) poisoning of active sites by reaction intermediates or products, (3) particle aggregation reducing surface area, or (4) loss of co-catalysts from the surface [5]. To improve stability, consider forming composite materials with protective layers, using stable support matrices, or introducing sacrificial reagents that protect the photocatalyst from degradation [8] [7].
Why do I get different results when scaling up my photocatalytic reactor from laboratory to pilot scale? Scaling effects in photocatalysis are complex due to multiple interacting factors: (1) light penetration depth decreases significantly in larger volumes, leaving particles in shadow zones inactive, (2) mixing efficiency affects mass transfer of pollutants to catalyst surfaces, and (3) oxygen availability - essential for many photocatalytic oxidations - may become limited in larger systems [5]. Optimize scaling by using computational fluid dynamics to model light distribution and fluid flow, and consider reactor designs that maximize illuminated catalyst surface area [5].
Essential Materials and Characterization Data
Band Gap Energies of Common Photocatalytic Semiconductors
Table: Band gap values for selected semiconductor materials at 302K [3]
| Material | Symbol | Band Gap (eV) | Relevance to Water Remediation |
|---|---|---|---|
| Titanium Dioxide | TiO₂ | ~3.2 | Wide bandgap; UV-active; excellent for pollutant degradation but limited solar efficiency |
| Zinc Oxide | ZnO | ~3.3 | Similar to TiO₂; good for dye degradation but may suffer from photocorrosion |
| Cadmium Sulfide | CdS | ~2.4 | Visible-light active; useful for H₂ production but Cd toxicity limits environmental applications |
| Gallium Nitride | GaN | 3.4 | Wide bandgap; emerging material for deep UV applications |
| Gallium Arsenide | GaAs | 1.43 | Ideal bandgap for solar spectrum; high efficiency but expensive |
| Silicon | Si | 1.14 | Narrow bandgap; absorbs visible light but forms insulating oxide and has rapid charge recombination |
| Germanium | Ge | 0.67 | Narrow bandgap; limited application due to rapid charge recombination |
| Copper(I) oxide | Cu₂O | 2.1 | Visible-light active; promising for large-scale applications but stability issues |
| Lead-free Perovskite | Cs₃Bi₂I₉ | ~1.22 (CB position) | Emerging material; non-toxic alternative to lead perovskices for visible-light photocatalysis |
Research Reagent Solutions for Photocatalysis Experiments
Table: Essential materials and their functions in photocatalytic water remediation research
| Reagent/Material | Function | Application Notes |
|---|---|---|
| TiO₂ (P25) | Benchmark photocatalyst | Mixed-phase (anatase/rutile) with high activity; good reference material |
| Graphene Oxide (GO) | Electron acceptor & support | Enhances charge separation; large surface area for pollutant adsorption [7] |
| Ag₃PO₄ | Visible-light photocatalyst | Strong oxidation capability; valence band at +2.64 eV vs. NHE [8] |
| Fe₃O₄/H₂O₂ | Fenton-like system | Creates synergistic effects in Z-scheme configurations [1] |
| Cs₃Bi₂I₉ | Lead-free perovskite | CB at -1.22 eV; suitable for CO₂ reduction and antibiotic degradation [8] |
| g-C₃N₄ | Metal-free photocatalyst | Visible-light active; easily modified with other materials [1] |
| Quaternary ammonium salts | Scavenger for hole detection | Helps identify reaction mechanisms in trapping experiments |
Experimental Protocols and Workflows
Standard Protocol for Photocatalytic Dye Degradation
Materials Preparation:
- Photocatalyst Synthesis: For a typical composite, use in-situ crystallization methods where semiconductor nanocrystals form directly on graphene-based material surfaces for uniform distribution and strong interfacial contact [7].
- Characterization: Perform XRD for crystal structure, UV-Vis DRS for band gap determination, BET for surface area analysis, and SEM/TEM for morphology.
Photocatalytic Testing:
- Prepare pollutant solution at typical concentration (e.g., 10-20 mg/L for dyes like methylene blue or rhodamine B).
- Add photocatalyst (typical loading: 0.5-1.0 g/L) to the solution and stir in dark for 30-60 minutes to establish adsorption-desorption equilibrium.
- Irradiate with appropriate light source (e.g., 300W Xe lamp with appropriate cut-off filters for visible light experiments).
- Sample at regular intervals, centrifuge to remove catalyst particles, and analyze supernatant by UV-Vis spectroscopy monitoring characteristic absorption peaks.
- Calculate degradation efficiency as (C₀ - Cₜ)/C₀ × 100%, where C₀ is initial concentration and Cₜ is concentration at time t.
Advanced Optimization:
- Use Response Surface Methodology with Central Composite Design to optimize multiple parameters simultaneously (catalyst loading, pollutant concentration, pH, irradiation time) [8].
- Perform radical trapping experiments using appropriate scavengers (e.g., isopropanol for •OH, EDTA for h+, benzoquinone for •O₂⁻) to identify primary reactive species [8].
Protocol for Band Gap Determination Using UV-Vis DRS
Procedure:
- Measure diffuse reflectance spectra of powder samples in the 200-800 nm range using integrating sphere attachment.
- Convert reflectance data to Kubelka-Munk function: F(R) = (1-R)²/2R, where R is reflectance.
- Plot [F(R) × hν]ⁿ versus hν (photon energy), where n = 2 for direct band gap semiconductors and n = 1/2 for indirect band gap materials.
- Extrapolate the linear region of the plot to the x-axis to determine the band gap energy.
Critical Considerations:
- Distinguish between optical band gap and electronic band gap, particularly in materials with high exciton binding energies (e.g., organic semiconductors, quantum dots) [4].
- For composite materials, Tauc plot analysis may show multiple linear regions indicating contributions from different components or transition types.
Advanced Concepts and Mechanisms
Z-Scheme Heterojunction Systems for Enhanced Efficiency
Concept: Z-scheme photocatalysts mimic natural photosynthesis by creating a two-step photoexcitation system that spatially separates reduction and oxidation sites while maintaining strong redox potentials [1] [8].
Implementation:
- Combine two semiconductors with staggered band alignments, such as Cs₃Bi₂I₉ (CB: -1.22 eV) with Ag₃PO₄ (VB: +2.64 eV) [8].
- Ensure intimate contact between the semiconductors to facilitate interfacial charge transfer.
- The internal electric field at the interface directs photogenerated carriers appropriately, preserving highly reducing electrons on one component and strongly oxidizing holes on the other.
Advantages for Water Remediation:
- Simultaneously maintains strong reduction capability for processes like CO₂ reduction and strong oxidation capability for pollutant degradation.
- Enhances charge separation efficiency, reducing electron-hole recombination.
- Enables utilization of wider spectrum of solar energy.
Key Challenges and Coping Strategies in Photocatalytic Water Remediation
Table: Common challenges and recommended solutions for photocatalytic water treatment research
| Challenge | Impact on Performance | Coping Strategies |
|---|---|---|
| Rapid charge recombination | Low quantum efficiency; wasted photon energy | Construct heterojunctions (Type II, Z-scheme); add cocatalysts; use electron acceptors like graphene [7] |
| Limited visible light response | Poor utilization of solar spectrum | Doping with metals/non-metals; dye sensitization; forming solid solutions; using narrow bandgap semiconductors [1] |
| Low surface adsorption capacity | Reduced contact with pollutants | Increase surface area through nanostructuring; functionalize surface; use supports with high adsorption capacity [7] |
| Photocatalyst instability | Activity loss during repeated use | Protective coating; core-shell structures; selection of chemically stable materials; appropriate pH control [5] |
| Difficulty in pollutant concentration at trace levels | Low reaction rates in real water systems | Combine with adsorption preconcentration; use molecularly imprinted photocatalysts [8] |
| Complex water matrices | Interference from coexisting ions | Pre-treatment steps; design selective photocatalysts; optimize operational parameters [8] |
Reactive Oxygen Species Generation and Pollutant Degradation Mechanisms
Frequently Asked Questions
What are the primary Reactive Oxygen Species (ROS) involved in pollutant degradation? The most common and effective ROS in environmental remediation are hydroxyl radicals (·OH), superoxide radicals (O₂·⁻), hydrogen peroxide (H₂O₂), and singlet oxygen (¹O₂) [9]. These species are highly reactive and play a central role in breaking down complex organic pollutants into harmless end products like CO₂ and water [10].
Why does my photocatalyst show no activity in standard tests? Initial lack of photocatalytic activity does not always mean the material is ineffective. Some materials require an initial "weathering" or use period to reveal their true potential, as coating agents or organics from the synthesis process may need to be first degraded [11]. Furthermore, the choice of test is crucial; a material might show no activity in one test (e.g., NOx removal) but be highly active in another (e.g., methylene blue degradation) [11]. Ensuring the test matches the material's properties and intended application is key.
How can I prevent the deactivation of my photocatalytic material over time? Photocatalyst deactivation is often caused by the accumulation of inert, recalcitrant, or UV-blocking coatings on the surface. These can include metal oxides (e.g., SiO₂ from sealants, Fe₂O₃ from wastewater), polymeric aromatics, or dead microbial cells [11]. Strategies to mitigate this include:
- Designing materials that mineralize pollutants completely to avoid intermediate buildup.
- Pre-treating the catalyst to remove synthetic coatings.
- Using the material in conditions where the target pollutant is oxidized in preference to the catalyst binder [11].
What is the advantage of creating heterojunction photocatalysts? Heterojunctions, such as Z-scheme and S-scheme systems, are engineered by coupling two or more semiconductors. This design significantly improves photocatalytic efficiency by enhancing the separation of photogenerated electron-hole pairs, inhibiting their recombination, and often extending the material's light absorption range into the visible spectrum [5] [12]. This results in stronger redox ability and higher ROS generation rates.
Troubleshooting Guides
Problem: Low Pollutant Degradation Efficiency
Possible Causes and Solutions:
- Cause 1: Rapid recombination of charge carriers.
- Cause 2: Limited utilization of visible light.
- Cause 3: Inadequate adsorption of pollutants onto the catalyst surface.
- Solution: Use a composite material that combines adsorption and photocatalysis. For example, a TiO₂-clay nanocomposite provides a high surface area for concentrating pollutants near active sites [15].
Problem: Inconsistent ROS Generation Results
Possible Causes and Solutions:
- Cause 1: Fluctuations in oxygen supply.
- Solution: Ensure sufficient and consistent oxygen availability in the reaction system, as O₂ is the primary precursor for most ROS [13].
- Cause 2: Unoptimized reaction conditions.
- Solution: Systematically optimize operational parameters. The following table summarizes key factors and their influence.
| Factor | Influence on ROS Generation & Degradation | Optimal Range / Note |
|---|---|---|
| pH | Affects catalyst surface charge and ROS pathways [13]. | Varies by catalyst; O₂ activation often favored in acidic to slightly alkaline conditions [13]. |
| Light Intensity & Wavelength | Directly drives electron excitation [10]. | Must match catalyst's bandgap energy. |
| Catalyst Dosage | Increases active sites until light penetration is hindered [15]. | Must be optimized for the specific reactor design. |
| Initial Pollutant Concentration | High concentrations can scavenge ROS and shield light [15]. | A ratio of catalyst to pollutant must be established. |
Experimental Protocols for Key Processes
Protocol 1: Assessing Photocatalytic Activity via Dye Degradation This is a common method for a rapid initial assessment of a new photocatalyst's activity [11].
- Reactor Setup: Use a photocatalytic reactor with an appropriate light source (e.g., 300 W Xe lamp with a cutoff filter for visible light experiments) [12].
- Adsorption-Desorption Equilibrium: Disperse a known amount of photocatalyst (e.g., 20 mg) in the pollutant solution (e.g., 100 mL of 40 mg/L Tetracycline or dye). Stir the suspension in the dark for a significant period (e.g., 120 minutes) to establish adsorption-desorption equilibrium [12].
- Irradiation: Turn on the light source to initiate the photocatalytic reaction.
- Sampling & Analysis: At regular intervals, withdraw samples (e.g., 2 mL), filter them through a 0.22 μm membrane to remove catalyst particles, and analyze the residual concentration using a UV-Vis spectrophotometer [12]. The degradation efficiency (DE, %) is calculated as:
DE(%) = (C₀ - Cₜ)/C₀ × 100, where C₀ and Cₜ are the initial concentration and concentration at time t, respectively.
Protocol 2: Identification of Dominant Reactive Oxygen Species Understanding which ROS is responsible for degradation is crucial for optimizing the process.
- Scavenger Addition: Conduct degradation experiments with the addition of specific radical scavengers [12].
- Activity Comparison: Compare the degradation efficiency with and without the scavengers. A significant decrease in efficiency indicates that the scavenged radical is a primary ROS.
- Common Scavengers: The table below lists scavengers used to identify specific ROS.
| Scavenger | Target Reactive Species | Experimental Example |
|---|---|---|
| Isopropanol (IPA) | Hydroxyl radicals (·OH) | Used in a TiO₂-clay system, where it significantly reduced degradation, confirming ·OH as the primary ROS [15]. |
| Benzoquinone (BQ) | Superoxide radicals (·O₂⁻) | Used in NiFe-LDH/CTF-1 system to quench ·O₂⁻ and assess its contribution [12]. |
| EDTA-2Na | Photogenerated holes (h⁺) | Used to probe the role of holes in the degradation mechanism [12]. |
| Sodium Azide | Singlet oxygen (¹O₂) | Often used to identify the role of ¹O₂ in the degradation pathway [13]. |
Note: The specific scavenger and its concentration (e.g., 1 mM) may vary based on the system [12].
The Scientist's Toolkit: Key Research Reagents & Materials
| Reagent/Material | Function in Research | Application Example |
|---|---|---|
| TiO₂-P25 | A benchmark semiconductor photocatalyst due to its high activity and stability. | Used as a standard for comparison and as a base material in composites (e.g., TiO₂-clay) [15]. |
| Methylene Blue (MB) | A model organic dye pollutant used in standardized ink tests to rapidly screen photocatalytic activity, especially for self-cleaning surfaces [11]. | |
| 4-Chlorophenol | A model persistent organic pollutant used in non-ISO standard tests to evaluate the activity of photocatalytic powders for water purification [11]. | |
| Stearic Acid | A model organic contaminant used to evaluate the self-cleaning performance of photocatalytic films and surfaces [11]. | |
| Nitroblue Tetrazolium (NBT) | A chemical probe used for the specific detection and quantification of superoxide radicals (O₂·⁻) [9]. |
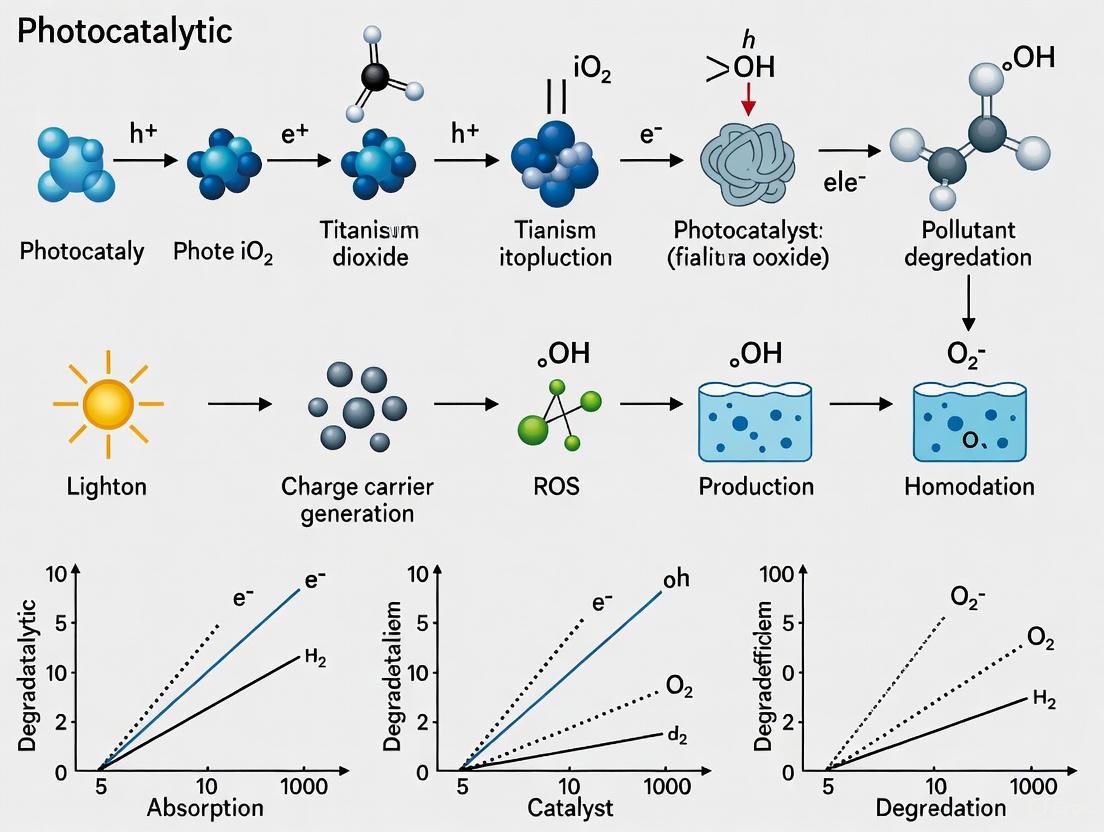
Mechanism and Workflow Visualizations
Photocatalytic ROS Generation and Pollutant Degradation Mechanism
Experimental Workflow for Photocatalyst Evaluation
Troubleshooting Common Experimental Issues
FAQ: Why is my photocatalyst's degradation efficiency for organic pollutants low?
Low degradation efficiency can stem from multiple factors. The primary issue is often the rapid recombination of photogenerated electron-hole pairs, which reduces the number of available charge carriers for the reaction [16]. A wide bandgap material that does not absorb visible light efficiently will also lead to poor performance under solar simulation [16]. Furthermore, insufficient active surface sites or agglomeration of catalyst particles can reduce the available area for pollutant adsorption and reaction [17].
- Solution: Consider doping your catalyst with elements like vanadium (V) or nitrogen (N) to enhance visible light absorption and charge separation [16]. Constructing heterojunctions, such as combining TiO₂ with CdS or biochar, can effectively separate charge carriers and enhance light absorption [16] [18]. For agglomeration, immobilizing the catalyst on a support like nickel foam can improve stability and reusability [16].
FAQ: How can I confirm that nitrogen fixation is occurring and is not a false positive?
This is a critical challenge in photocatalytic nitrogen reduction reaction (NRR). False positives often arise from nitrogenous contaminants present in feed gases, the experimental setup, or even the catalysts themselves [19].
- Solution:
- Purify Gases: Use acidic traps (e.g., 0.05 M H₂SO₄) to remove adventitious ammonia and KMnO₄ alkaline solutions or reduced copper catalysts to eliminate NOx species from your N₂ gas stream [19].
- Clean Equipment: Rigorously clean all glassware, reactors, and O-rings with fresh deionized water. Replace nitrile rubber O-rings with nitrogen-free alternatives like fluoroelastomer [19].
- Pre-treat Catalysts: Especially for nitrogen-containing catalysts like graphitic carbon nitride (g-C₃N₄), implement thorough washing or purification protocols to remove surface residuals from synthesis [19].
- Run Rigorous Controls: Always perform control experiments without light, without catalyst, and with an inert gas like Argon. Report ammonia concentration versus time with unnormalized data to provide a clear view of contaminant backgrounds [19].
FAQ: My catalyst shows good initial activity but degrades quickly over cycles. How can I improve its stability?
Catalyst deactivation can be caused by photocorrosion, the adsorption of reaction intermediates blocking active sites, or the physical loss of catalyst nanoparticles during recovery [16] [17].
- Solution: To combat photocorrosion, create heterostructures where a more stable material protects the active component. For example, supporting a material like CdS on a stable substrate can enhance durability [16]. Immobilizing powder catalysts on robust supports like nickel foam or biochar simplifies recovery and minimizes loss, significantly improving operational stability [16]. Using a hole scavenger (e.g., methanol) can also reduce photocorrosion by consuming damaging holes [19].
Performance Data of Selected Photocatalytic Materials
The following table summarizes the performance of various advanced photocatalytic materials as reported in recent literature, providing a benchmark for experimental planning.
| Photocatalytic Material | Modification Strategy | Target Pollutant | Performance Metrics | Key Finding |
|---|---|---|---|---|
| V-doped g-C₃N₄ [16] | Doping, porous nanosheet/hollow tubular structure | Carbamazepine (pharmaceutical) | Complete degradation within 20 min (with PMS oxidant) | Economical method; enhances charge carrier separation. |
| Bi/F/SnO₂/SiO₂-modified TiO₂ [16] | Multi-element doping & composite | Rhodamine B (dye) | 100% degradation in 20 min; rate constant 41x > Bi/TiO₂ | Synergistic effect improves light absorption and carrier separation. |
| TiO₂/Peanut Shell Biochar [16] | Composite with biochar | Tetracycline (antibiotic) | 95.3% removal; >86% after 5 cycles | Synergy of adsorption & photocatalysis; excellent stability. |
| N-doped TiO₂ (Interstitial) [16] | Interstitial nitrogen doping | Methylene Blue (dye) | Superior degradation vs. pristine & substitutive N-TiO₂ | Lattice distortion enhances electron transport. |
| Au/TiO₂ Nanotubes [16] | Nanotube structure & Au nanoparticle support | Acid Green 1 (dye) | 100% degradation after 17 min | Triple-action effect creates new active sites and inhibits recombination. |
| Nanocomposites (General) [17] | Various nanoscale composites | Multiple Dyes & Heavy Metals | >90% removal of various dyes and Cr(VI) | High surface-to-volume ratio enhances performance. |
Essential Experimental Protocols
Protocol 1: Synthesis of Metal-Doped Graphitic Carbon Nitride
This protocol is adapted from methods used to create porous vanadium-doped g-C₃N₄ (V/CN) for enhanced photocatalytic activity [16].
- Precursor Preparation: Combine urea and dicyandiamide in a defined mass ratio in a suitable container.
- Coplymerization: Transfer the mixture to a muffle furnace. Heat to 550°C - 650°C at a controlled heating rate (e.g., 2-5°C per minute) and maintain this temperature for 2-4 hours in an air atmosphere.
- Vanadium Doping: The doping process occurs in-situ during the thermal treatment. The vanadium precursor should be uniformly mixed with the carbon nitride precursors before heating.
- Product Collection: After the furnace cools to room temperature naturally, collect the resulting solid product (typically a yellow powder).
- Post-treatment: Wash the collected powder multiple times with deionized water and ethanol, then dry in an oven at 60°C - 80°C for several hours. The final material should have a high specific surface area (e.g., ~65 m²/g) [16].
Protocol 2: Evaluating Photocatalytic Dye Degradation
A standard procedure for assessing catalyst performance using a dye like Methylene Blue (MB) or Rhodamine B (RhB) under simulated sunlight [16].
- Reaction Setup: Prepare an aqueous solution of the target dye (e.g., 10 mg/L RhB) in a photoreactor. Add a precise amount of photocatalyst powder (e.g., 50 mg) to the solution.
- Adsorption-Desorption Equilibrium: Stir the suspension in the dark for 30-60 minutes to establish equilibrium between the dye and the catalyst surface.
- Irradiation: Turn on the simulated sunlight source (e.g., a Xe lamp). Begin the reaction and maintain constant stirring.
- Sampling: At regular time intervals (e.g., 0, 5, 10, 15, 20 min), withdraw a small sample of the suspension.
- Analysis: Centrifuge the samples to remove catalyst particles. Analyze the clear supernatant using a UV-Vis spectrophotometer by measuring the absorbance at the dye's characteristic peak (e.g., ~554 nm for RhB). Calculate the degradation percentage based on the decrease in absorbance relative to the initial concentration.
Mechanisms and Workflows
The Scientist's Toolkit: Essential Research Reagents & Materials
| Item | Function & Application Notes |
|---|---|
| Graphitic Carbon Nitride (g-C₃N₄) | A metal-free, visible-light-responsive semiconductor. Prized for its tunable electronic structure via doping or forming heterojunctions. Must be thoroughly purified to avoid false positives in N₂ fixation [16] [19]. |
| Titanium Dioxide (TiO₂) | A benchmark photocatalyst (UV-active). Modified via doping (e.g., N, Bi, F) or compositing to extend its activity into the visible light region and reduce charge recombination [16]. |
| Biochar (from agro-waste) | A low-cost, sustainable catalyst support. Enhances performance by concentrating pollutants near the catalyst via adsorption and can improve charge separation in composites like TiO₂/p-BC [16]. |
| Nickel Foam | A 3D porous support for immobilizing powder catalysts. Facilitates catalyst recovery, minimizes loss in scaled-up operations, and improves mass transfer [16]. |
| Persulfates (PMS/PDS) | Oxidants (e.g., peroxymonosulfate) added to reaction systems to be activated by photocatalysts, generating highly reactive sulfate radicals (SO₄•⁻) for enhanced pollutant degradation [16]. |
| Methanol/Ethanol | Common hole scavengers. Added to reaction systems to consume photogenerated holes, thereby reducing electron-hole recombination and suppressing photocorrosion of certain catalysts [19]. |
| Isotopic ¹⁵N₂ Gas | Essential for conclusively proving photocatalytic nitrogen fixation. The ammonia produced must be traced to the ¹⁵N₂ gas via isotopic analysis, ruling out contamination [19]. |
Frequently Asked Questions (FAQs)
Q1: What is the most critical parameter to optimize first in a new photocatalytic setup? While all parameters are interconnected, the catalyst dose is often the most practical starting point. An insufficient dose provides too few active sites, while an excessive amount can cause light scattering and reduced penetration, hindering performance. Optimization ensures you achieve maximum active surface area without wasting material [20].
Q2: How does pH affect the degradation of different types of pollutants? The solution's pH profoundly influences the catalyst's surface charge and the pollutants' ionization state. For instance:
- Cationic dyes (e.g., Methylene Blue, Malachite Green): Degrade more efficiently at basic pH (e.g., pH 10), as the catalyst surface is negatively charged, attracting the positive dye molecules [21] [20].
- Anionic dyes (e.g., Methyl Orange): Are more effectively removed at acidic pH, where the catalyst surface is positively charged [22].
- RhB degradation with a bismuth catalyst showed removal efficiency dropped from ~97% at pH 3.0 to 27.6% at pH 9.0, highlighting that the optimal pH is highly specific to the catalyst-pollutant system [23].
Q3: Can I use natural sunlight effectively for photocatalytic wastewater treatment? Yes, natural sunlight is a viable and sustainable light source. Research has demonstrated that TiO₂ nanoparticles can achieve complete degradation of Methylene Blue dye within 40 minutes under direct natural sunlight. The key is using photocatalysts, such as certain 2D carbon materials or doped perovskites, that are active under visible light, which constitutes a significant portion of the solar spectrum [21] [24] [25].
Q4: Why is temperature control important, and what is the typical optimal range? Temperature influences the reaction kinetics and the adsorption-desorption equilibrium of pollutants on the catalyst surface. Excessively high temperatures (e.g., during synthesis or operation) can be detrimental. For example, in BaTiO₃ synthesis, temperatures that are too high can lead to the formation of inert secondary phases like BaCO₃, which blocks active sites and reduces photocatalytic activity. The optimal range is often near ambient conditions, avoiding excessive heat that promotes charge carrier recombination [22] [26].
Troubleshooting Guides
Problem: Low Pollutant Degradation Efficiency
| Possible Cause | Diagnostic Steps | Suggested Solution |
|---|---|---|
| Suboptimal pH | Measure the solution pH. Test degradation efficiency across a pH range (e.g., 3, 5, 7, 9, 11). | Adjust pH to the optimal point for your specific catalyst and pollutant. Use HCl or NaOH for adjustment [23] [20]. |
| Insufficient Catalyst Dose | Conduct an experiment with increasing catalyst amounts while keeping other parameters constant. | Increase the catalyst dose until efficiency plateaus or decreases. For Ag-Mn oxide nanoparticles, 0.0017 g in 100 mL dye solution was effective [20]. |
| Poor Light Absorption/Intensity | Verify the light source spectrum matches the catalyst's bandgap. Check for light shielding or increasing the distance between the light source and the reaction mixture. | Use a light source with appropriate wavelength (UV/visible). Shorten the distance to the reactor or use a more powerful lamp to increase intensity [23]. |
| Charge Carrier Recombination | Perform photoluminescence (PL) spectroscopy; a high PL intensity indicates rapid recombination [23]. | Consider using modified catalysts (e.g., heterojunctions like g-C₃N4/TNPs or doped materials like Bi₁.₅Fe₀.₅WO₆) that enhance charge separation [24] [25] [27]. |
Problem: Catalyst Deactivation or Poor Reusability
| Possible Cause | Diagnostic Steps | Suggested Solution |
|---|---|---|
| Catalyst Leaching or Instability | Analyze the reaction solution for metal ions (e.g., Bi, Ag) after filtration using ICP-MS. Perform XRD on the used catalyst to check for structural changes. | Optimize synthesis parameters for robust morphology. Select catalysts known for high chemical stability in aqueous media, such as TiO₂ or g-C₃N4 [22] [27] [26]. |
| Fouling or Poisoning of Active Sites | Use SEM to inspect the used catalyst surface for adsorbed pollutant residues. Perform TOC analysis to see if pollutants are mineralized or just adsorbed. | Incorporate a catalyst regeneration step (e.g., washing with solvent or calcination). Use catalysts with high surface area to disperse active sites [22] [26]. |
| Formation of Less Active Phases | Characterize the used catalyst with XRD to identify any new, inactive crystalline phases that may have formed during reaction. | Avoid extreme operational conditions (e.g., very high temperature, extreme pH) that degrade the catalyst structure [22]. |
The following tables consolidate experimental data from recent research, providing a reference for expected trends and optimal values.
Table 1: Effect of pH on Photocatalytic Degradation Efficiency
| Photocatalyst | Target Pollutant | Optimal pH | Efficiency at Optimal pH | Key Observation |
|---|---|---|---|---|
| TiO₂ Nanoparticles [21] | Methylene Blue (MB) | 10 | ~100% in 40 min (with sunlight) | Enhanced rate constant (0.084 min⁻¹) at basic pH. |
| Fusiform Bi/BiOCl [23] | Rhodamine B (RhB) | 2.0 | ~97% | Formation of Bi/BiOCl heterojunction at low pH boosts activity. |
| Ag-Mn Oxide NPs [20] | Malachite Green (MG) | 10 | 99% in 60 min | Higher pH favors degradation; electrostatic attraction is key. |
| BaTiO₃ Nanoparticles [22] | Methylene Blue (MB) | - | 93% (pH not specified) | Showed selectivity for cationic dye (MB) over anionic dye (MO). |
Table 2: Effects of Catalyst Dose, Temperature, and Light Intensity
| Parameter | Photocatalyst | Target Pollutant | Optimal Value | Experimental Observation |
|---|---|---|---|---|
| Catalyst Dose | Ag-Mn Oxide NPs [20] | Malachite Green | 0.0017 g / 100 mL | 91% degradation in 60 min; higher doses increased efficiency. |
| Temperature (Synthesis) | BaTiO₃ NPs [22] | Methylene Blue | 150 °C | Hydrothermal temp. of 150°C for 48h yielded highest efficiency (93%). Higher temps (175°C) reduced activity. |
| Light Source | TiO₂ Nanoparticles [21] | Methylene Blue | Natural Sunlight | Complete degradation achieved in 40 min, proving viability of solar photocatalysis. |
| Irradiation Time | Ag-Mn Oxide NPs [20] | Malachite Green | 100 min | 92% degradation achieved; longer irradiation times increased degradation. |
Detailed Experimental Protocols
Protocol 1: Assessing the Effect of pH on Dye Degradation
This protocol is adapted from studies on fusiform Bi and Ag-Mn oxide nanoparticles [23] [20].
1. Reagents and Solutions:
- Stock solution of the target pollutant (e.g., 10 ppm Rhodamine B or Malachite Green in deionized water).
- Photocatalyst (e.g., synthesized fusiform Bi or Ag-Mn oxide NPs).
- pH adjustment solutions: 0.1 M HCl and 0.1 M NaOH.
2. Equipment:
- Photoreactor system (e.g., beaker with magnetic stirrer).
- Light source (e.g., 500 W iodine tungsten lamp or solar simulator).
- UV-Vis spectrophotometer.
- pH meter.
3. Procedure: i. Prepare five 100 mL aliquots of the dye solution. ii. Adjust each aliquot to a different pH (e.g., 3.0, 5.0, 7.0, 9.0, and 11.0) using HCl or NaOH, recording the final value. iii. To each aliquot, add a fixed mass of catalyst (e.g., 30 mg). Suspend the catalyst via ultrasonication for 5 minutes. iv. Place the suspensions in the dark under constant stirring for 60 minutes to establish adsorption-desorption equilibrium. v. At time zero, turn on the light source, maintaining a fixed distance (e.g., 20 cm) to the solution surface. vi. At regular time intervals (e.g., every 10-20 minutes), withdraw a ~3 mL sample, centrifuge to remove catalyst particles, and measure the absorbance of the supernatant using the UV-Vis spectrophotometer. vii. Calculate the degradation percentage based on the decrease in absorbance at the pollutant's characteristic wavelength.
Protocol 2: Optimizing Catalyst Dose
This protocol is based on work with bimetallic oxide nanoparticles [20].
1. Reagents and Solutions:
- Stock solution of the target pollutant at a fixed concentration (e.g., 25 ppm Malachite Green).
- Photocatalyst (e.g., Ag-Mn oxide NPs).
2. Procedure: i. Prepare a series of identical pollutant solutions (e.g., 100 mL of 25 ppm MG each). ii. Add different masses of the catalyst to each beaker (e.g., 0.0005 g, 0.001 g, 0.0017 g, 0.002 g). iii. Follow the same dark adsorption and illumination steps outlined in Protocol 1. iv. After a fixed irradiation time (e.g., 60 minutes), analyze the remaining concentration of the pollutant. v. Plot the degradation percentage versus catalyst dose to identify the optimal mass, which will show the highest efficiency before potential decline due to light scattering.
Process Visualization
The Scientist's Toolkit: Research Reagent Solutions
Table 3: Essential Materials for Photocatalytic Water Remediation Experiments
| Reagent/Material | Function & Application | Example from Literature |
|---|---|---|
| Titanium Dioxide (TiO₂) Nanoparticles | Benchmark photocatalyst; widely used for degrading organic dyes (e.g., Methylene Blue) under UV and solar light [21] [26]. | Hydrothermally grown TiO₂ NPs with high surface area (386 m²/g) for complete MB degradation under sunlight [21]. |
| Graphitic Carbon Nitride (g-C₃N₄) | Metal-free, visible-light-responsive 2D semiconductor; often combined with other materials to form heterojunctions for enhanced performance [24] [27]. | Used in g-C₃N4/titanate perovskite composites to overcome charge recombination limitations in wastewater treatment [27]. |
| Bismuth-Based Catalysts (e.g., Bi, BiOCl, Bi₂WO₆) | "Green" metals/semiconductors with tunable properties; form heterojunctions in situ for degrading dyes like RhB under visible light [23] [25]. | Fusiform Bi formed a Bi/BiOCl heterojunction during RhB degradation, achieving ~97% removal at pH 2.0 [23]. |
| Barium Titanate (BaTiO₃) Perovskite | Ferroelectric material; its internal electric field enhances charge carrier separation, useful for degrading multiple dye types [22]. | BaTiO₃ nanoparticles synthesized hydrothermally at 150°C showed 93% degradation of MB under UV light [22]. |
| Silver-Based Nanoparticles (e.g., Ag-Mn Oxide) | Bimetallic systems with synergistic effects; plasmonic properties and lower bandgaps enhance visible-light catalytic activity [20]. | Ag-Mn oxide NPs achieved 99% degradation of Malachite Green at pH 10, leveraging the synergy between Ag and Mn [20]. |
| Hydrazine Hydrate (N₂H₄·H₂O) | Common reducing agent used in the aqueous chemical synthesis of metallic nanostructures like fusiform bismuth [23]. | Used as a reducing agent to precipitate metallic Bi from Bi(NO₃)₃ precursor in the synthesis of fusiform Bi structures [23]. |
Troubleshooting Guide: Common Challenges in Photocatalytic Water Remediation
This guide addresses frequent issues researchers encounter when optimizing photocatalytic processes for water remediation.
| Problem Area | Specific Issue | Possible Causes | Proposed Solutions & Troubleshooting Steps |
|---|---|---|---|
| Catalyst Performance | Low photocatalytic degradation efficiency [5] | • Rapid electron-hole pair recombination [28].• Limited visible light absorption (e.g., wide bandgap of TiO₂) [29].• Catalyst agglomeration, reducing active surface area [29]. | • Dope the catalyst with metals/non-metals or form heterojunctions to enhance visible light absorption and charge separation [30] [29].• Use a co-catalyst (e.g., rGO) to act as an electron acceptor and suppress recombination [28].• Optimize catalyst loading to find the optimum between active sites and light penetration [31]. |
| Catalyst deactivation over cycles [5] | • Poisoning by reaction intermediates or impurities [5].• Photocorrosion or surface deposition of by-products [5].• Mechanical loss or leaching of catalyst components. | • Conduct catalyst regeneration protocols (e.g., washing with solvent or calcination) [30].• Immobilize the catalyst on a stable support (e.g., polymer membranes, mortar spheres) to enhance stability and facilitate recovery [32] [29].• Analyze by-products to identify poisoning species and pre-treat wastewater if necessary. | |
| Experimental Setup & Process | Slow reaction kinetics [31] | • Insufficient light intensity or incorrect wavelength [33].• Suboptimal pH of the solution affecting catalyst surface charge and pollutant adsorption [28].• Low concentration of reactive oxygen species (ROS). | • Optimize operational parameters: pH, catalyst dosage, and initial pollutant concentration [28].• Ensure light source spectrum overlaps with the catalyst's absorption spectrum.• Add oxidants (e.g., H₂O₂, persulfate) to enhance ROS generation [31] [32]. |
| Inconsistent results between batches | • Variations in catalyst synthesis procedure.• Fluctuations in light source output.• Presence of unknown scavengers or interfering ions in water matrix. | • Standardize catalyst synthesis and characterization protocols [28].• Calibrate light sources regularly with a radiometer.• Characterize the water matrix thoroughly and use control experiments to account for background interference. | |
| Analysis & Characterization | Incomplete mineralization of pollutants | • Degradation pathway stops at intermediate products without proceeding to CO₂ and H₂O.• Some by-products are recalcitrant to further oxidation. | • Use TOC or COD analysis to track mineralization efficiency, not just parent compound disappearance [28].• Identify degradation intermediates with LC-MS to understand the pathway and adjust process parameters to break down persistent by-products [28] [32]. |
| Difficulty in catalyst separation and reuse | • Use of nano-powder catalysts in suspension forms stable colloids [30].• Filtration is slow and leads to mass loss. | • Develop immobilized catalyst systems (e.g., photocatalytic membrane reactors - PMRs) [29].• Engineer magnetic photocatalysts for easy retrieval with an external magnet [30]. |
Frequently Asked Questions (FAQs) for Researchers
Q1: What are the key advantages of photocatalysis over conventional water treatment methods for removing emerging contaminants?
Photocatalysis offers several key advantages: it can achieve complete mineralization of non-biodegradable organic pollutants into CO₂ and H₂O, unlike adsorption which merely transfers the pollutant [26]. It operates at ambient temperature and pressure, reducing energy costs compared to thermal processes [26]. As a clean technology, it primarily uses light energy and does not produce significant secondary waste like sludge, which is a problem in coagulation or biological processes [31] [26]. Furthermore, it is highly effective against a broad spectrum of recalcitrant pollutants that conventional biological treatments cannot remove [30] [29].
Q2: Why are pharmaceutical residues particularly challenging to remove, and how effective is photocatalysis against them?
Pharmaceutical residues are challenging because they are often polar and persistent, designed to be stable and biologically active. Conventional wastewater treatment plants (WWTPs) are not designed to remove them, leading to their discharge into aquatic environments [30] [31]. Photocatalysis is a highly promising solution. Studies show it can rapidly degrade various pharmaceuticals. For instance, under optimized conditions with TiO₂, pharmaceuticals like propranolol, mebeverine, and carbamazepine can be degraded with half-lives as short as 1.9, 2.1, and 3.2 minutes, respectively [31]. The process effectively breaks down antibiotic structures, such as cleaving the β-lactam ring in amoxicillin [28].
Q3: What is the most significant barrier to scaling up photocatalytic water treatment, and what are potential solutions?
The most significant barrier is the techno-economic challenge of moving from lab-scale to large-scale industrial application [30]. This encompasses the high cost and energy consumption of artificial UV lights, the difficulty in separating and reusing nano-powder catalysts from treated water, and the potential deactivation of catalysts over time [30] [32] [29]. Research is focused on several solutions:
- Developing visible-light-active photocatalysts to utilize solar energy [30] [32].
- Immobilizing catalysts on supports like membranes, polymers, or mortar to eliminate separation steps and enhance stability [32] [29].
- Designing efficient and scalable photoreactors that ensure good light distribution and mass transfer [30] [29].
- Coupling photocatalysis with other AOPs or biological processes for synergistic effects and cost reduction [32].
Q4: How does the water matrix (e.g., inorganic ions, organic matter) affect photocatalytic efficiency?
The water matrix can have both enhancing and inhibitory effects. Inorganic ions (e.g., nitrate) can sometimes act as scavengers for photogenerated holes or hydroxyl radicals, reducing the degradation rate of the target pollutant [31]. Conversely, some ions like nitrate might enhance degradation under specific conditions [31]. Dissolved Organic Matter (DOM) can compete with the target pollutant for light absorption (shielding effect) and reactive species, thereby inhibiting degradation [31]. However, certain components of DOM, like dissolved black carbon, can photosensitize and generate reactive species that promote degradation of some contaminants [31] [32]. The net effect is highly dependent on the specific composition of the water and the target pollutant.
Experimental Protocols for Key Photocatalytic Setups
Protocol: Degradation of Pharmaceuticals using TiO₂ Suspensions
This protocol is adapted from studies demonstrating efficient degradation of pharmaceuticals like propranolol and carbamazepine using commercial TiO₂ [31].
1. Reagents and Materials:
- Target Pharmaceutical: (e.g., Propranolol, Mebeverine, or Carbamazepine).
- Photocatalyst: Degussa P25 TiO₂ is highly recommended as a benchmark [31].
- Solvent: HPLC-grade Methanol for stock solutions.
- Water: Ultra-pure water (e.g., Milli-Q water).
- pH Adjusters: HCl and NaOH solutions.
2. Equipment:
- Photo-reactor equipped with a medium-pressure Hg-vapor lamp (e.g., 150 W, emitting 238-579 nm) or a low-pressure UV lamp (e.g., 15 W, 254 nm) [31].
- Magnetic stirrer.
- Sampling syringes and syringe filters (0.45 μm, PTFE).
- Analytical instrument (HPLC-MS/MS) for concentration measurement.
3. Experimental Procedure:
- Step 1: Solution Preparation. Prepare a working solution in ultrapure water with an initial pharmaceutical concentration in the ng/L to μg/L range to simulate environmental levels [31].
- Step 2: Parameter Optimization.
- Catalyst Loading: Test a range of TiO₂ concentrations (e.g., 50 - 200 mg/L) to find the optimum. 150 mg/L has been identified as effective for some pharmaceuticals [31].
- pH Adjustment: Adjust the initial pH of the solution (e.g., from 3 to 9) using HCl or NaOH. The optimum is pollutant- and catalyst-dependent.
- Step 3: Adsorption-Desorption Equilibrium. Add the catalyst to the solution and stir in the dark for 30-60 minutes to establish adsorption equilibrium before turning on the light [31].
- Step 4: Photocatalytic Reaction. Turn on the UV lamp to initiate the reaction. Maintain constant stirring.
- Step 5: Sampling and Analysis. At predetermined time intervals, withdraw samples. Immediately filter them to remove catalyst particles. Analyze the filtrate to determine the residual concentration of the pharmaceutical.
- Step 6: Kinetics and Mineralization. Fit the concentration-time data to a kinetic model (e.g., pseudo-first-order). To assess complete degradation, perform TOC or COD analysis on samples before and after treatment [28].
Protocol: Synthesis and Use of rGO/BiFeO₃ Nanocomposite for Antibiotic Degradation
This protocol outlines the hydrothermal synthesis of a visible-light-active nanocomposite and its application for amoxicillin degradation, based on recent research [28].
1. Reagents and Materials:
- Bismuth Nitrate Pentahydrate (Bi(NO₃)₃⋅5H₂O)
- Iron Nitrate Nonahydrate (Fe(NO₃)₃·9H₂O)
- Graphene Oxide (GO) powder
- Amoxicillin
- Potassium Hydroxide (KOH)
- Hydrochloric Acid (HCl)
2. Equipment:
- Hydrothermal synthesis autoclave
- Drying oven
- LED light source (Visible light, e.g., LED array)
- Magnetic stirrer
- Characterization tools: XRD, FE-SEM, EDX
3. Experimental Procedure:
- Step 1: Synthesis of rGO/BiFeO₃. Using a simple hydrothermal method, combine the metal precursors with a suspension of GO. The hydrothermal process simultaneously forms the BiFeO₃ nanoparticles and reduces GO to rGO [28].
- Step 2: Catalyst Characterization. Characterize the synthesized powder using XRD to confirm crystal structure, and FE-SEM/EDX to analyze morphology and elemental composition [28].
- Step 3: Photocatalytic Degradation.
- Prepare an aqueous amoxicillin solution (e.g., 5-30 mg/L).
- Adjust the initial pH of the solution; a pH of 5 was found optimal for amoxicillin degradation with this catalyst [28].
- Add the rGO/BiFeO₃ nanocomposite at an optimal loading of 1 g/L [28].
- Stir in the dark for 30-60 minutes to reach adsorption equilibrium.
- Irradiate the suspension under visible LED light.
- Sample at intervals, filter, and analyze via HPLC to determine amoxicillin concentration.
- Step 4: Mineralization and Scavenger Tests.
Workflow and Process Diagrams
Diagram: Photocatalytic Experiment Workflow
Diagram: Photocatalytic Degradation Mechanism
Research Reagent Solutions & Essential Materials
This table details key materials used in advanced photocatalytic research for water remediation.
| Item Name | Function / Role in Experiment | Key Considerations for Researchers |
|---|---|---|
| Titanium Dioxide (TiO₂), Degussa P25 | Benchmark photocatalyst; mixture of anatase/rutile phases for high activity [31]. | • Excellent for UV-driven processes.• Wide bandgap (~3.2 eV) limits visible light use.• Optimal loading must be determined to avoid light scattering. |
| Bismuth Ferrite (BiFeO₃) | Visible-light-active perovskite photocatalyst (bandgap ~2.2 eV) [28]. | • Often modified (e.g., with rGO) to reduce high electron-hole recombination.• Synthesis must control phase purity to avoid secondary inactive oxides. |
| Reduced Graphene Oxide (rGO) | Electron acceptor and co-catalyst; enhances adsorption and charge separation [28]. | • High electrical conductivity and surface area.• Acts as a support to prevent nanoparticle agglomeration.• Synthesis method (e.g., Hummers', hydrothermal) affects properties. |
| MXene-derived Materials | Emerging class of 2D photocatalysts with high conductivity and functional groups [34]. | • Effective for pharmaceutical and antibiotic degradation.• Properties highly dependent on etching and delamination process.• Stability in aqueous environments is a key research area. |
| Polymeric Membrane Supports (e.g., PVDF, PES) | Substrate for immobilizing photocatalysts in Photocatalytic Membrane Reactors (PMRs) [29]. | • Prevents nanoparticle release and simplifies catalyst reuse.• Must be selected for UV/oxidizing resistance to avoid aging.• Immobilization can slightly reduce activity vs. suspended systems. |
| Visible LED Light Source | Energy-efficient, long-lasting light source for visible-light-driven photocatalysis [28]. | • Generates minimal heat, enabling room-temperature operation.• Specific wavelength can be selected to match catalyst absorption.• More sustainable and cost-effective than UV lamps. |
| Radical Scavengers (e.g., TBA, EDTA, BQ) | Chemical probes to identify the primary reactive species in the degradation mechanism [28]. | • Iso-propanol/TBA: Scavenges hydroxyl radicals (•OH).• EDTA: Scavenges positive holes (h⁺).• Benzoquinone (BQ): Scavenges superoxide anions (•O₂⁻). |
Advanced Photocatalyst Design and Reactor Engineering for Enhanced Performance
Technical Support Center: Troubleshooting Guides and FAQs
This technical support center is designed for researchers developing nanocomposites for photocatalytic water remediation. The following guides address common experimental challenges, providing targeted solutions and detailed protocols to optimize your processes.
Frequently Asked Questions (FAQs)
Q1: What are the primary strategies to enhance the visible-light activity of a wide-bandgap metal oxide photocatalyst like TiO₂?
The main challenges are the rapid recombination of photogenerated charge carriers and limited absorption of visible light. Effective strategies include:
- Doping: Incorporating non-metal elements (e.g., boron into g-C₃N₄) or metals to create intra-bandgap states, narrowing the effective bandgap and extending light absorption into the visible range [35] [29].
- Forming Heterojunctions: Coupling two semiconductors with matching band structures (e.g., ZnO-SnO₂, B-gC₃N₄/BiOCl) to promote the spatial separation of electrons and holes, thereby reducing recombination [36] [35] [37].
- Surface Sensitization: Using dyes or coupling with narrow-bandgap semiconductors (e.g., Ag₂CO₃ on TiO₂) to act as light harvesters for visible photons [38] [37].
Q2: How can I improve the stability and reusability of my nanocomposite photocatalyst?
Instability can arise from photocorrosion, nanoparticle leaching, or scaffold degradation.
- For Catalyst Stability: Select stable metal oxides and use protective matrices. For example, TiO₂/chitosan/Ag₂CO₃ nanocomposites showed stable performance over multiple cycles [38]. The chitosan matrix can protect the metal oxide components.
- For Polymer Matrix Stability: Polymeric membranes are susceptible to degradation by UV light and reactive oxygen species. Guidelines suggest using UV-resistant polymers and optimizing photocatalyst loading to balance activity and membrane longevity [29].
- Immobilization: Instead of using powders in suspension, immobilize the photocatalyst on a stable support (e.g., a ceramic membrane or a polymer film) to facilitate easy recovery and prevent loss [29].
Q3: Why is the experimental reproducibility in my water treatment studies often low?
Variations in experimental conditions and inadequate error analysis are common causes.
- Systematic Error Evaluation: A key review highlights that error estimation in water research is often inadequate. It recommends systematically identifying all error sources (e.g., concentration measurements, pH, light intensity) and using error propagation to calculate the overall experimental error [39].
- Validation: Conduct at least five repetitions of a key experiment under identical conditions to validate the estimated error range [39].
Q4: My nanocomposite agglomerates during synthesis. How can I achieve a more uniform dispersion?
Agglomeration reduces the active surface area and hinders performance.
- Synthesis Method: Bottom-up (wet-chemical) approaches, such as sol-gel or precipitation, often provide better control over size and dispersion compared to top-down methods [17] [40].
- Surface Functionalization: Use surfactants or coupling agents to modify the surface charge of nanoparticles, preventing them from clustering during integration into a polymer or ceramic matrix [37] [29].
Troubleshooting Guide for Common Experimental Issues
| Problem Area | Specific Issue | Possible Causes | Recommended Solutions |
|---|---|---|---|
| Photocatalytic Efficiency | Low pollutant degradation rate | ➤ Rapid electron-hole recombination➤ Limited visible light absorption➤ Insufficient pollutant adsorption | ➤ Design heterojunctions (e.g., ZnO-SnO₂) [36]➤ Dope with non-metals (e.g., B-gC₃N₄) [35]➤ Optimize catalyst dosage & surface area [41] |
| Material Synthesis & Stability | Nanoparticle agglomeration | ➤ High surface energy of nanoparticles➤ Lack of surface stabilizers | ➤ Use bottom-up wet chemical synthesis [17]➤ Employ surface modifiers/dispersants [37] |
| Photocatalyst leaching or polymer matrix degradation | ➤ Weak bonding between catalyst and support➤ Polymer susceptible to UV/oxidizing species | ➤ Immobilize in a stable matrix (e.g., Chitosan [38])➤ Select UV-resistant polymers for membranes [29] | |
| Process Optimization | Poor reproducibility of results | ➤ Unaccounted for variations in experimental parameters➤ Insufficient number of replicates | ➤ Apply error propagation methods [39]➤ Perform ≥5 validation repeats under identical conditions [39] |
| Inefficient degradation at pilot scale | ➤ Poor light penetration in slurry reactors➤ Difficulty recovering powdered catalyst | ➤ Use an Immobilized Photocatalytic Membrane Reactor (IPMR) [29] |
Detailed Experimental Protocols
Protocol 1: Synthesis of Metal Oxide Nanocomposites via Wet-Chemical Method
This protocol is adapted from methods used to prepare ZnO-SnO₂ and TiO₂/chitosan/Ag₂CO₃ nanocomposites [36] [38].
1. Objective: To synthesize a metal oxide-based nanocomposite with enhanced charge separation for photocatalytic degradation of organic dyes.
2. Materials and Reagents:
- Precursor salts (e.g., Zinc acetate, Tin chloride, Titanium isopropoxide, Silver nitrate)
- Solvent (e.g., Deionized water, Ethanol)
- Precipitating or complexing agent (e.g., Sodium hydroxide, Citric acid, Chitosan in acetic acid)
- Target pollutant (e.g., Rhodamine B, Methylene Blue)
3. Procedure:
- Step 1: Precursor Preparation. Dissolve the metal precursors in the solvent separately under constant stirring.
- Step 2: Mixing. Combine the precursor solutions and add the complexing agent (if used). Stir vigorously for 1-2 hours to ensure homogeneity.
- Step 3: Precipitation/Gel Formation. Adjust the pH or add a precipitating agent to initiate the formation of a precipitate or gel. For sol-gel derived SrZrO₃, the mixture is heated to ~120°C to promote gel formation [41].
- Step 4: Aging and Drying. Age the gel for several hours, then dry it in an oven at 80-120°C.
- Step 5: Calcination. Anneal the dried powder in a muffle furnace at a predetermined temperature (e.g., 400-800°C for 2-4 hours) to crystallize the metal oxide phases [36] [41].
4. Characterization:
- Structural: Powder X-ray Diffraction (PXRD) to confirm crystal structure and composite formation [36].
- Morphological: Field Emission Scanning Electron Microscopy (FESEM) with EDX and elemental mapping to examine morphology and verify elemental distribution [36] [38].
- Optical: UV-Vis Diffuse Reflectance Spectroscopy (DRS) to determine the bandgap energy [38] [41].
- Surface Area: BET analysis to measure specific surface area and porosity [38].
Protocol 2: Optimization of Photocatalytic Degradation Using Response Surface Methodology
This protocol is based on the optimization of B-gC₃N₄/BiOCl for RhB degradation [35].
1. Objective: To systematically determine the optimal conditions for maximum photocatalytic degradation efficiency.
2. Experimental Setup:
- A photocatalytic reactor with a controlled light source (e.g., Xenon or Halogen lamp).
- Magnetic stirrer to keep the reaction mixture homogeneous.
3. Procedure:
- Step 1: Parameter Selection. Identify key independent variables (e.g., catalyst amount, pH, initial pollutant concentration, irradiation time).
- Step 2: Experimental Design. Use a Central Composite Design (CCD) within Response Surface Methodology (RSM) to create a set of experimental runs.
- Step 3: Conducting Experiments. Perform each experiment in the design matrix. For each run, add the catalyst to the pollutant solution, stir in the dark for 30-60 minutes to establish adsorption-desorption equilibrium, then turn on the light to initiate photocatalysis.
- Step 4: Analysis. At regular intervals, sample and centrifuge the solution. Analyze the supernatant using UV-Vis spectroscopy to determine the residual pollutant concentration.
- Step 5: Modeling and Optimization. Fit the experimental data to a quadratic model. Use the model to identify the optimal conditions (e.g., pH=3, 40 mg catalyst) that predict the highest degradation efficiency [35].
Research Reagent Solutions Toolkit
| Reagent / Material | Function in Nanocomposite Development | Examples & Notes |
|---|---|---|
| Titanium Dioxide (TiO₂) | Benchmark photocatalyst; high chemical stability under UV light. | Often used as a base material; requires modification for visible light activity [38] [29]. |
| Chitosan | Biopolymer matrix; provides a stabilizing scaffold for nanoparticles, enhancing recyclability. | Used in TiO₂/CS/Ag₂CO₃ nanocomposite to create an efficient and environmentally friendly photocatalyst [38]. |
| Graphitic Carbon Nitride (g-C₃N₄) | Metal-free, visible-light-active semiconductor polymer. | Boron-doping (B-gC₃N₄) further improves charge separation and light absorption [35]. |
| Silver Carbonate (Ag₂CO₃) | Narrow-bandgap semiconductor; acts as a sensitizer to extend light absorption. | Coupled with TiO₂ in a chitosan matrix to enhance UV and visible light activity [38]. |
| Zinc Oxide (ZnO) & Tin Oxide (SnO₂) | Metal oxides used to form heterojunction composites. | ZnO-SnO₂ nanocomposites show enhanced charge separation and degradation efficiency for dyes like Rhodamine B [36]. |
| Boric Acid | Dopant source for non-metal element doping. | Used to synthesize B-gC₃N₄, modifying its electronic structure [35]. |
| Ethylene Diamine Tetra Acetic Acid (EDTA) | Chelating agent in sol-gel synthesis. | Forms complexes with metal cations, ensuring molecular-level mixing for homogeneous nanocomposite formation [41]. |
Process Optimization Diagrams
The following diagram illustrates the logical workflow and key considerations for optimizing a nanocomposite photocatalyst, from material design to performance validation.
Diagram 1: Workflow for Optimizing a Nanocomposite Photocatalyst.
Doping Strategies and Heterojunction Engineering for Visible Light Activation
This technical support guide provides practical, experimental guidance for researchers working to optimize photocatalytic processes for water remediation. It addresses frequent challenges in developing visible-light-active photocatalysts through doping and heterojunction engineering, offering troubleshooting advice and detailed protocols to enhance experimental reproducibility and efficacy.
Frequently Asked Questions (FAQs)
What are the primary strategies to activate wide-bandgap semiconductors like TiO₂ with visible light?
The two most prominent and effective strategies are Doping and Heterojunction Engineering.
Doping: This involves introducing foreign elements (dopants) into the crystal lattice of a semiconductor to modify its electronic structure. Dopants create new energy levels within the band gap, reducing the energy required for electron excitation and enabling the absorption of visible light. Common approaches include:
- Non-Metal Doping: Using elements like Nitrogen (N) or Carbon (C) to narrow the band gap of TiO₂, enabling visible light absorption [42].
- Metal Doping: Incorporating metals such as Iron (Fe) or Cobalt (Co) introduces new energy levels that improve charge carrier separation and extend light absorption into the visible spectrum [42].
Heterojunction Engineering: This strategy involves coupling two or more semiconductors with different band structures to form an interface. The key types are:
- Type-II Heterojunction: The band structures are staggered, which drives the photogenerated electrons to one semiconductor and holes to the other, dramatically reducing charge recombination [43] [44] [45].
- p-n Heterojunction: Formed between a p-type and an n-type semiconductor. The internal electric field at the interface efficiently separates electron-hole pairs, enhancing photocatalytic activity [46] [45].
My heterojunction photocatalyst shows excellent band alignment in theory, but experimental efficiency remains low. What could be the cause?
Theoretical band alignment is crucial, but several practical factors can limit performance.
- Poor Interface Quality: A mismatched crystal lattice or weak interfacial contact between the two semiconductors can hinder charge transfer, leading to recombination before the charges can be utilized [47]. Ensuring synthesis methods that promote intimate contact is vital.
- Charge Recombination Centers: Defects, impurities, or disordered regions at the interface can act as traps for electrons and holes, promoting their recombination [47] [44].
- Insufficient Visible Light Absorption: The heterojunction must be designed so that at least one component can be excited by visible light. If one semiconductor (like TiO₂) has a wide band gap and the other is not an effective sensitizer, visible light activity will be limited [47].
- Morphology and Surface Area: The physical structure of the photocatalyst impacts light harvesting and the availability of active sites. Low surface area can limit adsorption of pollutants, reducing degradation efficiency.
What are the best practices for evaluating the performance and stability of a newly developed visible light photocatalyst?
A robust evaluation protocol is essential for validating your material.
Performance Metrics:
- Degradation Efficiency: Quantify the removal percentage of a target pollutant under visible light (λ > 420 nm) [46] [45].
- Kinetic Analysis: Determine the apparent reaction rate constant (k) to compare activity across different catalysts.
- Mineralization Efficiency: Measure Total Organic Carbon (TOC) removal to ensure pollutants are fully mineralized to CO₂ and H₂O, not just broken into intermediate compounds [48].
- Quantum Yield (Φ) and Electrical Energy per Order (E_Eo): These metrics help assess the energy efficiency and practical feasibility of the process [48].
Stability and Reusability Tests:
- Recyclability: Perform multiple consecutive degradation cycles with the same catalyst batch, measuring efficiency in each cycle. A good catalyst should maintain high activity over at least 5 cycles [45].
- Material Characterization Post-Reaction: Use techniques like XRD and XPS to confirm the crystal structure and chemical states of the catalyst remain unchanged after reaction, ruling out photocorrosion or structural decomposition [45].
Identification of Reactive Species: Conduct trapping experiments or use Electron Paramagnetic Resonance (EPR) to identify the primary active species (e.g., hydroxyl radicals •OH, holes h⁺, superoxide •O₂⁻) involved in the degradation mechanism [45].
Troubleshooting Guides
Issue 1: Low Photocatalytic Activity Under Visible Light
| Symptom | Possible Cause | Recommended Solution |
|---|---|---|
| Low degradation rate of model pollutants (e.g., dyes, pharmaceuticals). | Insufficient visible light absorption by the photocatalyst material. | Shift strategy from doping to forming a heterojunction with a narrow-bandgap semiconductor (e.g., BiOI, g-C₃N₄) [46] [45]. |
| Rapid recombination of photogenerated electron-hole pairs. | Engineer a Type-II or p-n heterojunction to spatially separate charges [43] [44]. Implement dopants (Fe, Co) to create electron traps [42]. | |
| Low surface area limiting pollutant adsorption. | Optimize synthesis to create porous nanostructures or use supports to increase active sites. |
Issue 2: Poor Stability and Reusability
| Symptom | Possible Cause | Recommended Solution |
|---|---|---|
| Significant activity loss over repeated cycles. | Photocorrosion or chemical dissolution of the photocatalyst. | Select more stable semiconductor partners or use protective coatings. Ensure the material is thoroughly characterized post-reaction [45]. |
| Loss of catalyst material during recovery steps. | Immobilize the photocatalyst on a fixed support (e.g., glass, membranes) [48] or incorporate magnetic components (e.g., Fe₃O₄) for easy retrieval [49]. | |
| Active site poisoning by reaction intermediates. | Incorporate a mild thermal treatment between cycles to burn off accumulated intermediates. |
Issue 3: Inconsistent Results Between Batches
| Symptom | Possible Cause | Recommended Solution |
|---|---|---|
| Variable degradation efficiency for catalysts synthesized with the same protocol. | Non-uniform doping or inconsistent heterojunction formation. | Strictly control synthesis parameters: precursor concentration, temperature, pH, and reaction time. For heterojunctions, use methods that ensure uniform coating, like SILAR [46]. |
| Inadequate characterization leading to false assumptions about successful synthesis. | Employ a suite of characterization techniques (XRD, DRS, XPS, SEM/TEM) for every new batch to verify crystal phase, band gap, chemical state, and morphology. |
Detailed Experimental Protocols
Protocol 1: Synthesis of a BiOI/TiO₂ p-n Heterojunction via SILAR
This method is effective for creating a uniform interface between p-type BiOI and n-type TiO₂ [46].
- Objective: To deposit controlled layers of BiOI on a mesoporous TiO₂ film to form a visible-light-active p-n heterojunction photocatalyst.
- Materials:
- TiO₂ paste (e.g., Greatcell Solar 18NR-AO)
- Fluorine-doped Tin Oxide (FTO) glass substrates
- Bi(NO₃)₃·5H₂O (>98%)
- KI (>99%)
- Deionized (DI) water, Isopropanol, Acetone
- Procedure:
- Substrate Preparation: Clean FTO glass substrates by sequential sonication in DI water, isopropanol, and acetone for 15 minutes each. Dry with compressed air.
- TiO₂ Film Deposition: Deposit TiO₂ paste onto the FTO using the doctor-blade method. Dry on a hot plate at 120°C for 10 min, then sinter in a programmable furnace (125°C for 5 min, 325°C for 5 min, 375°C for 5 min, 450°C for 30 min).
- Precursor Preparation: Prepare 5 mM aqueous solutions of Bi(NO₃)₃·5H₂O (Bismuth source) and KI (Iodine source).
- SILAR Deposition: a. Immerse the TiO₂/FTO substrate in the Bi³⁺ solution for 10 minutes to adsorb bismuth ions. b. Rinse in DI water for 1 minute to remove unadsorbed ions. c. Immerse the substrate into the I⁻ solution for 10 minutes for the reaction to form BiOI. d. Rinse again in DI water for 1 minute. This 4-step process constitutes one SILAR cycle.
- Repetition: Repeat steps a-d for multiple cycles (e.g., 4 cycles was found optimal in one study [46]) to control BiOI loading.
- Drying: Dry the final BiOI/TiO₂ heterojunction film at room temperature.
The workflow for this synthesis is outlined below:
Protocol 2: Photocatalytic Degradation Test for Organic Pollutants
A standard procedure for evaluating catalyst performance under visible light.
- Objective: To quantify the efficiency of a photocatalyst in degrading a target pollutant (e.g., Tetracycline, Methyl Orange) under visible light irradiation.
- Materials:
- Photocatalyst (powder or film)
- Target pollutant stock solution
- Visible light source (e.g., Xenon lamp with a 420 nm cut-off filter)
- Magnetic stirrer
- Spectrophotometer or HPLC for concentration analysis
- Procedure:
- Reaction Setup: In a reactor vessel, add a specific volume (e.g., 50 mL) of pollutant solution at a known concentration (e.g., 10 mg/L) and a known amount of photocatalyst (e.g., 0.5 g/L for powders). For films, immerse the coated substrate.
- Adsorption-Desorption Equilibrium: Stir the mixture in the dark for 30-60 minutes to establish equilibrium adsorption.
- Irradiation: Turn on the visible light source to begin irradiation. Maintain constant stirring.
- Sampling: At regular time intervals (e.g., 0, 5, 15, 30, 60 min), withdraw a small sample aliquot.
- Analysis: Centrifuge or filter the sample to remove catalyst particles. Analyze the supernatant using a UV-Vis spectrophotometer (for dyes) or HPLC (for pharmaceuticals) to determine the remaining pollutant concentration.
- Calculation: Calculate the degradation efficiency (η) using the formula: η (%) = [(C₀ - Cₜ) / C₀] × 100, where C₀ is the initial concentration and Cₜ is the concentration at time t.
The Scientist's Toolkit: Key Research Reagent Solutions
| Reagent / Material | Function in Photocatalyst Development | Example Use Case |
|---|---|---|
| TiO₂ (Anatase) | The foundational n-type semiconductor; highly stable and non-toxic, but only UV-active. Requires modification. | Base material for creating doped TiO₂ or forming heterojunctions with narrow-bandgap materials [46] [42]. |
| BiOI | A p-type semiconductor with a narrow bandgap (~1.8-2.1 eV); acts as a visible light sensitizer. | Forms a p-n heterojunction with TiO₂, enhancing charge separation and visible light activity for degrading dyes and crude oil [46]. |
| g-C₃N₄ | A metal-free, visible-light-responsive polymer semiconductor. | Coupled with other semiconductors (e.g., Bi₂O₂CO₃) to form Type-II heterojunctions for antibiotic degradation [43] [45]. |
| Bi(NO₃)₃·5H₂O | Common bismuth precursor for synthesizing various bismuth-based semiconductors (BiOI, Bi₂O₃, Bi₂O₂CO₃). | Used in hydrothermal synthesis or the SILAR method to deposit bismuth-containing phases [46] [45]. |
| Polyacrylonitrile (PAN) | A polymer used as a structure-directing agent to control crystal growth and phase stability. | Enables the formation of stable α-Bi₂O₃/Bi₂O₂CO₃ heterojunctions at elevated calcination temperatures, which are otherwise difficult to achieve [45]. |
| Sequential Ionic Layer Adsorption and Reaction (SILAR) | A simple, cost-effective deposition technique for creating uniform, controlled thin films on porous substrates. | Used to fabricate BiOI/TiO₂ p-n heterojunctions with precise control over the BiOI loading [46]. |
The mechanism of charge separation in a Type-II heterojunction, a core concept in this field, is visualized below:
FAQs and Troubleshooting Guides
Rotary Photoreactors (e.g., Spinning Disc Reactors)
Q1: What are the primary operational factors affecting efficiency in a Spinning Disc Photocatalytic Reactor (SDPR), and how can I optimize them?
A: The performance of a horizontal Spinning Disc Reactor is influenced by several interconnected factors [50]. The table below summarizes common issues, their causes, and solutions.
Troubleshooting Guide for Spinning Disc Reactors (SDPR)
| Problem | Potential Cause | Recommended Solution |
|---|---|---|
| Low degradation efficiency | Insufficient mass transfer from bulk solution to catalyst surface | Increase disc rotational speed to enhance turbulence and create thinner liquid films [50]. |
| Inconsistent irradiation of catalyst | Poor light distribution across the disc surface | Optimize light source positioning and ensure the disc structure allows for even light penetration [50]. |
| Catalyst leaching or deactivation | Weak immobilization or instability of the catalyst coating | Re-optimize the catalyst immobilization protocol (e.g., use a different binder or coating method) [50]. |
| Low processing throughput | Flow rate is too high, reducing residence time | Decrease the flow rate to increase the contact time between the pollutant and the catalyst [50]. |
Q2: What are the key advantages of using a spinning disc reactor over a traditional slurry reactor?
A: Spinning disc reactors offer distinct advantages and disadvantages, as detailed in the following comparative analysis [50].
Comparison: Spinning Disc vs. Slurry Photocatalytic Reactors
| Parameter | Spinning Disc Reactor (Immobilized Catalyst) | Slurry/Suspension Reactor |
|---|---|---|
| Catalyst Separation | Easy; no downstream filtration required [50]. | Requires expensive and time-consuming filtration [50]. |
| Mass Transfer | High; intensified by centrifugal force and thin-film formation [50]. | High; but can be limited by agglomeration at high loadings [50]. |
| Light Penetration | Improved; thin liquid films allow light to reach catalyst easily [50]. | Reduced; suspended particles cause light scattering and shading [50]. |
| Continuous Operation | Suitable for continuous processes [50]. | Possible, but complicated by catalyst recovery [50]. |
| Catalyst Surface Area | Lower active surface area per unit mass [50]. | Massive total surface area [50]. |
Continuous-Flow Photoreactors
Q1: My continuous-flow photoreactor is achieving lower conversion than my batch system. What should I investigate?
A: This common issue often stems from mismatches between reactor design and reaction kinetics. Focus on the following parameters [51] [52].
Troubleshooting Guide for Continuous-Flow Photoreactors
| Problem | Potential Cause | Recommended Solution |
|---|---|---|
| Low conversion | Residence time too short for reaction completion | Reduce flow rate to increase residence time, or consider a reactor with a longer path length [51]. |
| Inconsistent results between runs | Laminar flow leading to broad residence time distribution | Incorporate static mixers or use a oscillatory flow reactor to improve radial mixing [53]. |
| Reactor clogging | Handling of solids or precipitate formation | Use a continuous stirred-tank reactor (CSTR) cascade, a vortex reactor, or switch to an immobilized catalyst system [53] [51]. |
| Poor photon utilization | Light intensity attenuation through the reactor | Use a microreactor or a thin-film reactor to ensure better light penetration, or distribute multiple light sources along the flow path [52]. |
Q2: How do I scale up a photochemical reaction from lab-scale batch to a continuous-flow process?
A: Scaling up photochemistry is a key advantage of flow technology. The strategy involves increasing throughput without sacrificing photon efficiency [53] [52]. The most common method is numbering-up, where multiple, identical reactor modules are operated in parallel, thus maintaining the same optimal reaction environment (e.g., light path, residence time) while increasing total capacity [53]. Alternatively, for some reactor types like annular or thin-film reactors, scaling can be achieved by increasing the irradiated surface area [52]. Critical parameters to control during scale-up include maintaining a consistent photon flux, ensuring uniform flow distribution, and using Process Analytical Technology (PAT) for real-time monitoring [53].
Immobilized Catalyst Systems
Q1: How can I prevent my immobilized photocatalyst from detaching from the support substrate during operation?
A: Catalyst detachment is a frequent challenge. The solution lies in the selection of a robust adhesive and a proper coating technique. A proven methodology is the use of a silicone adhesive for immobilization, as it provides strong adhesion, enhanced mechanical stability, and resistance to harsh conditions while allowing efficient UV light penetration [15]. The protocol involves applying a thin layer of silicone adhesive to a flexible plastic substrate and then uniformly sieving the photocatalyst powder onto the adhesive-coated surface, followed by drying at ambient temperature for 24 hours [15]. Ensuring the substrate is clean and chemically compatible is also critical.
Q2: The degradation efficiency of my immobilized catalyst system is lower than that of a slurry system. Is this normal, and how can I improve it?
A: Yes, this is a known trade-off. While immobilized systems simplify operation, they often have lower efficiency due to mass transfer limitations and reduced catalyst surface area exposed to light and pollutants [50]. To mitigate this [50] [15]:
- Optimize Catalyst Layer Thickness: A very thick layer can block light and hinder mass transfer, while a thin layer may not provide enough active sites. Find an optimal balance.
- Enhance Turbulence: In a spinning disc reactor, increase the rotational speed. In a flow reactor, increase the flow rate (if not residence-time-limited) to improve convective mass transfer to the catalyst surface.
- Use a Porous Support: A support with high surface area (e.g., certain clays) can improve pollutant adsorption near the catalytic sites, enhancing the overall reaction rate [15].
Experimental Protocols & Data Presentation
Protocol: Establishing a TiO2–Clay Immobilized Rotary Photoreactor
This protocol is adapted from a study achieving 98% dye removal using a novel rotary photoreactor [15].
1. Preparation of TiO2–clay Nanocomposite: - Weigh 0.7 g of titanium dioxide (TiO2-P25) and 0.3 g of industrial clay powder. - Combine in a beaker and add 5–10 mL of distilled water. - Agitate continuously with a magnetic stirrer for 4 hours at ambient temperature. - Dry the mixture in an oven at 60 °C for 6 hours. - Grind the dried product into a fine powder using a mortar and pestle.
2. Immobilization of Photocatalyst on Rotary Bed: - Prepare a flexible plastic substrate (e.g., talc, 17 cm × 35 cm). - Apply a thin, uniform layer of silicone adhesive to the substrate. - Using a sieve, uniformly apply the synthesized TiO2-clay composite powder onto the adhesive-coated substrate. - Allow the coated substrate to dry at ambient temperature for 24 hours.
3. Reactor Assembly and Operation: - Install the coated sheet inside a rotating PVC cylinder. - Position a UV-C lamp (e.g., 8 W) within a quartz cylindrical tube inside the reactor. - Prepare a contaminated solution (e.g., 20 mg/L of Basic Red 46 dye). - Operate the reactor with the following optimal parameters [15]: - Rotation Speed: 5.5 rpm - Initial Dye Concentration: 20 mg/L - UV Exposure Time: 90 minutes
The following workflow diagram illustrates the experimental setup and process.
Quantitative Performance Data
The table below summarizes key quantitative findings from recent studies on advanced photoreactor designs, providing benchmarks for researchers.
Performance Summary of Novel Photoreactor Designs
| Reactor Type | Catalyst System | Target Pollutant | Optimal Conditions | Key Performance Metrics | Reference |
|---|---|---|---|---|---|
| Rotary Photoreactor | TiO₂–clay immobilized with silicone | Basic Red 46 dye (20 mg/L) | 5.5 rpm, 90 min UV | 98% dye removal, 92% TOC reduction, k = 0.0158 min⁻¹ | [15] |
| Spinning Disc Reactor (SDR) | Various immobilized catalysts | Textile & pharmaceutical pollutants | Disc speed, flow rate, pH dependent | Overcomes mass transfer limits; efficiency depends on operational factors | [50] |
| Continuous Flow (General) | TiO₂ (slurry and immobilized) | Methylene Blue, Rhodamine-B, Phenol | Catalyst dose, pH, flow rate | Performance highly dependent on reactor geometry and flow dynamics | [51] |
| Flow Photoreactor | Metallaphotoredox catalyst | C-O coupling (API synthesis) | Taylor Vortex Flow Reactor | Successful scale-up to 10 kg-scale | [53] |
The Scientist's Toolkit: Essential Research Reagents & Materials
Key Materials for Photocatalytic Water Remediation Research
| Item | Function/Explanation | Example from Literature |
|---|---|---|
| TiO₂-P25 (Degussa) | A benchmark semiconductor photocatalyst known for its high activity, a mix of anatase and rutile phases. | Used as the primary photocatalyst in the TiO₂-clay composite [15]. |
| Industrial Clay | A cost-effective support material that prevents TiO₂ aggregation and enhances pollutant adsorption via its high surface area. | Combined with TiO₂-P25 to form a nanocomposite with a BET surface area of 65.35 m²/g [15]. |
| Silicone Adhesive | A binding agent for immobilizing powdered catalysts onto solid substrates; offers strong adhesion and UV transparency. | Used to create a stable, flexible immobilized photocatalytic bed on a plastic substrate [15]. |
| Quartz Tubing | A material with high transparency to UV light, used to protect the light source from the reaction medium while allowing photon transmission. | Served as a lamp protector in the rotary photoreactor [15]. |
| UV-C Lamp | A source of high-energy ultraviolet light (λ = 200–280 nm) sufficient to excite wide-bandgap semiconductors like TiO₂. | The 8 W irradiation source for activating the TiO₂-clay photocatalyst [15]. |
Troubleshooting Guides
Solution Combustion Synthesis (SCS) Troubleshooting
Table 1: Common SCS Issues and Solutions
| Problem | Possible Causes | Solutions |
|---|---|---|
| Low surface area and high agglomeration [54] [55] | - Excessively high combustion temperature (Tc)- Insufficient gas evolution | - Adjust fuel-to-oxidizer ratio (Φ) to control exothermicity [55]- Use fuels that generate more gases (e.g., glycine, urea) [54] |
| Formation of amorphous phases instead of crystalline products [54] | - Furnace temperature set too low | - Ensure furnace temperature is in the range of 673–873 K to ensure crystallinity [54] |
| Incomplete combustion or undesired intermediate phases [55] | - Incorrect fuel-to-oxidizer ratio (Φ)- Non-uniform gel precursor | - Calculate the stoichiometric Φ value for a complete redox reaction [55]- Ensure thorough mixing and gentle dehydration to form a homogeneous gel [54] [55] |
| Poor photocatalytic activity despite high surface area [54] [56] | - High recombination rate of charge carriers- Bandgap not optimized for visible light | - Dope with metal ions (e.g., Ce, V, Bi) or non-metals to create intermediate energy levels [16] [57]- Form heterojunctions with other semiconductors (e.g., TiO2/CdS) for better charge separation [56] [16] |
Sol-Gel Synthesis Troubleshooting
Table 2: Common Sol-Gel Issues and Solutions
| Problem | Possible Causes | Solutions |
|---|---|---|
| Cracking of films during drying or calcination [58] | - Rapid solvent evaporation causing stress- Excessive shrinkage | - Use chemical additives (e.g., DMF, glycerol) to control drying stress [58]- Apply slower, controlled drying and calcination ramps (e.g., 3 °C/min) [57] |
| Low crystallinity of the final oxide phase [59] | - Inadequate calcination temperature or time | - Optimize post-treatment thermal profile (e.g., 450°C for 2 hours for anatase TiO2) [57]- Consider hydrothermal treatment for better crystallization at lower temperatures [59] |
| Poor adhesion of films to substrates [58] [60] | - Improper substrate cleaning or surface preparation- Mismatched thermal expansion coefficients | - Thoroughly clean substrate (e.g., with acids, solvents) before deposition [57]- Use intermediate layers or match coating solution viscosity to substrate [58] |
| Limited visible-light photocatalytic response [58] [57] | - Wide bandgap of material (e.g., pure TiO2) | - Dope with metals (e.g., Cerium) or non-metals (e.g., Nitrogen) to narrow the bandgap [16] [57]- Form composites with narrow-bandgap semiconductors or carbon materials [61] |
Hydrothermal Synthesis Troubleshooting
Table 3: Common Hydrothermal Issues and Solutions
| Problem | Possible Causes | Solutions |
|---|---|---|
| Poor control over crystal morphology and size [59] | - Incorrect reaction temperature or time- Non-uniform precursor concentration | - Systematically vary temperature and duration to find optimal crystal growth window [59]- Use mineralizers or structure-directing agents to control morphology [59] |
| Low photocatalytic activity due to high electron-hole recombination [56] [61] | - High density of defects acting as recombination centers | - Optimize post-hydrothermal calcination to reduce defects without causing sintering [59]- Create heterostructures during or after hydrothermal synthesis (e.g., with graphene oxide) [61] |
| Difficulty in handling and scaling up [59] | - High-pressure equipment requirements- Safety concerns | - Start with small autoclaves and follow strict safety protocols for pressure vessels- Consider alternative lower-pressure methods or continuous flow reactors for scale-up |
Frequently Asked Questions (FAQs)
Q1: What is the single most critical parameter to control in Solution Combustion Synthesis?
The fuel-to-oxidizer ratio (Φ) is paramount [55]. It directly governs the exothermicity of the reaction, which in turn determines the combustion temperature, the amount of gases evolved, and the resulting powder characteristics like surface area, porosity, and crystallinity [54] [62]. A fuel-rich mixture (Φ > 1) generally leads to higher temperatures and potentially lower surface areas, while a fuel-lean mixture (Φ < 1) may result in incomplete combustion.
Q2: How can I make my TiO2 photocatalyst active under visible light instead of just UV light?
The most common and effective strategy is doping.
- Metal Doping: Incorporating metals like Cerium (Ce) or Vanadium (V) introduces new energy levels within the TiO2 bandgap, narrowing the effective bandgap and allowing absorption of visible light [16] [57]. For instance, Ce-doping can shift the absorption edge up to 450 nm [57].
- Non-Metal Doping: Doping with elements like Nitrogen (N) is also highly effective. Interstitial N-doping can distort the TiO2 lattice, enhancing electron transport and visible light response [16].
- Composite Formation: Coupling TiO2 with other materials, such as graphene oxide or CdS, can also enhance visible light absorption and charge separation [61] [16].
Q3: My sol-gel derived films keep cracking. How can I prevent this?
Cracking is typically caused by stress from capillary forces during solvent evaporation. To prevent it:
- Control the Drying Process: Dry the films slowly and at controlled humidity levels.
- Use Chemical Additives: Employ agents like acetylacetone or other chelating agents which modify the sol chemistry and gel network, providing better mechanical strength and reducing stress during drying [57].
- Optimize Calcination Ramp Rate: A slow and controlled heating rate (e.g., 3 °C per minute) during calcination allows for the gradual removal of organics and water, minimizing stress and preventing cracks [57].
Q4: Why is a post-synthesis hydrothermal treatment sometimes used after a sol-gel method?
A hydrothermal treatment is primarily used to enhance crystallinity under milder conditions compared to direct high-temperature calcination [59]. This process can lead to materials with higher structural quality, fewer amorphous domains, and controlled morphology without the significant particle agglomeration and grain growth that often accompany traditional high-temperature annealing [59]. This often results in a photocatalyst with improved activity and better sedimentability for easier separation from treated water [59].
Q5: What are the key advantages of using a combustion-synthesized photocatalyst over one made by sol-gel?
The key advantages of SCS are its speed, energy efficiency, and suitability for complex compositions.
- Speed and Efficiency: SCS is a fast, self-sustained reaction that occurs in minutes, making it highly energy-efficient compared to the often time-consuming sol-gel process [54] [55].
- Inherent Properties: SCS typically produces nanopowders with high surface area, high porosity, and fine particle size due to the violent evolution of gases during combustion [54] [62].
- Multicomponent Oxides: It is particularly well-suited for producing a large variety of multicomponent and complex metal oxides with high phase purity [55].
Experimental Protocols & Workflows
Detailed Protocol: Sol-Gel Flow Coating of Doped TiO2 Films
This protocol is adapted from methods used to prepare Ce-TiO2 films for photocatalytic degradation of pharmaceuticals [57].
Research Reagent Solutions & Materials
| Item | Function/Explanation |
|---|---|
| Titanium(IV) isopropoxide (TIP) | Primary precursor for TiO2 network [57]. |
| Cerium(III) nitrate hexahydrate | Dopant precursor source for enhanced visible light activity [57]. |
| i-Propyl alcohol (PrOH) | Solvent for the reaction [57]. |
| Acetylacetone (AcAc) | Chelating agent; controls hydrolysis rate of TIP and prevents precipitation [57]. |
| Nitric acid (HN) | Catalyst for hydrolysis and condensation reactions [57]. |
| Borosilicate glass substrate | Support for the immobilized photocatalyst film [57]. |
Step-by-Step Methodology:
- Solution Preparation: For a Ce-TiO2 sol with 0.08 wt.% Ce, mix the reagents in the molar ratio TIP:PrOH:AcAc:HN = 1:35:0.63:0.015 [57]. Add the cerium precursor to the mixture.
- Stirring and Sonication: Vigorously stir the colloidal solution for 2 hours, followed by sonication for 30 minutes to ensure homogeneity [57].
- Substrate Preparation: Clean borosilicate glass substrates thoroughly with appropriate solvents and dry [57].
- Flow Coating Deposition: Deposit the prepared sol onto the substrate using the flow coating technique. Repeat the deposition process three times to build up the film thickness [57].
- Drying and Calcination: Dry the coated substrate at 100 °C for 1 hour. Subsequently, calcine the films in a furnace at 450 °C for 2 hours using a controlled heating rate of 3 °C per minute to form the crystalline Ce-TiO2 phase [57].
Detailed Protocol: Solution Combustion Synthesis of Metal Oxides
This general protocol outlines the steps for producing nanostructured metal oxides like Co3O4 or complex photocatalysts [54] [55] [62].
Research Reagent Solutions & Materials
| Item | Function/Explanation |
|---|---|
| Metal Nitrate (e.g., Cobalt nitrate) | Serves as the metal cation source and the oxidizer [55] [62]. |
| Organic Fuel (e.g., Glycine, Urea, Citric acid) | Acts as the reducer, complexing agent, and sometimes a microstructural template [54] [55]. |
| Deionized Water | Solvent for creating a homogeneous aqueous precursor solution [55]. |
Step-by-Step Methodology:
- Precursor Solution Preparation: Dissolve calculated amounts of the metal nitrate (oxidizer) and the chosen organic fuel (reducer) in a minimal amount of deionized water. The critical parameter is the fuel-to-oxidizer ratio (Φ), which should be precisely calculated [55] [62].
- Gel Formation: Heat the homogeneous aqueous solution on a hot plate at low-to-medium temperature (e.g., 80-150°C) with continuous stirring. This leads to dehydration and the formation of a viscous gel [55].
- Combustion Ignition: Place the gel in a preheated furnace at a temperature between 500-600°C. The gel will undergo rapid, self-propagating combustion, igniting and burning with a flame to produce a voluminous, fluffy solid powder within seconds to minutes [54] [55].
- Product Collection: After the combustion reaction is complete and the sample has cooled, collect the resulting powder. It may be lightly ground and optionally calcined at a moderate temperature to further improve crystallinity if necessary [54].
Troubleshooting Guides and FAQs for Photocatalytic Water Remediation
This technical support center is designed within the context of a broader thesis on optimizing photocatalytic processes for water remediation. It addresses common experimental challenges in dye degradation, pharmaceutical removal, and treatment of real wastewater matrices, providing researchers and scientists with practical, evidence-based solutions.
FAQ: Addressing Common Experimental Challenges
1. My photocatalyst shows high degradation efficiency for dyes in pure water but fails in real textile wastewater. What could be the cause?
This is a common issue often caused by background organics and inorganic ions in real wastewater that compete with the target pollutant for active sites on the catalyst surface and scavenge the generated reactive oxygen species (ROS) [8] [63]. The complex matrix can also block light penetration.
- Solution:
- Characterize the Water Matrix: Analyze the real wastewater for common ions (e.g., Cl⁻, SO₄²⁻, CO₃²⁻), dissolved organic carbon, and pH.
- Apply Process Optimization: Use statistical methods like Response Surface Methodology (RSM) to optimize conditions specifically for the complex matrix. One study achieved 99.4% tetracycline removal in tap water by optimizing catalyst loading, pollutant concentration, and pH [8].
- Consider Catalyst Modification: Develop Z-scheme heterojunctions, which preserve strong redox power and can be more resilient. A Cs₃Bi₂I₉/Ag₃PO₄ composite maintained 84.76% and 62.03% efficiency in tap and river water, respectively [8].
2. The photocatalytic activity of my material decreases significantly after a few reuse cycles. How can I improve photostability?
Activity loss is typically due to photocorrosion, catalyst leaching, or fouling (accumulation of recalcitrant intermediates on the active sites) [64].
- Solution:
- Construct Heterojunctions: Coupling materials can enhance charge separation and protect less stable components. A lead-free Cs₃Bi₂I₉/Ag₃PO₄ Z-scheme heterojunction retained over 90% of its initial activity after five cycles [8].
- Conduct Post-Run Analysis: Use techniques like XRD and SEM to check for structural changes or surface fouling on the recovered catalyst.
- Implement Simple Regeneration: A gentle recalcination or washing step can sometimes burn off or remove adsorbed species that cause fouling.
3. How can I transition my photocatalysis experiment from a lab-scale beaker to a more scalable reactor system?
Lab-scale setups often have uniform light distribution, which is a major challenge to replicate at larger scales.
- Solution:
- Adopt a Compound Parabolic Collector (CPC): CPC reactors can use both direct and diffuse solar radiation, making them efficient for pilot-scale studies and functional on cloudy days [65].
- Utilize UV-LEDs: Modern photoreactors using UV-LEDs offer advantages over traditional mercury lamps, including energy efficiency, longer lifetime, design flexibility, and lower environmental impact [66]. A custom UV-LED photoreactor (365 nm) demonstrated 99.42% degradation of Rhodamine B with ZnO [66].
4. I am getting inconsistent results for the same experiment. Which key parameters should I control most rigorously?
Inconsistency often stems from poor control over variables that directly influence reaction kinetics.
- Solution: Strictly monitor and report these critical parameters:
- Light Source Intensity and Spectrum: Use a radiometer to measure light flux (W/m²). The emission spectrum of your source (e.g., UV-LED at 365 nm) must be characterized [66].
- Catalyst Loading: There is an optimum value; too much causes light scattering and shielding [65].
- Initial Pollutant Concentration and Solution pH (affects catalyst surface charge and pollutant speciation) [8] [63].
- Dissolved Oxygen: This is a critical electron acceptor; ensure continuous mixing or air bubbling to maintain constant O₂ levels.
Performance Data and Optimization
The following table summarizes performance metrics from recent case studies for easy comparison.
Table 1: Performance Metrics from Photocatalytic Case Studies
| Target Pollutant | Photocatalyst | Experimental Scale & Conditions | Key Performance Metric | Reference |
|---|---|---|---|---|
| Tetracycline (Antibiotic) | Cs₃Bi₂I₉/Ag₃PO₄ (9-CBIAPO) | Visible light, RSM-optimized (0.40 g/L catalyst, pH 6.6) | 99.4% TC removal, 83% TOC mineralization in 72 min | [8] |
| Pharmaceutical Mix | g-C₃N₄ | Solar CPC Pilot Plant (200-300 mg/L catalyst in hospital wastewater) | >54% removal of 10 detected pharmaceuticals in 4 h | [65] |
| Rhodamine B (Dye) | ZnO | UV-LED (365 nm) photoreactor, 100 mg catalyst, 17 ppm Rh B | 99.42% degradation in 120 min | [66] |
| CO₂ Reduction & TC | Cs₃Bi₂I₉/Ag₃PO₄ (9-CBIAPO) | Visible light | 59.4 μmol g⁻¹ CO, 23.6 μmol g⁻¹ CH₄; >90% activity after 5 cycles | [8] |
Table 2: Optimization of Pharmaceutical Removal using g-C₃N₄ in a Solar CPC Pilot Plant [65]
| Pharmaceutical | Initial Concentration (ng L⁻¹) | Degradation Rate Constant (L kJ⁻¹) at 300 mg L⁻¹ g-C₃N₄ | Final Removal (%) |
|---|---|---|---|
| Amisulpride | ~2,000 | 0.051 | 96% |
| O-Desmethyl Venlafaxine | ~2,925 | 0.024 | 83% |
| Venlafaxine | ~700 | 0.017 | 78% |
| Carbamazepine | ~500 | 0.015 | 76% |
| Mirtazapine | Not specified | Not specified | 34% |
The Scientist's Toolkit: Key Research Reagent Solutions
Table 3: Essential Materials and Reagents for Photocatalytic Water Remediation Experiments
| Reagent/Material | Function/Application | Example from Case Studies |
|---|---|---|
| Zinc Oxide (ZnO) | A wide bandgap semiconductor photocatalyst, effective under UV light for degrading dyes and organics. | Primary catalyst for Rhodamine B degradation in a UV-LED reactor [66] [63]. |
| Graphitic Carbon Nitride (g-C₃N₄) | A metal-free, visible-light-responsive photocatalyst with a bandgap of ~2.7 eV. | Used for solar-driven removal of pharmaceuticals from real hospital wastewater [65]. |
| Silver Phosphate (Ag₃PO₄) | A highly oxidative semiconductor often used in Z-scheme heterojunctions to enhance charge separation. | Paired with Cs₃Bi₂I₉ to form a heterojunction for simultaneous CO₂ reduction and antibiotic degradation [8]. |
| Lead-free Perovskites (e.g., Cs₃Bi₂I₉) | Emerging class of visible-light absorbers designed to replace toxic lead-based perovskites. | Used as the reduction component in a Z-scheme with Ag₃PO₄ [8]. |
| Radical Scavengers | Used in trapping experiments to identify the dominant reactive species in a photocatalytic mechanism. | Common scavengers: Isopropanol (for •OH), EDTA (for h⁺), p-Benzoquinone (for •O₂⁻) [8]. |
Detailed Experimental Protocols
Protocol 1: Dye Degradation Using a UV-LED Photoreactor [66]
- Objective: To evaluate the degradation of Rhodamine B (Rh B) using ZnO in a custom UV-LED photoreactor.
- Materials:
- Photocatalyst: Zinc Oxide (ZnO), 100 mg.
- Pollutant Solution: Rhodamine B, 17 ppm in deionized water (or real wastewater for matrix studies).
- Reactor: Custom UV-LED photoreactor emitting at 365 nm.
- Glass reactor vessel with magnetic stirrer.
- Procedure:
- Add 100 mg of ZnO catalyst to the glass reactor containing 100 mL of the 17 ppm Rh B solution.
- Place the reactor in the UV-LED setup and begin continuous magnetic stirring in the dark.
- Stir in the dark for 30 minutes to establish adsorption-desorption equilibrium.
- Turn on the UV-LED light source to initiate the reaction. Maintain constant stirring.
- Collect 3-4 mL aliquots of the solution at regular time intervals (e.g., 0, 15, 30, 60, 90, 120 min).
- Centrifuge the aliquots or filter through a 0.22 μm membrane to remove catalyst particles.
- Analyze the clear supernatant using a UV-Vis spectrophotometer by measuring the absorbance at Rh B's characteristic peak (∼554 nm).
- Data Analysis: Calculate the degradation efficiency (%) using the formula: ((C0 - Ct)/C0 \times 100), where (C0) is the initial concentration after adsorption equilibrium and (C_t) is the concentration at time t.
Protocol 2: Pharmaceutical Removal in a Solar CPC Pilot Plant [65]
- Objective: To degrade inherent pharmaceuticals from real hospital wastewater secondary effluent using g-C₃N₄ under natural solar irradiation.
- Materials:
- Photocatalyst: g-C₃N₄ (200 - 300 mg/L optimal loading).
- Water Matrix: Secondary effluent from a hospital wastewater treatment plant.
- Reactor: Compound Parabolic Collector (CPC) pilot plant.
- Procedure:
- Characterize the initial hospital wastewater effluent for pH, COD, BOD₅, and inherent pharmaceutical concentrations (e.g., via Solid Phase Extraction followed by UHPLC-LTQ/Orbitrap HRMS).
- Load the CPC reactor with a known volume of wastewater effluent.
- Add the optimal dosage of g-C₃N₄ (e.g., 300 mg/L) to the reactor.
- Circulate the mixture in the dark to achieve adsorption equilibrium.
- Expose the system to natural solar irradiation for a set duration (e.g., 4 hours), tracking the accumulated UV energy (kJ/L).
- Collect samples at predetermined time intervals.
- Separate the catalyst by filtration and analyze the filtrate for residual pharmaceutical concentrations and physicochemical parameters (COD, BOD₅).
- Data Analysis: Determine pseudo-first-order rate constants by plotting Ln(C/C₀) against the accumulated UV energy (Q_{UV}).
Visualizing the Photocatalytic Process and Workflow
The following diagram illustrates the general mechanism of heterogeneous photocatalysis for pollutant degradation, which is fundamental to all case studies.
Photocatalytic Degradation Mechanism
This workflow outlines the standard experimental procedure for conducting a photocatalytic degradation study, from preparation to analysis.
Experimental Workflow for Photocatalysis
Overcoming Operational Challenges and Performance Optimization Strategies
Frequently Asked Questions (FAQs)
Q1: What are the primary causes of catalyst deactivation in photocatalytic water treatment? Catalyst deactivation is a major hurdle in practical photocatalytic water remediation. The main causes can be categorized into three types [67]:
- Chemical Poisoning: Strong chemical adsorption of substances from the feedstock (e.g.,
H₂S,Pb,Hg) onto the catalyst's active sites, blocking them from reactants [68] [67]. - Fouling (Coking): Deposition of carbonaceous materials or other substances that physically block the catalyst's pores, preventing reactant access. This accounts for about 20% of catalyst deactivation [68].
- Thermal Degradation/Sintering: Exposure to high temperatures causes agglomeration of catalyst particles or support materials, leading to a significant reduction in active surface area [68] [67].
Q2: How can I determine if my photocatalyst has been deactivated? Deactivation is indicated by a measurable decline in catalytic activity over time. This is often quantified as the ratio of the reaction rate at a given time to the initial reaction rate: Activity (t) = r(t) / r(t=0) [67]. In practice, you would observe a significant decrease in the degradation efficiency of your target pollutant (e.g., tetracycline) under standardized experimental conditions [8].
Q3: Can a deactivated catalyst be regenerated, and how? Yes, many deactivation processes are reversible with the correct treatment [69] [68].
- For Coking: Carbon deposits can often be removed via gasification with water vapor or hydrogen, converting the carbon to
CH₄,CO, orCO₂[68]. - For Poisoning: If poisoning is reversible, the catalyst can be regenerated by removing the poison from the feed or through chemical treatment (e.g., reduction with hydrogen for some adsorbed species). Irreversible poisoning often necessitates catalyst replacement [68] [67].
- General Regeneration: Techniques like air plasma treatment and centrifugation have been shown to recover over 57-77% of the initial activity of TiO₂-based photocatalysts [70].
Q4: What strategies can prevent catalyst deactivation during the design phase? Proactive strategies are key to enhancing catalyst longevity [71] [68]:
- Spatial Confinement: Confining catalyst nanomaterials (e.g., iron oxyfluoride, FeOF) in angstrom-scale channels (e.g., between graphene oxide layers) can significantly mitigate the leaching of key ions, a primary cause of deactivation [71].
- Constructing Heterojunctions: Coupling two semiconductors (e.g., a Z-scheme heterojunction like
Cs₃Bi₂I₉/Ag₃PO₄) can improve charge separation and enhance stability, allowing the composite to retain >90% activity after multiple cycles [8]. - Using Guard Beds: Placing adsorbents like
ZnOupstream in the reactor system can protect the primary catalyst by removing poisons such as sulfur compounds from the feed [68] [67].
Troubleshooting Guides
Guide: Diagnosing Catalyst Deactivation Mechanisms
Follow this logical workflow to identify the root cause of activity loss in your photocatalytic system.
Experimental Protocol: Regeneration of a Coked Photocatalyst
This protocol details a common method for regenerating a catalyst deactivated by carbon deposits (coking).
Principle: Carbonaceous deposits (C_xH_y) are gasified into gaseous products (CO, CO₂, CH₄) using an oxidizing or reducing atmosphere at elevated temperatures.
Materials:
- Tube furnace or muffle furnace
- Quartz boat or tube
- High-purity gas (O₂, air, or H₂)
- Gas flow regulators
Step-by-Step Procedure:
- Catalyst Collection: After the photocatalytic reaction, recover the spent catalyst from the slurry via centrifugation or filtration.
- Washing and Drying: Wash the catalyst thoroughly with deionized water and ethanol to remove soluble residues. Dry in an oven at 80-100°C for 2-4 hours.
- Calcination Setup: Place the dried catalyst powder in a quartz boat and insert it into the tube furnace. Connect the gas supply.
- Thermal Treatment: Under a continuous flow of air (for oxidation) or hydrogen (for reduction), heat the furnace to a predetermined temperature (e.g., 400-500°C in air). The optimal temperature must be determined to burn off coke without sintering the catalyst.
- Hold and Cool: Maintain the temperature for 2-4 hours. Afterwards, turn off the furnace and allow it to cool to room temperature under the same gas flow.
- Reactivation: The regenerated catalyst is now ready for reuse. It may require a brief reduction step (if using H₂) before the next photocatalytic test.
Safety Note: Perform calcination in a well-ventilated fume hood or a system vented to the exterior. Use appropriate personal protective equipment (PPE) when handling high-temperature equipment and gases.
Performance Data & Reagent Solutions
Quantitative Comparison of Catalyst Deactivation & Regeneration
Table 1: Performance and Stability Metrics of Selected Photocatalysts
| Photocatalyst | Application | Deactivation Cause | Regeneration Method | Performance Post-Regeneration | Reference |
|---|---|---|---|---|---|
| FeOF Powder | Pollutant Degradation (AOP) | F⁻ ion leaching (40.7% loss) | Spatial confinement in GO membrane | Near-complete pollutant removal for >2 weeks in flow-through mode [71] | |
| 9-CBI/APO Z-Scheme | Antibiotic Removal & CO₂ Reduction | Not Specified | Simple recovery and reuse | >90% activity retained after five cycles [8] | |
| Aeroxide P25 TiO₂ | Water Disinfection | Fouling, Activity loss | Air plasma treatment & centrifugation | ~77% recovery of catalytic material achieved [70] | |
| FeOCl Powder | Pollutant Degradation (AOP) | Cl⁻ ion leaching (93.5% loss) | Not effectively regenerated | Severe performance loss; not practical for long-term use [71] |
The Scientist's Toolkit: Key Research Reagents
Table 2: Essential Materials for Photocatalyst Synthesis and Testing
| Reagent/Material | Typical Function | Application Example |
|---|---|---|
| TiO₂ (Aeroxide P25) | Benchmark photocatalyst; provides a standard for performance comparison. | Used as a reference material in disinfection and pollutant degradation studies [70]. |
| Graphene Oxide (GO) | A 2D support material for creating spatially confined environments to enhance catalyst stability. | Matrix for intercalating FeOF catalysts to prevent ion leaching and deactivation [71]. |
| Bismuth-based Perovskites (e.g., Cs₃Bi₂I₉) | Lead-free, visible-light-active photocatalyst component. | Forming Z-scheme heterojunctions with Ag₃PO₄ for simultaneous CO₂ reduction and antibiotic degradation [8]. |
| Hydrogen Peroxide (H₂O₂) | A precursor for generating hydroxyl radicals (•OH) in Advanced Oxidation Processes (AOPs). | Activated by iron oxyhalide catalysts (FeOF, FeOCl) for rapid oxidation of organic pollutants [71]. |
| Spin Trapping Agents (e.g., DMPO) | Used in Electron Paramagnetic Resonance (EPR) spectroscopy to detect and identify short-lived radical species. | Trapping •OH radicals to quantitatively compare the radical generation efficiency of different catalysts [71]. |
Strategies to Minimize Electron-Hole Recombination and Enhance Charge Separation
Frequently Asked Questions (FAQs)
FAQ 1: What are the primary causes of rapid electron-hole recombination in my photocatalytic system? Rapid recombination often occurs due to defects in the crystal structure that act as recombination centers, the inherent Coulombic attraction between photogenerated electrons and holes, and the absence of a driving force to separate charges. Recombination can happen in the bulk of the material or on its surface, often on a picosecond timescale, which is much faster than the migration of charges to the surface for reactions [72] [73].
FAQ 2: What strategies can I use to spatially separate electrons and holes? A highly effective strategy is to construct a type-II heterostructure or S-scheme heterojunction. In these systems, the band alignment of two different semiconductors creates an internal electric field that drives photogenerated electrons to one material and holes to the other, achieving spatial separation and significantly suppressing recombination [74] [75].
FAQ 3: Can external fields, like magnetic fields, be used to enhance charge separation? Yes. Applying an external magnetic field can leverage the Lorentz force. This force acts oppositely on moving electrons and holes (due to their opposite charges), bending their trajectories and pulling them apart, which reduces their chance of recombining. This method can improve photocatalytic efficiency without physical modification of the catalyst [76].
FAQ 4: How does ferroelectric polarization help in bulk charge separation? Ferroelectric materials (e.g., BaTiO₃) possess a persistent internal electric field due to their polarized domains. This built-in field promotes the separation of photogenerated electron-hole pairs within the bulk of the material itself, effectively addressing one of the most critical bottlenecks in photocatalysis [77].
FAQ 5: What is the role of electron spin control in photocatalysis? Electron spin control is an emerging strategy to inhibit recombination. By manipulating the spin states of electrons (e.g., through doping or magnetic fields), you can create spin-polarized currents. Since recombination often requires paired spins with opposite directions, controlling spin populations can statistically reduce recombination events and enhance photocatalytic performance [78].
Troubleshooting Guides
Problem: Low Quantum Efficiency Due to Bulk Recombination
- Symptoms: High photoluminescence intensity, low photocurrent density, and poor photocatalytic activity despite good light absorption.
- Solution: Integrate a ferroelectric material to create a strong internal depolarization field.
- Protocol:
- Synthesize BaTiO₃ Nanowires (BTO NWs): Use a two-step hydrothermal method.
- Clean and calcine a Ti foil substrate.
- Hydrothermally treat it in a concentrated NaOH solution (e.g., 11 M) to form Na₂TiO₃ (NTO) NWs.
- Perform a second hydrothermal reaction in a Ba(OH)₂ solution to convert NTO to BTO NWs [77].
- Polarize the Ferroelectric Material: Apply an external electrochemical bias to align the internal ferroelectric domains, creating a permanent internal electric field. Studies show that negative polarization can dramatically enhance photocurrent [77].
- Characterize: Use photoelectrochemical (PEC) measurements to confirm enhanced bulk charge separation (BCS) efficiency.
- Synthesize BaTiO₃ Nanowires (BTO NWs): Use a two-step hydrothermal method.
Problem: Rapid Surface Recombination
- Symptoms: Fast initial reaction that quickly plateaus, low yield of desired products.
- Solution: Construct an S-scheme heterojunction photocatalyst.
- Protocol:
- Select Semiconductors: Choose two semiconductors with staggered band structures that can form an S-scheme heterojunction. A common example is the Fe₂O₃/Bi₂O₃/In₂S₃ (FB/IS) system [74].
- Synthesis: A simple fabrication method is recommended. For the FB/IS system, this involves a preparation process where Fe₂O₃/Bi₂O₃ is loaded onto In₂S₃ [74].
- Deposit a Co-catalyst: To further accelerate surface reactions and consume separated charges, deposit a thin layer of a co-catalyst (e.g., Pt for H₂ evolution) on the reduction side of the heterojunction.
- Validation: Use electron spin resonance (ESR) and scavenging experiments to confirm the successful separation of charges and the formation of reactive species [74].
Problem: Recombination Across All Time-Scales (Bulk and Surface)
- Symptoms: Consistently low performance across various photocatalytic tests.
- Solution: Employ a combined strategy of heterostructuring and external magnetic field application.
- Protocol:
- Fabricate a Type-II Heterostructure: Create a van der Waals heterostructure (e.g., MoTe₂/Tl₂O) where the conduction band minimum and valence band maximum are located on different layers, ensuring intrinsic charge separation [75].
- Apply a Magnetic Field: Place the photocatalytic reactor on a permanent magnet. The Lorentz force from the magnetic field will provide an additional force to separate the photo-generated charges.
- Optimize Parameters: The enhancement is dependent on the magnetic field intensity and the stirring speed, which creates relative motion between the catalyst and the field. A study showed a 26% improvement in degradation efficiency under an 810 Gauss field [76].
The following table summarizes performance enhancements achieved by different strategies as reported in the literature.
Table 1: Efficacy of Different Charge Separation Strategies
| Strategy | Material System | Performance Metric | Enhancement | Reference |
|---|---|---|---|---|
| Ferroelectric Polarization | CdS/BaTiO₃ NWs | Photocurrent Density | 2.86x increase after negative poling | [77] |
| S-scheme Heterojunction | Fe₂O₃/Bi₂O₃/In₂S₃ | H₂ Production Rate | 590.36 μmol·g⁻¹·h⁻¹ | [74] |
| Magnetic Field (Lorentz Force) | TiO₂ Nanobelts | Dye Degradation Rate | 26% improvement (810 Gauss field) | [76] |
| Type-II vdW Heterostructure | MoTe₂/Tl₂O | Power Conversion Efficiency | ~2% (high visible-light absorption) | [75] |
Experimental Protocols & Workflows
Detailed Protocol: Fabrication of a Ferroelectric-Enhanced Photoanode
This protocol is adapted from the synthesis of CdS/BaTiO₃ nanowires for enhanced bulk charge separation [77].
Materials Function Table: Table 2: Key Research Reagents for Ferroelectric Composite Synthesis
| Reagent/Material | Function in the Protocol |
|---|---|
| Titanium (Ti) Foil | Substrate for growing nanowire arrays. |
| Sodium Hydroxide (NaOH) | Reactant to form sodium titanate (NTO) nanowires. |
| Barium Hydroxide (Ba(OH)₂) | Barium source for converting NTO to barium titanate (BTO) NWs. |
| Cadmium Nitrate (Cd(NO₃)₂) | Cadmium ion source for depositing CdS sensitizer layer. |
| Sodium Sulfide (Na₂S) | Sulfide ion source for depositing CdS sensitizer layer. |
Step-by-Step Workflow:
- Substrate Preparation: Clean a Ti foil substrate successively in an ultrasonic bath with acetone, ethanol, and deionized water.
- TiO₂ Layer Formation: Calcinate the cleaned Ti foil in a furnace at 750°C for 8 hours to form a TiO₂ layer.
- NTO NWs Synthesis: Transfer the foil to a Teflon-lined autoclave filled with an 11 M NaOH solution. Heat at 210°C for 8 hours to form Na₂TiO₃ (NTO) NWs. Rinse and dry.
- BTO NWs Conversion: Place the NTO NW sample in another autoclave with a 0.05 M Ba(OH)₂ solution. Maintain at 210°C for 12 hours. Rinse gently with diluted HCl, deionized water, and ethanol to obtain BTO NWs.
- Ferroelectric Polarization: Apply an external negative electrochemical bias to align the internal ferroelectric domains of the BTO NWs, creating a persistent internal electric field.
- CdS Deposition (SILAR Method): Sensitize the BTO NWs with CdS using the Successive Ionic Layer Adsorption and Reaction (SILAR) method.
- Immerse the BTO NWs in 0.2 M Cd(NO₃)₂ ethanol solution for 30 seconds, then rinse with ethanol.
- Subsequently, immerse it in 0.2 M Na₂S in methanol/water solution for 30 seconds, then rinse.
- Repeat this cycle 10-20 times to control CdS loading.
- Optional Passivation: Deposit a thin ZnS layer (2 cycles using 0.1 M Zn(NO₃)₂ and 0.1 M Na₂S) to further suppress surface recombination and photocorrosion.
- Annealing: Anneal the final sample on a hotplate at 150°C and then 250°C, each for 10 minutes.
Visual Guide: Charge Separation Mechanisms
The following diagram illustrates the core mechanisms by which the discussed strategies suppress electron-hole recombination.
Frequently Asked Questions (FAQs)
Q1: How does pH influence photocatalytic efficiency, and what is the optimal range? The pH of a solution is a critical parameter as it affects the surface charge of the photocatalyst, the speciation of pollutants, and the generation of reactive oxygen species (ROS) [79]. The point of zero charge (PZC) is a key reference; when the solution pH is below the PZC, the catalyst surface is positively charged, favoring the adsorption of anionic pollutants. Conversely, a pH above the PZC results in a negatively charged surface, attracting cationic pollutants [79]. Furthermore, pH influences the formation of hydroxyl radicals (•OH), which is often more favorable under acidic conditions [79] [80]. While the optimal pH is system-dependent, many processes operate effectively in a mildly acidic to neutral range (e.g., pH 3-7), but this must be determined experimentally for a specific catalyst and pollutant [80] [81].
Q2: What are the consequences of incorrect oxidant dosing? Oxidants, such as hydrogen peroxide or persulfate, are added to scavenge electrons and prevent the recombination of electron-hole pairs, thereby enhancing the formation of ROS [79]. However, an excessive concentration of oxidants can be detrimental. High doses can act as a scavenger for the very hydroxyl radicals it aims to produce, effectively quenching the reaction and reducing the overall degradation efficiency [79]. Therefore, careful optimization of oxidant concentration is essential to avoid inhibitory effects.
Q3: Why does increasing catalyst loading beyond an optimal point reduce degradation efficiency? While a higher catalyst dose provides more active sites for reaction, exceeding an optimal loading leads to a reduction in efficiency. This is primarily due to increased light scattering and screening effects, which prevent photons from penetrating the solution and activating the catalyst particles beneath the surface [79]. This phenomenon causes a saturation effect, where additional catalyst does not contribute to the reaction and is effectively wasted.
Q4: How can I systematically optimize multiple operational parameters? Advanced optimization techniques like Response Surface Methodology (RSM) and Artificial Neural Networks (ANN) are highly effective for modeling complex, non-linear interactions between multiple parameters. Studies have shown that ANN models, in particular, can achieve superior predictive accuracy for processes like sodium percarbonate oxidation, leading to significantly better optimization than traditional one-variable-at-a-time approaches [81]. These methods can simultaneously optimize parameters like pH, reaction time, catalyst dose, and oxidant concentration.
Troubleshooting Common Experimental Issues
Problem: Slow or Incomplete Pollutant Degradation
- Potential Cause: Incorrect pH level leading to poor pollutant adsorption on the catalyst surface.
- Solution: Determine the point of zero charge (PZC) of your photocatalyst. Adjust the solution pH to be below the PZC for anionic pollutants or above the PZC for cationic pollutants to enhance adsorption [79].
- Potential Cause: Insufficient catalyst or oxidant loading.
- Solution: Conduct a dose-response experiment to identify the optimal catalyst and oxidant concentrations. Avoid excessive oxidant dosing, which can scavenge radicals [79].
Problem: Poor Catalyst Reusability or Stability
- Potential Cause: Photocorrosion of the semiconductor material under prolonged illumination.
- Solution: Consider using oxide-based semiconductors (e.g., TiO₂) known for their high stability, or explore heterojunction structures that can enhance charge separation and reduce degradation [79].
- Potential Cause: Catalyst leaching or aggregation.
- Solution: Immobilize catalyst powders on supportive substrates like membranes or flexible nickel foam to improve recovery and maintain activity across multiple cycles [16] [82].
Quantitative Parameter Optimization Data
The following tables summarize optimal parameter ranges from recent research to serve as a reference for experimental design.
Table 1: Key Operational Parameters and Their Optimized Ranges
| Parameter | Influence on Process | Optimal Range (System Dependent) | Key Considerations |
|---|---|---|---|
| pH | Governs catalyst surface charge, pollutant speciation, and ROS generation [79]. | Often 3-7 (mildly acidic to neutral) [80] [81]. | Must be determined relative to catalyst PZC and pollutant pKa. |
| Catalyst Loading | Provides active sites; excessive loading causes light scattering [79]. | Varies (e.g., 0.1 - 1.0 g/L for Ag-ZnO [80]). | An optimum exists; more is not always better. |
| Oxidant Dosing | Scavenges electrons to reduce e⁻/h⁺ recombination [79]. | Varies (e.g., ~2.9 g/L for SPC in one system [81]). | Excessive doses can act as radical scavengers. |
| Reaction Time | Determines the extent of degradation and mineralization. | Minutes to hours (e.g., 180 min for 84% CFX degradation [80]). | Required time depends on initial pollutant concentration. |
| Light Intensity/Wavelength | Driver of electron excitation; must match catalyst bandgap [83]. | UV or visible light, depending on catalyst. | Solar-driven systems are targeted for sustainability [48]. |
Table 2: Exemplary Optimized Conditions from Recent Studies
| Photocatalytic System | Target Pollutant | Optimized Conditions | Reported Efficiency | Citation |
|---|---|---|---|---|
| Ag-doped ZnO (2 wt%) | Cefuroxime (antibiotic) | pH=6.11; Catalyst=0.1 g/L; Time=180 min | 84.25% degradation | [80] |
| Sodium Percarbonate (SPC) Oxidation | m-Cresol | pH=2.3; SPC=2.9 g/L; Catalyst=12.9 g/L; Temp=45.7°C | 67.8% TOC removal | [81] |
| FeOx/TiO2 Catalyst | m-Cresol | pH=2.3; Catalyst=12.9 g/L | Key part of optimized SPC system | [81] |
Detailed Experimental Protocols
Protocol 1: Optimization of Ag-Doped ZnO for Solar Antibiotic Degradation This protocol is adapted from a study on degrading cefuroxime [80].
Catalyst Synthesis (Sol-Gel):
- Dissolve zinc acetate dihydrate in a suitable solvent.
- Add a calculated amount of silver nitrate (e.g., 1, 2, 2.5, and 3 wt%) to the solution under continuous stirring.
- Maintain the reaction to allow for gel formation.
- Dry and calcine the resulting gel at high temperature (e.g., 500 °C) to obtain crystalline Ag-ZnO nanoparticles.
Photocatalytic Testing:
- Prepare an aqueous solution of the target pollutant (e.g., 50 mg/L cefuroxime).
- In a photoreactor, add a specific dose of the Ag-ZnO catalyst (e.g., 0.1 g/L) to the pollutant solution.
- Adjust the initial pH of the suspension using dilute acid or base (e.g., to pH 6.11).
- Before illumination, stir the mixture in the dark for 30-60 minutes to establish adsorption-desorption equilibrium.
- Irradiate the suspension under simulated solar light with constant stirring.
- At regular time intervals, withdraw samples, centrifuge, or filter to remove catalyst particles.
- Analyze the supernatant using UV-Vis spectroscopy or HPLC to determine pollutant concentration.
Protocol 2: AI-Optimized Sodium Percarbonate (SPC) Oxidation This protocol uses advanced modeling for parameter optimization [81].
Experimental Design:
- Select key variables: initial pH, reaction time, SPC dosage, temperature, catalyst dosage, and initial pollutant concentration.
- Use a Central Composite Design (CCD) within Response Surface Methodology (RSM) to create a set of experimental runs.
Oxidation Procedure:
- Place the pollutant solution (e.g., 100 mL with 75 mg/L m-cresol) in the reactor.
- Adjust the pH to the target value (e.g., pH 2.3).
- Bring the solution to the desired temperature (e.g., 45.7 °C) with constant agitation.
- Add predetermined amounts of catalyst (e.g., 12.9 g/L FeOx/TiO2) and SPC oxidant (e.g., 2.9 g/L) to initiate the reaction.
- After the set reaction time, filter the mixture through a 0.45 μm membrane.
Analysis and Modeling:
- Measure Total Organic Carbon (TOC) in the filtered samples to assess mineralization.
- Input the experimental data into an Artificial Neural Network (ANN) model to predict TOC removal and identify the globally optimal conditions, which can be validated experimentally.
Process Optimization Workflow
The following diagram illustrates a systematic workflow for optimizing operational parameters in photocatalytic water treatment, integrating both experimental and computational approaches.
The Scientist's Toolkit: Key Research Reagents & Materials
Table 3: Essential Materials for Photocatalytic Water Remediation Research
| Material / Reagent | Function in Research | Example Application |
|---|---|---|
| Semiconductor Catalysts (TiO₂, ZnO, g-C₃N₄) | Primary light-absorbing material; generates electron-hole pairs and ROS [79] [16]. | TiO₂ is widely used for degrading dyes and pharmaceuticals due to its stability [16] [82]. |
| Dopants (Ag, V, Bi, F) | Modifies electronic structure; reduces bandgap; minimizes e⁻/h⁺ recombination [79] [80] [16]. | Ag-doped ZnO shows enhanced visible-light activity for antibiotic degradation [80]. |
| Oxidants (H₂O₂, Sodium Percarbonate, Persulfate) | Electron acceptors that suppress charge recombination and enhance radical generation [79] [81]. | Sodium percarbonate used to generate hydroxyl radicals for TOC removal [81]. |
| Model Pollutants (Methylene Blue, Rhodamine B, Cefuroxime) | Well-characterized compounds used to benchmark and compare photocatalytic activity [84] [80] [16]. | Methylene blue is a common dye model; Cefuroxime represents pharmaceutical pollutants [84] [80]. |
| Support Materials (Nickel Foam, Biochar, Membranes) | Provides a high-surface-area, reusable substrate for immobilizing powder catalysts [16] [82]. | TiO₂ on nickel foam enables efficient catalyst recovery in flow systems [16]. |
Overcoming Light Penetration Limitations and Scattering Effects
FAQ: Addressing Common Experimental Challenges
1. How can I improve light penetration in a slurry photoreactor? Light penetration in slurry reactors is limited by scattering and absorption from catalyst particles and water matrix components. To mitigate this:
- Reduce Catalyst Concentration: Optimize catalyst loading to find a balance between providing sufficient active sites and minimizing light scattering. Excess catalyst creates a "shielding effect" [29].
- Use Immobilized Catalysts: Immobilizing the photocatalyst on a fixed support, such as a membrane or glass fiber, eliminates light scattering from suspended particles and allows for the use of thin, illuminated layers [29] [85].
- Optimize Reactor Geometry: Employ thin-film or flow-through reactors. These designs ensure the reaction mixture is exposed to a high fluence of light over a short path length, reducing the distance light must travel through the turbid medium [85].
2. My catalyst has low efficiency under visible light. What strategies can I use? This is often due to a wide bandgap or rapid charge carrier recombination.
- Utilize Visible-Light Active Catalysts: Develop or use catalysts engineered for visible light absorption. Black TiO₂ is a prominent example, created by introducing defects (like Ti(III) sites and oxygen vacancies) that narrow the bandgap and allow for strong visible light absorption without toxic dopants [85].
- Apply Catalyst Modifications: Strategies like doping, defect engineering, and forming heterojunctions can tailor a catalyst's band structure to enhance visible light harvesting and promote the separation of photogenerated electrons and holes [5] [78].
3. What are the main sources of contamination in photocatalytic experiments, and how can I avoid them? False positives, especially in sensitive reactions like nitrogen fixation, are a major concern.
- Purify Feed Gases: Gases like N₂ can contain adventitious ammonia and NOx species. Use acid traps (e.g., 0.05 M H₂SO₄) for ammonia and reduced copper catalysts or KMnO₄ alkaline solutions to remove NOx [19].
- Clean Equipment Rigorously: All reactor components, glassware, and tubing should be thoroughly cleaned with fresh deionized water. Replace nitrile rubber O-rings (which can leach nitrogen) with fluoroelastomer versions [19].
- Pre-treat Catalysts: Both commercial and homemade catalysts can harbor nitrogenous residues from their synthesis. Implement rigorous washing and purification protocols before use [19].
4. How can I scale up my photocatalytic process from batch to flow? Moving to a continuous flow system is key for process intensification.
- Use Supported Catalysts: Develop catalysts immobilized on stable supports like glass fibers (e.g., bTiO₂@GF) or membranes. This creates a fixed-bed reactor, eliminating the need for post-reaction catalyst separation and enabling continuous operation [29] [85].
- Design Flow Reactors: Flow systems offer superior light penetration, enhanced mass transfer, and more uniform irradiation of the catalyst compared to batch systems, making them highly efficient and scalable [85].
Troubleshooting Guide: Light Utilization Issues
| Symptom | Possible Cause | Diagnostic Experiments | Solution |
|---|---|---|---|
| Low reaction rate and quantum yield | Severe charge carrier recombination | Measure photoluminescence spectra; compare performance with and without electron scavengers [5] [78]. | Implement electron spin control via doping or magnetic fields; use co-catalysts to expedite surface reactions [5] [78]. |
| Rapid decay of catalytic activity over time | Catalyst poisoning or photo-corrosion | Characterize catalyst surface pre- and post-reaction via XPS; analyze for adsorbed reaction by-products [5]. | Modify surface chemistry; optimize reaction conditions (e.g., pH); use more stable catalyst materials [5] [29]. |
| Poor performance in real water matrices (vs. pure water) | Scattering by suspended solids; absorption by NOM; fouling | Conduct tests with filtered vs. unfiltered water; add NOM (e.g., humic acid) to pure water to gauge its impact [86] [29]. | Incorporate a pre-filtration step; design anti-fouling membranes; use robust immobilized catalysts resistant to fouling [86] [29]. |
| Inefficient light usage, particularly with visible light | Large catalyst bandgap; poor light harvesting | Obtain UV-Vis DRS spectrum to determine bandgap; benchmark under visible vs. UV light [87] [85]. | Engineer catalyst bandgap via defect creation (e.g., black TiO₂) or doping to enhance visible light absorption [5] [85]. |
Experimental Protocols
Protocol 1: Synthesis and Testing of a Visible-Light Active Black TiO₂ Catalyst on Glass Fiber (bTiO₂@GF)
This protocol details the creation of a fixed-bed catalyst designed to overcome light penetration issues in flow systems [85].
1. Catalyst Synthesis
- Materials: Glass fiber (GF) filters, titanium isopropoxide, ethanol.
- Immobilization: Impregnate the GF support with titanium isopropoxide precursor.
- Calcination: Thermally treat the material in air at high temperature to form white TiO₂ (wTiO₂@GF).
- Reductive Treatment (Blackening): Anneal the wTiO₂@GF at 400 °C in a sealed oven under an ethanol atmosphere. This process generates Ti(III) defects and oxygen vacancies, responsible for the visible light absorption.
2. Catalyst Characterization
- UV-Vis Diffuse Reflectance Spectroscopy (DRS): Confirm enhanced visible light absorption compared to white TiO₂.
- X-ray Diffraction (XRD): Verify the crystalline phase (anatase) and calculate crystallite size, which typically grows during blackening.
- X-ray Photoelectron Spectroscopy (XPS): Attempt to detect the presence of Ti(III) species (note: this can be challenging due to low surface concentrations).
3. Photodegradation Testing in a Flow System
- Reactor Setup: Construct a flow system where the aqueous pollutant solution is pumped through the fixed bed of bTiO₂@GF.
- Light Source: Use a visible light source (e.g., LED or solar simulator).
- Procedure:
- Pump a solution of the target contaminant (e.g., 17β-estradiol or a surrogate like crocin) through the catalyst bed in a continuous flow.
- Turn on the visible light source to initiate the reaction.
- Collect the effluent at the outlet at regular time intervals.
- Analyze the samples using techniques like HPLC or UV-Vis spectroscopy to determine the concentration of the remaining pollutant and calculate the degradation efficiency.
Protocol 2: Rigorous Control Experiment for Photocatalytic Nitrogen Reduction Reaction (NRR)
This protocol is essential to avoid false positives when measuring low-yield reactions like ammonia synthesis [19].
1. System Decontamination
- Gas Purification: Pass the high-purity N₂ feed gas through traps: an acidic solution (e.g., 0.05 M H₂SO₄) to remove ammonia, followed by a reduced copper catalyst or KMnO₄ alkaline solution to eliminate NOx contaminants.
- Reactor Cleaning: Rigorously wash all components (reactor, tubing, O-rings) with fresh deionized water. Use fluoroelastomer O-rings instead of nitrile rubber.
- Water Purity: Use fresh ultrapure or redistilled water and measure its baseline ammonia/NOx concentration.
- Catalyst Pre-treatment: Pre-wash the photocatalyst to remove any surface nitrogenous residues.
2. Control Experiments and Data Reporting
- Essential Controls: Always run dark control (catalyst in N₂-saturated solution, no light) and light control (light irradiation in N₂-saturated solution, no catalyst).
- Isotope Labeling: For conclusive evidence, perform the experiment using isotopically labeled ¹⁵N₂ gas. The subsequent detection of ¹⁵NH₃ via ¹H nuclear magnetic resonance (NMR) spectroscopy confirms that ammonia originated from N₂ gas and not contaminants.
- Data Presentation: Report the photocatalytic activity as ammonia concentration versus time. Include the raw, unnormalized data from all control experiments to provide a transparent view of potential contamination levels [19].
Research Reagent Solutions
| Item | Function & Rationale |
|---|---|
| Black TiO₂ (bTiO₂) | A modified TiO₂ with Ti(III) defects and oxygen vacancies that narrow its bandgap, enabling strong visible light absorption without toxic dopants. Ideal for flow systems when immobilized [85]. |
| Glass Fiber (GF) Support | Provides a high-surface-area, inert, and rigid substrate for immobilizing photocatalysts. Enables the creation of fixed-bed flow reactors, which mitigate light scattering and catalyst recovery issues [85]. |
| Graphitic Carbon Nitride (g-C₃N₄) | A metal-free, polymer semiconductor with a suitable bandgap for visible light response. Often used for H₂ generation and pollutant degradation, though may require co-catalysts for some reactions [29] [78]. |
| Visible Light LED Array | A narrow-banded, cool, and energy-efficient light source that allows for precise control over the irradiation wavelength, promoting reproducibility in visible light experiments [88]. |
| ¹⁵N₂ Isotope Gas | Used as a feed gas in NRR experiments. The subsequent detection of ¹⁵NH₃ in the product serves as definitive proof that ammonia was produced from dinitrogen gas and not from environmental contamination [19]. |
Visual Guide: Strategy-Impact Relationships
This diagram illustrates the logical flow from identifying a core challenge, to implementing a strategic solution, and finally achieving the desired experimental outcome.
FAQs and Troubleshooting for Hybrid System Experiments
This section addresses common challenges researchers face when integrating photocatalytic processes with adsorption, membrane filtration, and biological treatment for water remediation.
Q1: Our hybrid adsorption-photocatalysis system shows a rapid initial pollutant removal rate, but the efficiency decreases significantly after several cycles. What could be the cause?
A: This is typically caused by adsorbent saturation or catalyst fouling/deactivation.
- Troubleshooting Guide:
- Problem: Adsorption sites are occupied and not regenerated.
- Solution: Ensure your photocatalytic component is powerful enough to degrade the adsorbed pollutants and regenerate the active sites. Using materials like TiO₂/GO composites can enhance regeneration by efficiently transferring photogenerated electrons, minimizing recombination, and degrading adsorbed contaminants [89] [90].
- Problem: The photocatalyst surface is fouled by irreversible adsorption of intermediate compounds or inorganic ions.
- Problem: Adsorption sites are occupied and not regenerated.
Q2: When integrating a photocatalytic membrane reactor (PMR), we observe a severe and rapid decline in permeate flux. How can we mitigate this membrane fouling?
A: Fouling is a primary challenge in PMRs, often exacerbated by catalyst deposition.
- Troubleshooting Guide:
- Problem: Physical clogging by photocatalyst particles.
- Solution: For suspended catalyst systems, optimize hydrodynamic conditions (e.g., cross-flow velocity). Alternatively, develop robust immobilized catalyst membranes. Immobilizing catalysts like TiO₂ or MOFs onto the membrane surface or within its matrix can prevent particle clogging while enabling localized degradation of foulants [91] [92].
- Problem: Catalytic fouling where photocatalytic degradation produces intermediate compounds that foul the membrane.
- Problem: Physical clogging by photocatalyst particles.
Q3: The performance of our photocatalytic system is highly variable and seems sensitive to the water matrix (e.g., pH, inorganic ions). How can we stabilize its efficiency?
A: Environmental parameters critically influence photocatalytic activity and adsorption capacity.
- Troubleshooting Guide:
- Problem: Solution pH affects the surface charge of the catalyst/adsorbent and the speciation of pollutants.
- Problem: Inorganic ions (e.g., Cl⁻, SO₄²⁻, CO₃²⁻) scavenge reactive oxygen species (ROS) and compete for active sites.
Q4: We are designing a sequential adsorption-photocatalysis-biological treatment process. What is the optimal configuration to prevent toxicity from photocatalytic intermediates from inhibiting the biological unit?
A: This is a critical consideration for integrated systems.
- Troubleshooting Guide:
- Problem: Photocatalytic intermediates can be more toxic than the parent compound.
- Solution: Do not place the biological reactor directly after the photocatalyst. The optimal sequence is Adsorption → Biological Treatment → Photocatalysis. The adsorption column acts as a buffer and pre-concentrator, the biological unit degrades biodegradable components, and the photocatalytic polishes the recalcitrant residues and any remaining toxins, ensuring a non-inhibitory environment for the microbes [93] [89]. Monitor toxicity throughout the process to validate the configuration.
- Problem: Photocatalytic intermediates can be more toxic than the parent compound.
Experimental Protocols for Key Hybrid Processes
Protocol: Synthesis of a Graphene Oxide (GO)-Doped TiO₂ Composite Photocatalyst
This protocol describes the synthesis of an N-TiO₂/GO composite, which exhibits enhanced visible-light activity and adsorption capacity [90].
- Synthesis of GO: Use the modified Hummers' method to prepare GO from graphite powder. This involves oxidation with sulfuric acid, sodium nitrate, and potassium permanganate under controlled temperatures in an ice bath, followed by dilution, peroxide treatment, and repeated washing/centrifugation until a neutral pH is achieved [90].
- Synthesis of TiO₂ Nanoparticles: Prepare a TiO₂ sol-gel by slowly adding a titanium precursor (e.g., titanium tetraisopropoxide) to an alcohol solvent (e.g., ethanol) under vigorous stirring. Add water to hydrolyze the precursor and form a gel. Age the gel, dry it, and calcine it to obtain crystalline TiO₂ nanoparticles [90].
- Preparation of N-TiO₂/GO Composite:
- Disperse a specific amount of the prepared GO in deionized water using ultrasonication for 2 hours to create a well-dispersed suspension.
- Mix the TiO₂ nanoparticles and a nitrogen source (e.g., urea) into the GO suspension.
- Transfer the mixture into a Teflon-lined autoclave for hydrothermal synthesis (e.g., at 120-180°C for 12-24 hours).
- After the reaction, cool the autoclave naturally. Collect the resulting solid product by filtration or centrifugation, wash it thoroughly with water and ethanol, and dry it in a vacuum oven [90].
Protocol: Evaluating a Hybrid Adsorption-Photocatalysis System for Dye Removal
This experiment quantifies the synergistic effect between adsorption and photocatalysis using a model pollutant like Rhodamine B (RhB) [90].
- Adsorption in Dark: Add a known mass (e.g., 20 mg) of the N-TiO₂/GO composite to a known volume (e.g., 50 mL) of RhB solution (e.g., 10 mg/L) in a reactor. Stir the mixture in the dark for 60 minutes to reach adsorption-desorption equilibrium. Sample at regular intervals to monitor the concentration decrease via UV-Vis spectroscopy.
- Photocatalytic Degradation: After the dark phase, turn on the light source (e.g., a Xe lamp with a UV cut-off filter for visible light tests). Maintain constant stirring and temperature. Take samples at regular intervals (e.g., every 10-15 minutes), centrifuge them to remove catalyst particles, and analyze the supernatant to measure the remaining RhB concentration.
- Data Analysis: Calculate the adsorption capacity and the photocatalytic degradation efficiency. The pseudo-first-order kinetic model is often applicable for analyzing the photocatalytic degradation rate [90].
Protocol: Assessing an Integrated Photocatalytic Membrane Reactor (PMR)
This protocol tests the performance and anti-fouling capability of a PMR [91].
- Reactor Setup: Use a continuous-flow reactor equipped with a membrane module (e.g., ultrafiltration). The photocatalyst can be suspended in the feed tank or immobilized on the membrane surface.
- Fouling Resistance Test:
- First, measure the pure water flux (Jw1) of the clean membrane.
- Conduct a filtration run with the pollutant solution (e.g., containing dyes or pharmaceuticals) under light irradiation for a set duration (e.g., 2-4 hours). Monitor the permeate flux (Jp) over time.
- After the test, clean the membrane system and measure the pure water flux again (J_w2).
- Calculate the flux recovery ratio (FRR) = (Jw2 / Jw1) * 100%. A high FRR indicates good anti-fouling properties [91].
- Pollutant Removal Efficiency: Simultaneously, analyze the pollutant concentration in the feed and permeate streams to determine the removal efficiency, which results from the combined action of photocatalysis and membrane filtration.
Performance Data and Research Reagent Solutions
Table 1: Performance Comparison of Integrated Technologies for Water Remediation
| Technology Integration | Target Pollutant | Key Performance Metric | Result | Key Advantage |
|---|---|---|---|---|
| Adsorption-Photocatalysis (N-TiO₂/GO) [90] | Rhodamine B (RhB) Dye | Adsorption Capacity / Photocatalytic Removal (Visible Light) | 167.92 mg/g / 57.69% | Synergistic pollutant capture & degradation; adsorbent regeneration. |
| Membrane-Photocatalysis (PMR) [91] | Mixed Organic Pollutants | Flux Recovery Ratio (FRR) / Pollutant Degradation | >90% FRR / High degradation | Continuous operation; in-situ foulant degradation. |
| Hybrid Z-scheme System (with Graphene Oxide) [92] | Industrial Dyes | Dye Removal Efficiency | ~99% | Highly efficient charge separation for powerful redox reactions. |
| MOF-based Membrane (ZIF-300) [92] | Cu²⁺ Heavy Metal Ions | Metal Rejection / Long-term Stability | >99% after 30 days | High selectivity and stability for specific contaminants. |
Table 2: Essential Research Reagent Solutions for Hybrid System Experiments
| Reagent / Material | Function / Explanation | Application Example |
|---|---|---|
| Graphene Oxide (GO) | A 2D carbon material with a large surface area; acts as an adsorbent and an electron acceptor to suppress charge recombination in photocatalysts [89] [90]. | Synthesis of TiO₂/GO composites for enhanced dye removal [90]. |
| Metal-Organic Frameworks (MOFs) | Crystalline porous materials with ultra-high surface area and tunable porosity; excellent for selective adsorption and can be designed as photocatalysts themselves [93] [92]. | ZIF-93 membranes for high-permeance dye rejection; ZIF-300 for stable heavy metal removal [92]. |
| Semiconductor Photocatalysts (TiO₂, ZnO, g-C₃N₄) | Absorb light to generate electron-hole pairs, which then produce Reactive Oxygen Species (ROS) to degrade organic pollutants [79] [94]. | TiO₂ is a benchmark UV-activ catalyst; g-C₃N₄ is a visible-light-active metal-free catalyst [94]. |
| Carbon Nanotubes (CNTs) | Used as conductive fillers in membranes to tune permeability and provide electro-catalytic activity; can enhance mechanical strength [92]. | Fabricating electroactive CNT membranes for combined separation and electrochemical oxidation [92]. |
System Workflow and Integration Diagrams
Integrated Water Treatment Process Flow
This diagram visualizes a robust sequential integration of technologies for comprehensive water remediation. The process begins with an Adsorption Unit using materials like GO or MOFs to pre-concentrate pollutants and reduce toxicity, protecting downstream biological processes [89]. The stream then enters Biological Treatment to degrade biodegradable components. The effluent is polished in an Advanced Photocatalytic Reactor (e.g., using TiO₂/GO or Z-scheme heterojunctions) to mineralize recalcitrant pollutants [93] [94]. Finally, a Membrane Filtration Unit ensures the removal of any remaining particles, catalysts, or by-products, producing high-quality effluent. A key feature is the optional recycle of membrane concentrate back to the adsorption unit, minimizing waste and enhancing overall removal efficiency [91] [92].
Adsorption-Photocatalysis Synergy Mechanism
This diagram illustrates the molecular-level synergy in a hybrid adsorption-photocatalysis composite material. The process is initiated when Light excites the Semiconductor Photocatalyst, generating electron-hole pairs (e⁻/h⁺) [79]. The Adsorbent (e.g., Graphene Oxide) plays a dual role: it first concentrates Pollutant molecules near the catalyst surface, and second, acts as an electron shuttle, accepting the photo-generated e⁻. This electron transfer is crucial as it suppresses the recombination of e⁻ and h⁺, leaving more h⁺ available to react with H₂O/O₂ and generate powerful Reactive Oxygen Species (ROS) [89] [90]. These ROS then efficiently oxidize the concentrated pollutants into harmless Mineralized Products, regenerating the adsorbent's surface for subsequent cycles.
Performance Validation, Process Comparison, and Scalability Assessment
Comparative Analysis of Photocatalysis with Other Advanced Oxidation Processes
FAQ: Troubleshooting Common Experimental Issues
Q1: My photocatalytic degradation efficiency is low. What are the primary factors I should investigate?
Multiple factors influence photocatalytic efficiency. Systematically check and optimize these key parameters:
- Catalyst Dosage: An optimal dose is critical. Too little catalyst provides insufficient active sites, while too much can cause light scattering and reduce UV penetration [79]. For a TiO₂–clay nanocomposite, a ratio of 70:30 has been shown to be effective [15].
- Light Source and Intensity: Ensure the photon energy exceeds the catalyst's bandgap. UV light is commonly used, but visible-light-active catalysts are being developed for better solar utilization [79] [16]. The light intensity directly affects the rate of electron-hole pair generation [79].
- Solution pH: The pH affects the catalyst surface charge and the generation of reactive oxygen species. The optimal pH is often near the catalyst's point of zero charge (PZC). For example, a TiO₂–clay composite has a PZC of pH 5.8, making it most effective for cationic pollutants near neutral pH [15].
- Pollutant Concentration: Higher concentrations of pollutants can hinder degradation by blocking active sites and reducing light penetration [79].
- Catalyst Activity: The catalyst itself may have a wide bandgap (e.g., pure TiO₂) or suffer from rapid electron-hole recombination. Explore doped or composite catalysts (e.g., Bi/F-doped TiO₂, Z-scheme heterojunctions) to enhance visible light absorption and charge separation [94] [16].
Q2: How can I distinguish the primary reactive species in my photocatalytic system?
Identifying the dominant reactive species is crucial for understanding the degradation mechanism. Perform radical scavenging experiments:
- Isopropanol: Scavenges hydroxyl radicals (•OH).
- Potassium iodide (KI) or Sodium oxalate: Scavenges positive holes (h⁺).
- Chloroform or Benzoquinone: Scavenges superoxide anions (O₂•⁻) and electrons [15]. A significant decrease in degradation efficiency upon the addition of a specific scavenger indicates the importance of that corresponding species. For instance, if adding isopropanol drastically reduces efficiency, •OH is a primary oxidant. These experimental findings can be corroborated with theoretical calculations like Density Functional Theory (DFT) [15].
Q3: My catalyst shows significant activity loss after several cycles. How can I improve its stability?
Catalyst deactivation is a common challenge. Focus on immobilization and material design:
- Immobilization: Instead of using powder suspensions, immobilize the catalyst on a support to prevent loss and facilitate recovery. Supports like clay [15], nickel foam [16], or flexible plastic substrates using silicone adhesive [15] have been used successfully.
- Robust Material Design: Develop composite or heterojunction catalysts. For example, a lead-free Cs₃Bi₂I₉/Ag₃PO₄ Z-scheme heterojunction retained over 90% activity after five cycles due to its stable structure [8]. Similarly, a TiO₂/biochar composite maintained over 86% efficiency after five cycles [16].
Q4: When should I choose the Photo-Fenton process over heterogeneous photocatalysis?
The choice depends on your wastewater matrix and operational constraints.
- Choose Photo-Fenton if you are treating highly recalcitrant organic wastewater (e.g., from the cosmetics industry) and can maintain acidic conditions (pH ~3). It offers very high degradation rates; one study achieved 95.5% COD removal in 40 minutes [95].
- Choose Heterogeneous Photocatalysis if you need to operate at near-neutral pH, want to avoid iron sludge formation, or are using a catalyst immobilized in a reactor [79] [96]. It is more adaptable for continuous-flow systems and offers easier catalyst recovery.
Q5: The performance of my lab-scale AOP drops significantly when treating real wastewater. Why?
Real wastewater contains various components that interfere with AOPs.
- Scavenging Ions: Inorganic anions like Cl⁻, CO₃²⁻, and HCO₃⁻ can scavenge hydroxyl radicals (•OH) and other reactive species, forming less reactive radicals and significantly reducing degradation efficiency [16].
- Natural Organic Matter (NOM): NOM can compete with target pollutants for reactive species and block active sites on the catalyst surface.
- Suspended Solids: Turbidity can shield light penetration, reducing the activation of the photocatalyst [96]. Pre-treatment steps (e.g., filtration) to remove solids and scavengers, or increasing catalyst dosage/reaction time, may be necessary.
Quantitative Comparison of Advanced Oxidation Processes
The table below summarizes the performance, optimal conditions, and key limitations of various AOPs based on recent experimental studies.
Table 1: Comparative Analysis of Advanced Oxidation Processes for Water Remediation
| AOP Technology | Typical Catalysts/Reagents | Optimal Conditions | Reported Removal Efficiency | Key Advantages | Key Limitations & Challenges |
|---|---|---|---|---|---|
| Photocatalysis | TiO₂, ZnO, g-C₃N₄, composites [79] [16] | Varies by catalyst; often near-neutral pH [15] | 98% dye (BR46) in 90 min [15]; 99.4% Tetracycline [8] | Utilizes solar energy; no chemical sludge; proven disinfection capability [79] [16] | Electron-hole recombination; limited visible-light use for some catalysts; catalyst recovery [94] [79] |
| Photo-Fenton | Fe²⁺/Fe³⁺, H₂O₂, UV light [95] | pH = 3; [Fe²⁺] = 0.75 g/L; [H₂O₂] = 1 mL/L [95] | 95.5% COD in 40 min (cosmetic wastewater) [95] | Very fast reaction rates; high mineralization efficiency; simple setup [95] [96] | Narrow pH range; iron sludge production; requires H₂O₂ continuous feeding [95] [96] |
| UV/H₂O₂ | H₂O₂, UV light [95] | Varies with pollutant; typically acidic pH [95] | Lower than Photo-Fenton & photocatalysis [95] | Simple system; no metal catalysts | Low UV penetration in turbid water; high H₂O₂ demand can be costly [96] |
| Electchemical Oxidation (EO) | Boron-Doped Diamond (BDD) anodes [96] | Applicable to various pH; high salinity beneficial [96] | Effective for high-salinity wastewater [96] | Operational flexibility; no chemical additives; effective for recalcitrant pollutants [96] | High energy consumption; electrode fouling; high capital cost [79] [96] |
| Ozonation | O₃ [96] | Alkaline pH for •OH generation [96] | Effective for disinfection and micropollutants [96] | Powerful oxidant; improves biodegradability; no sludge production | High energy cost for O₃ generation; potential formation of toxic bromate byproducts [79] [96] |
Detailed Experimental Protocols
Protocol: Photocatalytic Degradation in a Rotary Photoreactor
This protocol details the methodology for evaluating a TiO₂–clay nanocomposite, achieving 98% dye removal in 90 minutes [15].
1. Catalyst Synthesis (TiO₂–clay Nanocomposite):
- Weigh 0.7 g of TiO₂-P25 and 0.3 g of industrial clay powder.
- Mix the solids in a beaker and add 5-10 mL of distilled water.
- Agitate the mixture with a magnetic stirrer for 4 hours at ambient temperature.
- Dry the resulting slurry in an oven at 60°C for 6 hours.
- Grind the dried product into a fine powder using a mortar and pestle [15].
2. Catalyst Immobilization:
- Prepare a flexible plastic substrate (e.g., 17 cm x 35 cm).
- Apply a thin, uniform layer of silicone adhesive to the substrate.
- Evenly sprinkle the TiO₂–clay powder onto the adhesive-coated surface using a sieve.
- Allow the immobilized catalyst bed to dry at room temperature for 24 hours [15].
3. Photoreactor Operation and Optimization:
- Assemble the rotary photoreactor. Key components include a UV-C lamp (8 W) housed in a quartz tube, a rotating PVC cylinder (with the catalyst bed attached internally), and a motor to control rotation speed.
- Prepare an aqueous solution of the target pollutant (e.g., 20 mg/L of Basic Red 46 dye).
- Set the rotational speed of the cylinder to 5.5 rpm to create a thin water film for enhanced light penetration and mass transfer.
- Expose the solution to UV light for a predetermined time (e.g., 90 min). Sample at regular intervals.
- Analyze samples using UV-Vis spectrophotometry (for dye concentration) and a TOC analyzer (for mineralization efficiency) [15].
The workflow for this experimental protocol is outlined below.
Protocol: Response Surface Methodology (RSM) for Process Optimization
This statistical method is ideal for optimizing complex AOPs where multiple factors interact.
1. Experimental Design:
- Select Factors: Identify key independent variables (e.g., catalyst concentration, pH, H₂O₂ dosage, reaction time).
- Define Response: Choose the dependent variable to optimize (e.g., % COD removal, % pollutant degradation).
- Choose a Design: Use a Central Composite Design (CCD) or Box-Behnken Design (BBD) to structure the experimental runs. This approach minimizes the number of required experiments while revealing interaction effects [8] [95].
2. Model Fitting and Analysis:
- Perform the experiments as per the design matrix.
- Use statistical software (e.g., IBM SPSS, Design-Expert) to fit the data to a multiple linear regression model.
- Analyze the model's significance (p-value) and the predictive power (R² value). An R² value of 0.851 indicates a good fit [95].
- Use analysis of variance (ANOVA) to determine the significance of each factor and their interactions.
3. Validation:
- Conduct confirmation experiments under the optimal conditions predicted by the model to validate the results [8] [95].
Essential Research Reagent Solutions
Table 2: Key Reagents and Materials for Photocatalysis Experiments
| Reagent/Material | Typical Function in Experiments | Example & Notes |
|---|---|---|
| Semiconductor Catalysts | Light absorption and generation of electron-hole pairs. | TiO₂-P25: Benchmark photocatalyst, requires UV light [15]. g-C₃N₄: Metal-free, visible-light-active catalyst [16]. |
| Dopants / Co-catalysts | To enhance visible light absorption and reduce charge recombination. | Metal ions (V, Bi, F): Doped into catalysts to modify band structure [16]. Noble metals (Ag, Au): Act as electron sinks and enhance surface plasmon resonance [16]. |
| Support Materials | To increase surface area, prevent aggregation, and facilitate immobilization. | Clay: Low-cost, natural adsorbent that synergizes with catalysts [15]. Biochar: From agricultural waste (e.g., peanut shells), provides adsorption sites and can reduce bandgap [16]. Nickel Foam: Provides a 3D porous support for catalyst immobilization [16]. |
| Chemical Scavengers | To identify the primary reactive species in the mechanism. | Isopropanol: For hydroxyl radicals (•OH). Sodium Oxalate: For holes (h⁺). Benzoquinone: For superoxide anions (O₂•⁻) [15]. |
| Target Pollutants | Model compounds to evaluate system performance. | Basic Red 46 / Methylene Blue: Model dye pollutants [15]. Tetracycline: Model antibiotic pollutant [8]. |
| Oxidizing Agents | To enhance radical generation in some AOPs. | Hydrogen Peroxide (H₂O₂): Used in Photo-Fenton and UV/H₂O₂ processes [95]. PMS (Peroxymonosulfate): An alternative oxidant activated by light or catalysts to generate sulfate radicals [16]. |
Fundamental Mechanism of Heterogeneous Photocatalysis
The following diagram illustrates the general mechanism of semiconductor photocatalysis, which is foundational to understanding and troubleshooting the process.
Kinetic Modeling and Degradation Pathway Elucidation via Experimental and Theoretical Methods
Frequently Asked Questions (FAQs)
FAQ 1: What are the most common kinetic models used to describe photocatalytic degradation, and how do I choose the right one?
The most prevalent model is the Langmuir-Hinshelwood (L-H) model, which is often simplified to a pseudo-first-order model when pollutant concentrations are low [97]. The choice depends on your system's complexity and the parameters you wish to understand.
- Pseudo-First-Order Model: Best for initial screening and describing degradation when the pollutant concentration is low. It provides a simple rate constant (k). For example, the degradation of Basic Red 46 (BR46) dye followed this model with a rate constant of 0.0158 min⁻¹ [15].
- Langmuir-Hinshelwood Model: Ideal for systems where you need to account for adsorption equilibrium and the degradation rate on the catalyst surface [97].
- Complex L-H Variations: Necessary when you must model additional factors like catalyst excitation, electron-hole pair recombination, reactive oxygen species (ROS) generation, and by-product formation [97].
- Data-Driven Models (ANN, RSM): Use Artificial Neural Networks (ANNs) or Response Surface Methodology (RSM) when optimizing multiple operational conditions (e.g., pH, catalyst dose, light intensity) simultaneously or when dealing with complex, non-linear relationships in your data [97].
FAQ 2: My photocatalytic degradation efficiency is low. What are the primary factors I should investigate?
Low efficiency often stems from the rapid recombination of photogenerated electron-hole pairs. To address this, consider both material design and operational parameters.
- Material Design: Develop catalysts with structures that enhance charge separation. Effective strategies include:
- Constructing donor-acceptor (D-A) systems, like oxygen and cyano group-modified carbon nitride (OCPCN), which significantly promote charge transfer [98].
- Forming Z-scheme heterojunctions (e.g., PPy/NH₂-UiO-66) to maintain high redox potential while improving charge separation [99].
- Using stabilizers (e.g., silicone adhesive) to firmly immobilize the catalyst, preventing detachment and loss of active sites [15].
- Operational Parameters:
- Light Intensity & Wavelength: Ensure the light source provides sufficient energy (greater than the catalyst's band gap) and matches its absorption spectrum. Recent systems even function under ultra-low light intensity (0.1 mW cm⁻²) using novel oxidative species [33].
- pH: Operate at a pH that favors adsorption of the target pollutant onto the catalyst surface, which is determined by the catalyst's point of zero charge (PZC) [15] [79].
- Pollutant Concentration: Higher concentrations can saturate active sites and hinder light penetration, reducing efficiency [79].
FAQ 3: How can I reliably identify the reactive oxygen species (ROS) responsible for degradation in my system?
A combination of scavenger experiments and advanced spectroscopy is the most reliable approach.
- Radical Scavenger Experiments: Introduce specific chemicals that quench particular ROS and observe the change in degradation efficiency.
- Electron Spin Resonance (ESR) Spectroscopy: Directly detects and identifies paramagnetic ROS, such as
•OHand•O₂⁻, often using spin-trap agents like DMPO [98] [99]. This provides direct evidence of ROS generation under illumination. - Fluorescence/UV-Vis Probes: Use chemical probes that react with specific ROS to form detectable compounds. For example, terephthalic acid (TA) can trap
•OHto form a highly fluorescent product, and nitroblue tetrazolium (NBT) can be reduced by•O₂⁻[99].
FAQ 4: What is the best way to elucidate the complete degradation pathway of an organic pollutant?
Combining analytical chemistry with theoretical calculations provides a comprehensive picture.
- Identify Intermediates: Use Gas Chromatography-Mass Spectrometry (GC-MS) or Liquid Chromatography-Mass Spectrometry (LC-MS) to detect and identify the intermediate products formed during degradation [15] [98].
- Theoretical Calculations: Apply Density Functional Theory (DFT) to:
- Propose Pathways: Correlate the identified intermediates with the DFT-predicted reactive sites to map out plausible degradation pathways, such as hydroxylation, ring-opening, and dealkylation [98] [99].
FAQ 5: How can I assess the environmental safety and practical viability of my photocatalytic process?
It is crucial to evaluate both the toxicity of the degradation products and the stability of the catalyst.
- Toxicity Assessment of By-Products:
- Computational Tools: Use software like the Toxicity Estimation Software Tool (T.E.S.T.) to predict the acute toxicity, developmental toxicity, and bioaccumulation potential of the identified intermediates [98] [99].
- Bioassays: Conduct laboratory toxicity tests with organisms like zebrafish, wheat seeds, or Escherichia coli to observe the actual biological impact of the treated water [98].
- Catalyst Stability & Reusability:
- Perform multiple degradation cycles with the same catalyst batch and measure the loss of activity. A robust catalyst, like the TiO₂-clay nanocomposite, should maintain >90% efficiency after several cycles [15].
- Characterize the used catalyst with techniques like XRD and FT-IR to check for structural changes or deactivation [100].
- Treatment of Real Wastewater: Test the system on real industrial wastewater (e.g., electroplating, medical) to evaluate performance under complex matrices and interfering ions [99].
Experimental Protocols
Protocol 1: Determining Degradation Kinetics and Rate Constant
This protocol outlines the steps to obtain the kinetic data and model the degradation rate of a pollutant.
- Experimental Setup: Conduct batch experiments in your photoreactor. Keep all parameters constant (light intensity, catalyst loading, pH, temperature) except the initial pollutant concentration.
- Sampling: At regular time intervals, withdraw a small aliquot of the solution.
- Analysis: Centrifuge the aliquot to remove catalyst particles. Measure the remaining pollutant concentration using UV-Vis spectrophotometry at the compound's characteristic absorption wavelength [15].
- Data Fitting:
- Pseudo-First-Order Model: Plot
ln(C₀/C)against time (t). The slope of the linear fit is the apparent rate constant (k). A high coefficient of determination (R² > 0.97) indicates a good fit [15]. - Langmuir-Hinshelwood Model: Fit your concentration-time data to the integrated form of the L-H equation. This typically requires non-linear regression analysis.
- Pseudo-First-Order Model: Plot
Protocol 2: Identifying Active Reactive Oxygen Species (ROS)
This protocol uses scavenger experiments to pinpoint the dominant ROS in the photocatalytic process.
- Selection of Scavengers: Choose specific and validated scavengers. For example:
•OHScavenger: Isopropanol (IPA)•O₂⁻Scavenger: p-Benzoquinone (BQ) or Nitroblue tetrazolium (NBT)- Hole (h⁺) Scavenger: Ethylenediaminetetraacetic acid (EDTA)
¹O₂Scavenger: Sodium azide (NaN₃)
- Experimental Run: Perform the standard photocatalytic degradation experiment.
- Scavenger Addition: To a separate, but identical, reaction mixture, add a controlled amount of the scavenger (e.g., 1 mM) before turning on the light.
- Efficiency Comparison: Measure the degradation efficiency after the same irradiation time and compare it to the experiment without any scavenger.
- Interpretation: A significant inhibition of degradation in the presence of a particular scavenger indicates that the corresponding ROS plays a major role.
Protocol 3: Tracing Degradation Pathways via LC-MS and DFT
This protocol combines analytical and computational methods to map how a pollutant breaks down.
- Sample Preparation: Carry out the photocatalytic reaction and collect samples at key time points (e.g., 0, 15, 30, 60 minutes).
- Intermediate Identification: Analyze the samples using LC-MS or GC-MS. Identify the m/z ratios and fragmentation patterns of the degradation intermediates [15] [98].
- DFT Calculations:
- Geometry Optimization: Use software (e.g., Gaussian) to optimize the molecular geometry of the parent pollutant at a level like ωB97XD/6-311G(d,p) [33].
- Fukui Function Analysis: Perform a population analysis (e.g., Natural Population Analysis) on the optimized structure to calculate Fukui indices (f⁺ and f⁻) and identify atoms with high electrophilic or nucleophilic character [98].
- Pathway Proposal: Correlate the MS-identified intermediates with the DFT-predicted reactive sites. Propose a logical degradation pathway showing the sequential breakdown of the molecule, from initial attack to final mineralization [98].
Data Presentation
| Photocatalyst | Target Pollutant | Optimal Conditions | Kinetic Model | Rate Constant (k) | Degradation Efficiency | Reference |
|---|---|---|---|---|---|---|
| TiO₂-Clay Nanocomposite | Basic Red 46 (BR46) | 20 mg/L, pH ~5.8, 90 min UV | Pseudo-First-Order | 0.0158 min⁻¹ | 98% (Dye), 92% (TOC) | [15] |
| OCPCN (Carbon Nitride) | Imidacloprid | Not Specified | Pseudo-First-Order | 0.0377 min⁻¹ | 91% | [98] |
| CN-KI-I3 / PI | Sulfamethoxazole (SMX) | Visible Light | Pseudo-First-Order | 0.5681 min⁻¹ | 99.14% | [101] |
| PPy/NU-1 Z-scheme | Tetracycline (TC) | Visible Light | Pseudo-First-Order | 0.011 min⁻¹ | High (Not Specified) | [99] |
Table 2: Key Analytical Techniques for Pathway Elucidation and Mechanism Study
| Technique | Acronym | Primary Function in Photocatalysis Research | Key Information Obtained |
|---|---|---|---|
| Gas Chromatography-Mass Spectrometry | GC-MS | Identifies volatile/intermediate degradation products | Molecular weight and structure of by-products for pathway mapping [15] |
| Liquid Chromatography-Mass Spectrometry | LC-MS | Identifies non-volatile/intermediate degradation products | Molecular weight and structure of by-products for pathway mapping [98] |
| Electron Spin Resonance Spectroscopy | ESR / EPR | Detects and identifies short-lived radical species | Direct confirmation of ROS generation (e.g., •OH, •O₂⁻) [98] [99] |
| Density Functional Theory | DFT | Models electronic structure and predicts reactivity | Fukui indices, HOMO/LUMO distribution, reaction energies [15] [98] |
| High-Performance Liquid Chromatography | HPLC | Separates and quantifies compounds in a mixture | Concentration of parent pollutant and specific intermediates [99] |
Workflow and Pathway Visualization
Diagram 1: Experimental Workflow for Kinetic and Pathway Analysis
Diagram 2: Common Photocatalytic Degradation Mechanism
The Scientist's Toolkit: Key Research Reagent Solutions
Table 3: Essential Materials and Reagents for Photocatalysis Research
| Reagent / Material | Function / Application | Example from Context |
|---|---|---|
| TiO₂-P25 | Benchmark semiconductor photocatalyst; high activity under UV light. | Used as a base material in the TiO₂-clay nanocomposite [15]. |
| Carbon Nitride (g-C₃N₄) | Metal-free, visible-light-responsive semiconductor; easily modifiable. | Base for creating donor-acceptor structures (OCPCN) [98]. |
| Radical Scavengers (e.g., Isopropanol, p-Benzoquinone) | To identify the dominant Reactive Oxygen Species (ROS) in the mechanism via quenching experiments. | Used to determine that ¹O₂ was the primary ROS for imidacloprid degradation [98]. |
| Spin Trap Agents (e.g., DMPO) | To trap short-lived radical species for detection by Electron Spin Resonance (ESR) spectroscopy. | Used to provide direct evidence of •O₂⁻ and •OH radical generation [99]. |
| I⁻/I₃⁻ Redox Mediator | A redox shuttle that facilitates charge separation and enhances catalyst stability in situ. | Key component in dynamically reconstructing active sites for photo-Fenton-like reactions [101]. |
| Silicone Adhesive | A stabilizing agent for immobilizing powdered photocatalysts on flexible substrates. | Used to create a stable, reusable TiO₂-clay bed in a rotary photoreactor [15]. |
Performance Metrics and Quantitative Data
Evaluating a photocatalytic process requires tracking key performance metrics that indicate efficiency and environmental impact.
Table 1: Key Performance Metrics in Photocatalytic Water Treatment
| Metric | Definition | Measurement Methods | Typical Target Values | Significance |
|---|---|---|---|---|
| Removal Efficiency | The percentage of a target contaminant removed from the aqueous solution over a specified time [102]. | Spectrophotometry (e.g., for dyes), HPLC, GC-MS for specific contaminants [102]. | > 99% for organic pollutants like Tetracycline [8]; 99.9999% for bacteria [103]. | Indicates the speed and effectiveness of the initial pollutant degradation. |
| Mineralization Rate | The percentage of Total Organic Carbon (TOC) abatement, indicating complete conversion of organic carbon to CO₂ and water [8]. | TOC analyzer [8]. | Up to 83% TOC abatement for antibiotics [8]. | Confirms complete destruction of pollutants, not just transformation into intermediate compounds. |
| Biodegradability Enhancement | The improvement in the biodegradability of wastewater, often measured by the ratio of Biological Oxygen Demand (BOD) to Chemical Oxygen Demand (COD) [26]. | BOD and COD tests [26]. | An increasing BOD/COD ratio indicates enhanced biodegradability [26]. | Shows the process breaks down recalcitrant compounds into simpler, more biodegradable molecules. |
Table 2: Exemplary Performance Data from Recent Research
| Photocatalyst | Target Pollutant | Removal Efficiency | Mineralization Rate (TOC) | Toxicity Assessment |
|---|---|---|---|---|
| Cs₃Bi₂I₉/Ag₃PO₄ (9-CBIAPO) [8] | Tetracycline (26.9 mg L⁻¹) | 99.36% [8] | 83% abatement [8] | 13 less toxic intermediates identified; declining ecotoxicity along pathway [8]. |
| Optimized BiOCl [102] | Acid Orange 7 dye (20 ppm) | 100% within 90 min [102] | Information not specified | Toxicity of intermediates "about AO7 or lower" [102]. |
| Puralytics Shield [103] | Broad-spectrum organics, bacteria, virus | >70% reduction for organics; 99.9999% bacteria; 99.99% virus [103] | Organic molecules break down into H₂O and trace CO₂ [103] | Contaminants destroyed; no waste stream for landfill [103]. |
Troubleshooting Common Experimental Issues
This section addresses frequent challenges researchers face when conducting photocatalytic water remediation experiments.
FAQ 1: Why is my pollutant removal efficiency low, even with a visible-light-active catalyst? Several factors can cause low removal efficiency. First, ensure your catalyst dosage is optimized; excessive loading can cause light scattering and reduce photon penetration, while insufficient dosage provides inadequate active sites [79]. Second, confirm the pH of the solution, as it affects the surface charge of the catalyst and the ionization state of the pollutant, influencing adsorption [79]. Finally, electron-hole recombination is a common bottleneck. Consider strategies like constructing heterojunctions (e.g., Z-scheme systems) or employing electron spin control through doping or magnetic fields to enhance charge separation [78] [5].
FAQ 2: My TOC analysis shows low mineralization, despite high pollutant removal. Where are the intermediates, and are they toxic? High parent compound removal with low mineralization indicates the accumulation of transformation intermediates [8]. This is a critical issue for environmental application. To address it:
- Identify Intermediates: Use Liquid Chromatography-Mass Spectrometry (LC-MS) to identify the intermediate compounds formed during the degradation process [8].
- Assess Toxicity: Perform ecological structure-activity relationship (ECOSAR) calculations or use software like T.E.S.T. to predict the toxicity of the identified intermediates. Experimental bioassays (e.g., @Microtox) can validate these predictions [102]. A successful process will show a trend of declining toxicity along the reaction pathway [8].
FAQ 3: How can I enhance the biodegradability of industrial wastewater using photocatalysis? Photocatalysis can pre-treat recalcitrant wastewater by breaking down complex molecules into simpler, more readily biodegradable organic acids and aldehydes [26]. Monitor the BOD₅/COD ratio; an increasing ratio signifies enhanced biodegradability. The optimal pre-treatment time is when this ratio peaks, allowing for subsequent efficient biological treatment without complete mineralization [26].
FAQ 4: What should I do if my photocatalyst shows signs of deactivation or instability? Photocatalyst deactivation can occur due to poisoning (e.g., by heavy metals adsorbing on active sites), photocorrosion, or leaching of active components [103] [79].
- For Heavy Metal Poisoning: In systems like the Puralytics Shield, accumulated heavy metals can slow performance and require cartridge replacement [103]. A quick functional test (e.g., Pur-Blue test) can determine if the catalyst is still active [103].
- For Photocorrosion: Use more stable oxide semiconductors or protective coatings. To assess stability, perform recycling experiments (typically 5+ cycles) and characterize the used catalyst with techniques like XRD and SEM to check for structural or morphological changes [8] [79].
Essential Experimental Protocols
Protocol: Synthesis of an Optimized Photocatalyst via Hydrothermal Method
This protocol details the synthesis of Bismuth Oxychloride (BiOCl) optimized using Central Composite Design (CCD), as per recent research [102].
Key Optimization Parameters [102]:
- Temperature: 157 °C
- Residence Time: 23.96 hours
- pH: 8.97
- Additive Concentration: 0.458 mol/L D-Mannitol
Protocol: Standardized Photocatalytic Degradation Experiment
This is a general procedure for evaluating photocatalytic performance in a batch reactor.
Critical Operational Parameters [102] [79]:
- Catalyst Dosage: Typically 0.1 - 1.0 g/L. An optimum exists; excess catalyst hinders light penetration.
- Initial Pollutant Concentration: Degradation rate typically decreases with higher concentration (e.g., 10, 20, 50 ppm) [102].
- Solution pH: Test at various pH levels (e.g., 5, 7, 9) as it drastically influences efficiency and reaction pathway [102] [79].
- Light Source: UVC is common, but visible light systems are the target for sustainability [79].
The Scientist's Toolkit: Key Research Reagents & Materials
Table 3: Essential Reagents and Materials for Photocatalysis Research
| Item | Function/Description | Example from Research |
|---|---|---|
| Semiconductor Precursors | Raw materials for synthesizing the photocatalyst. | CsI, BiI₃ for lead-free perovskites [8]; Bi(NO₃)₃·5H₂O, KCl for BiOCl [102]. |
| Structural Directing Agents | Additives used during synthesis to control morphology and crystal structure. | D-Mannitol, used to optimize the hierarchical structure of BiOCl for improved performance [102]. |
| Target Pollutant Standards | High-purity analytical standards of the contaminants under investigation. | Acid Orange 7 (AO7) dye [102]; Tetracycline (TC) antibiotics [8]. |
| Scavenging Agents | Chemicals used in trapping experiments to identify the primary reactive species. | Isopropanol (for •OH), EDTA-2Na (for h⁺), Benzoquinone (for •O₂⁻) [8]. |
| Analytical Standards for Intermediates | Reference standards for identifying and quantifying degradation by-products via LC-MS/GC-MS. | Used to identify 13 intermediates from Tetracycline degradation [8]. |
Troubleshooting Guides
Guide: Diagnosing and Mitigating Catalyst Deactivation
Problem: Observed decline in photocatalytic degradation efficiency over multiple reaction cycles.
| # | Observation | Potential Root Cause | Diagnostic Experiments | Corrective & Preventative Actions |
|---|---|---|---|---|
| 1 | Gradual loss of activity with metal leaching | Catalyst dissolution/ photocorrosion in aqueous medium | - ICP-OES/IC Analysis: Measure leached metal/ion concentrations in treated water post-reaction [71].- XPS Surface Analysis: Compare fresh vs. spent catalyst surface composition and elemental states [71]. | - Spatial Confinement: Integrate catalyst within a stabilizing matrix (e.g., graphene oxide layers) to confine leached ions and preserve activity [71].- Protective Coating: Design core-shell structures with a chemically stable outer layer. |
| 2 | Drop in activity without significant leaching | Active site poisoning or fouling by reaction intermediates/inorganics | - SEM/TEM: Inspect for physical coating or morphological changes [71].- FT-IR: Identify adsorbed species on the catalyst surface [104].- TOC Analysis: Assess if incomplete mineralization leads to carbonaceous deposits. | - Catalyst Regeneration: Implement post-cycle washing with solvent (e.g., methanol) or calcination at moderate temperatures [104].- Pre-treatment: Remove competing inorganic ions or organics from wastewater feed. |
| 3 | Reduced activity and difficulty in recovery | Physical loss or attrition of catalyst particles | - Mass Balance: Measure catalyst mass pre- and post-reaction, especially in slurry systems.- Particle Size Analysis: Monitor for particle breakdown. | - Catalyst Immobilization: Anchor catalysts on robust supports (e.g., polymer spheres, fabrics, or membranes) [64] [105].- Switch to Fixed-Bed or continuous flow reactor designs to circumvent filtration [106]. |
Guide: Addressing Inconsistent Reusability Test Results
Problem: Catalyst performance varies significantly between consecutive reuse cycles.
| # | Observation | Potential Root Cause | Diagnostic Experiments | Corrective & Preventative Actions |
|---|---|---|---|---|
| 1 | Inconsistent regeneration between cycles | Incomplete removal of pollutants/adsorbates during recycling protocol | - BET Surface Area Analysis: Quantify changes in surface area and pore volume after regeneration [105].- Elemental Analysis (CHNS): Check for residual carbonaceous deposits. | - Standardize Regeneration: Establish a strict, reproducible washing protocol (e.g., specified solvent volume, duration, and drying conditions) [104].- Characterize Between Cycles: Use FT-IR or XRD to ensure the catalyst returns to its baseline state before reuse. |
| 2 | Variable activity in different water matrices | Interference from background water constituents (ions, NOM) | - Water Chemistry Analysis: Characterize anion/cation concentrations and NOM in the wastewater.- Scavenger Tests: Introduce radical scavengers (e.g., isopropanol for •OH) to quantify radical contribution in different matrices [105]. | - Pre-treatment: Use filtration or coagulation to remove interfering substances [79].- Catalyst Design: Develop membranes that reject NOM via size exclusion while allowing catalytic degradation of micropollutants [71]. |
| 3 | Erratic performance in visible-light systems | Unstable structure of narrow bandgap semiconductors (e.g., Ag3PO4) | - XRD & XPS: Monitor for phase changes or metallic Ag formation on the catalyst surface [105].- UV-Vis DRS: Track changes in optical absorption properties after cycles. | - Construct Heterojunctions: Couple with other semiconductors (e.g., ZnFe2O4, HTCC) or materials to enhance charge separation and stability [105].- Apply Protective Layers: Use co-catalysts or carbon layers to inhibit photocorrosion. |
Frequently Asked Questions (FAQs)
Q1: What are the key quantitative metrics for reporting catalyst stability and reusability? A1: The table below summarizes the essential metrics that should be reported to provide a comprehensive assessment.
| Metric | Definition & Formula | Reporting Standard |
|---|---|---|
| Number of Reuse Cycles | The total number of times a catalyst is successfully reused with acceptable performance drop. | Report the maximum cycles tested and the performance at each cycle [104]. |
| Removal Efficiency Retention | ( \text{Retention (\%)} = \frac{\text{Efficiency at cycle } n}{\text{Initial Efficiency}} \times 100 ) | Report for all cycles. A high-performing catalyst showed ~79% retention after 22 cycles (from 92.5% to 73.2%) [104]. |
| Electrical Energy per Order (E EO) | ( E{EO} = \frac{P \times t \times 1000}{V \times \log(Ci/C_t)} ) Where P = power (kW), t = time (h), V = volume (L), Ci and Ct = initial and final concentration. | Critical for techno-economic assessment. For UV/TiO2, values of 10.79 kWh/m³ for COD removal and 5.16 kWh/m³ for colour removal have been reported [106]. |
| Economic Viability | Calculated via Life Cycle Costing (LCC). Key indicators: Payback Period and Return on Investment (ROI). | Heterogeneous catalysis was shown to be 85% more cost-efficient than homogeneous methods, with a payback period of 0.89 years and an ROI of 112.5% [104]. |
Q2: What are the best practices for cleaning and regenerating catalysts between cycles? A2: A common and effective method involves washing with solvents like methanol or ethanol, followed by drying. For instance, in biodiesel production, Amberlyst CSP2 catalyst was reused 22 times by implementing continuous methanol washing with nitrogen gas, which helped sustain catalytic activity by removing adsorbed reactants and products [104]. The specific protocol (solvent type, washing duration, and drying temperature) must be optimized for your catalyst-pollutant system.
Q3: How can I improve my catalyst's stability against photocorrosion and radical attack? A3: Advanced material strategies include:
- Spatial Confinement: Intercalating catalysts like iron oxyfluoride (FeOF) between layers of graphene oxide. The angstrom-scale confinement mitigates catalyst deactivation by restricting the movement of leached ions and shielding the catalyst from bulk radical species [71].
- Constructing Heterojunctions: Building composites like HTCC@ZnFe2O4/Ag3PO4 (HZFA). The internal electric field at the heterojunction interface promotes the separation of photogenerated electrons and holes, reducing charge carrier recombination and minimizing self-oxidation of the catalyst [105].
Q4: How do real wastewater constituents affect catalyst lifespan and how can this be managed? A4: Inorganic ions (e.g., Cl⁻, SO₄²⁻, CO₃²⁻) and Natural Organic Matter (NOM) can scavenge reactive radicals, compete for active sites, or cause catalyst aggregation [79]. To manage this:
- Pre-treatment: Use conventional methods to reduce the concentration of interferents.
- Catalyst/Membrane Design: Employ catalytic membranes that physically exclude larger NOM molecules via size exclusion while simultaneously degrading smaller pollutants in the confined spaces, thus preserving radical availability for target contaminants [71].
Q5: What is a realistic benchmark for the number of reuse cycles in research studies? A5: While highly dependent on the catalyst and reaction conditions, a well-designed heterogeneous catalyst should demonstrate stability for a minimum of 5 cycles with minimal activity loss. High-performing catalysts, such as ion-exchange resins (Amberlyst CSP2) in esterification, have been shown to maintain functionality for over 20 cycles [104]. The goal is to maximize cycles while maintaining a high level of performance.
Experimental Protocols for Assessment
Standard Protocol for Catalyst Reusability and Lifespan Testing
Objective: To determine the stability and reusability of a photocatalyst over multiple operational cycles.
Materials:
- Photocatalytic reactor system (batch or continuous)
- Prepared photocatalyst (immobilized or powder)
- Target pollutant stock solution (e.g., 10 mg/L of dye or specific organic contaminant)
- Light source (UV or visible, calibrated for intensity)
- Centrifuge (for powder catalyst recovery) or apparatus for immobilized catalyst retrieval
- Oven or desiccator for drying
- Analytical instrument (e.g., UV-Vis spectrophotometer, HPLC, TOC analyzer)
Methodology:
- Initial Run: Place the catalyst and pollutant solution in the reactor. Irradiate while stirring for a predetermined time. Sample the solution at regular intervals to measure pollutant concentration and determine the initial degradation efficiency.
- Catalyst Recovery: After the run, recover the catalyst.
- For powder catalysts: Centrifuge the reaction mixture, collect the solid catalyst, and wash it thoroughly with a specified solvent (e.g., deionized water, methanol). Dry the catalyst (e.g., at 60°C for 2 hours) [104].
- For immobilized catalysts: Simply retrieve the substrate (e.g., fabric, membrane, spheres) and rinse it with solvent [64] [105].
- Reuse Cycles: Reuse the recovered catalyst in a fresh batch of pollutant solution under identical reaction conditions. Repeat steps 1 and 2 for the desired number of cycles (e.g., 5-10 cycles for initial assessment).
- Analysis: Measure the degradation efficiency for each cycle. Plot efficiency versus cycle number to visualize the performance decay. Calculate the removal efficiency retention.
Protocol for Economic Viability Analysis via Life Cycle Costing (LCC)
Objective: To evaluate the economic feasibility and cost savings of implementing a reusable catalyst compared to a conventional single-use process.
Materials:
- Data on catalyst synthesis/preparation costs (raw materials, energy)
- Operational data (energy consumption per cycle, labor, waste disposal)
- Performance data (catalyst lifespan, number of reuses, yield)
- LCC software or spreadsheet model
Methodology:
- Define Goal and Scope: Conduct a cradle-to-gate assessment covering raw material extraction, catalyst manufacturing, and its use phase. Exclude end-of-life stages [104].
- Life Cycle Inventory (LCI): Collect quantitative data on all inputs and outputs.
- Inputs: Mass of catalyst, chemicals for synthesis, energy for reactor operation (calculate EEO if applicable), and regeneration.
- Outputs: Mass of treated water, mass of waste generated (e.g., spent homogeneous catalyst sludge).
- Cost Calculation:
- Calculate the total cost for the heterogeneous, reusable catalyst system over its entire lifespan, accounting for initial synthesis and periodic regeneration.
- Calculate the total cost for an equivalent homogeneous catalyst system, including the cost of fresh catalyst for every batch and waste disposal.
- Impact Assessment and Interpretation:
- Compare the total costs of the two systems.
- Calculate key financial indicators:
- Payback Period = Investment in heterogeneous system / Annual cost savings
- Return on Investment (ROI) = (Net cost savings / Investment) × 100%
- A study on biodiesel production found heterogeneous catalysis to be 85% more cost-efficient with a payback period of 0.89 years and an ROI of 112.5% [104].
The Scientist's Toolkit: Research Reagent Solutions
| Essential Material / Reagent | Function in Stability & Reusability Assessment |
|---|---|
| Amberlyst CSP2 Resin | A macroreticular ion-exchange resin used as a heterogeneous acid catalyst. Serves as a benchmark for reusability studies, demonstrating stability over 20+ cycles in esterification reactions [104]. |
| Iron Oxyhalides (FeOF, FeOCl) | Highly efficient heterogeneous Fenton catalysts. Used to study catalyst deactivation mechanisms, particularly halide leaching, and to test stabilization strategies like spatial confinement [71]. |
| Heterostructured Nanocomposites (e.g., HZFA) | Composites like HTCC@ZnFe2O4/Ag3PO4 are used to create built-in electric fields that enhance charge separation, improving stability and enabling in-situ H2O2 production for Fenton reactions [105]. |
| Graphene Oxide (GO) Matrix | A 2D material used as a flexible, stable support to create angstrom-scale confined spaces. It mitigates catalyst deactivation by trapping leached ions and rejecting large foulants [71]. |
| Polypropylene (PP) Spheres | An inert, low-cost substrate for immobilizing powdered catalysts. Facilitates easy catalyst recovery and reuse in batch systems, preventing physical loss and enabling cyclic testing [105]. |
Frequently Asked Questions (FAQs)
FAQ 1: What are the most critical factors to consider when scaling up a photocatalytic water treatment process from the lab?
When moving from laboratory to pilot scale, several factors become critically important. Oxygen availability is a key limiting factor often overlooked during scale-up; while laboratory systems may rely on passive diffusion, pilot-scale operations require active aeration to maintain dissolved oxygen levels and prevent process inhibition [107]. Light distribution inside the reactor is another paramount parameter; efficient designs use internal LED illumination or light-delivery tubes to ensure uniform irradiation and minimize dead zones [107] [108]. Furthermore, energy consumption must be optimized by finding a balance between irradiation energy and other process energies, such as droplet generation in mist-based systems [109].
FAQ 2: How does catalyst design and selection impact the economic viability of a large-scale photocatalytic system?
Catalyst design directly influences both initial material costs and long-term operational stability. Selecting earth-abundant, non-toxic materials like TiO2 or g-C3N4 enhances safety and reduces raw material extraction costs [110]. Strategies such as immobilizing the photocatalyst on a fixed substrate (e.g., a TiO2-coated Luffa cylindrica matrix or ceramic monoliths) prevent catalyst loss, enables long-term reuse, and eliminates the need for separation downstream [107] [111]. Furthermore, creating heterojunctions (e.g., g-C3N4/BiOI) can narrow the band gap, improve visible light response, and increase overall activity, which enhances efficiency and can reduce the required reactor size [110] [79].
FAQ 3: Our pilot system's degradation efficiency has dropped compared to lab results. What could be the cause?
A drop in efficiency during scale-up is a common challenge. First, check for depletion of dissolved oxygen, as this is a common electron scavenger and its absence can severely inhibit the photocatalytic oxidation process [107]. Second, evaluate the light distribution; in a larger reactor, shadows or inadequate light penetration can leave significant portions of the catalyst inactive [108]. Third, analyze the water matrix; inorganic ions present in real wastewater can scavenge reactive species or block active sites on the catalyst surface, reducing the degradation rate of the target pollutant [79].
FAQ 4: Are there established methods for real-time monitoring and control of pilot-scale photocatalytic reactors?
Yes, emerging Internet of Things (IoT) architectures allow for real-time monitoring and automatic regulation. These systems can remotely sense key parameters such as Oxidation-Reduction Potential (ORP), temperature, pH, and total dissolved solids (TDS) [107]. ORP is particularly valuable as it can indicate the oxidative state of the system. Furthermore, integrating electrochemical sensors directly into the reactor is a promising approach for in-situ, real-time analysis of process intermediates or reactive oxygen species, enabling more accurate process control [112].
Troubleshooting Guides
Issue 1: Inconsistent or Declining Pollutant Degradation Efficiency
Problem: The system fails to maintain a consistent and high degradation rate for target pollutants.
- Check Oxygen Supply: Confirm that active aeration is functioning and dissolved oxygen (DO) levels are sufficient. Oxygen acts as an electron acceptor, preventing recombination of photogenerated charge carriers. Depleted DO is a common limitation in sealed or large-scale systems [107].
- Inspect Light Source and Distribution: Verify the intensity and uniformity of light irradiation across the catalyst surface. Look for catalyst fouling or aging UV lamps/LEDs that reduce light intensity. Ensure the reactor design provides uniform illumination to all catalytic surfaces [111] [108].
- Assess Catalyst Integrity: For immobilized catalyst systems, check for mechanical abrasion, fouling, or chemical poisoning. For slurry systems, confirm that catalyst concentration is maintained and agglomeration is minimized [107] [79].
- Analyze Wastewater Matrix: Test for fluctuations in the concentration of background organics or inorganic ions that may compete for reactive species or block active sites [79].
Issue 2: High Specific Energy Consumption
Problem: The energy required to treat a unit volume of wastewater is prohibitively high.
- Optimize Operational Parameters: Energy consumption is often a balance between different energy inputs. For example, in a mist-based system, find the optimal droplet size that minimizes the sum of droplet generation energy and irradiation energy [109].
- Leverage Visible Light Catalysts: Transition from pure UV-light catalysts (e.g., standard TiO2) to visible-light-responsive catalysts (e.g., doped TiO2, g-C3N4 composites). This allows for a greater utilization of the solar spectrum or more energy-efficient LEDs [110] [79].
- Implement Smart Control Systems: Use an IoT-controlled system to dynamically adjust light intensity and aeration rates based on real-time pollutant load and water quality parameters, preventing energy waste during low-load periods [107].
Issue 3: Challenges in System Integration and Long-Term Stability
Problem: Difficulty in integrating the photocatalytic process into existing infrastructure or maintaining performance over long durations.
- Adopt a Modular Design: Consider scalable reactor designs like the Photocatalytic Nanofiltration Reactor (PNFR), which uses multiple, standardized membrane monoliths and can be sized to match required throughput [111].
- Focus on Catalyst Immobilization: Ensure the catalyst binding method (e.g., wash-coating, embedding in polymer fibers) is robust enough to withstand long-term hydraulic conditions without significant detachment or performance loss [107] [111].
- Plan for Separate Product Collection: For photocatalytic water splitting, use a system with separate cells for hydrogen and oxygen evolution. This prevents backward reactions (recombination into water) and safety hazards, which is crucial for stable, long-term operation [113].
Quantitative Data for Scalability Assessment
Table 1: Techno-Economic Assessment (TEA) of Hydrogen Production via Photocatalytic Water Splitting [110]
| Photocatalyst Pathway | Levelized Cost of Hydrogen (LCOH) | Key Cost Contributors |
|---|---|---|
| TiO2 Nanorods (TNRs) | $4.9 USD/kg H₂ | Capital investment and labour (~75%) |
| CNF: TNRs/TiO2 | $5.7 USD/kg H₂ | Capital investment and labour (~75%) |
| g-C3N4 | $5.8 USD/kg H₂ | Capital investment and labour (~75%) |
| BiOI/g-C3N4-S | $7.8 USD/kg H₂ | Capital investment and labour (~75%) |
Table 2: Key Performance Indicators from Recent Pilot-Scale Studies
| System Description | Scale / Capacity | Key Performance Indicator | Value | Identified Challenge |
|---|---|---|---|---|
| IoT-Controlled LED System [107] | Pilot-scale | Pharmaceutical Degradation (NPX, AMX) & COD Reduction | High efficiency & up to 54% COD reduction | Oxygen availability as a key limiting factor at scale |
| Photocatalytic Nanofiltration Reactor (PNFR) [111] | 15 m³/day | Pesticide (TBZ) Removal & Water Recovery | ~41.5% removal & 95% water recovery achievable | Fouling control, catalyst attachment stability |
| Solar-Driven H₂/O₂ Production [113] | 692.5 cm² panel | Solar-to-Hydrogen (STH) Efficiency | 2.47% (lab), 1.21% (outdoor week-long test) | Maintaining efficiency upon scale-up and outdoor operation |
| Photocatalyst-Containing Droplets [109] | Lab-scale model | Specific Energy Consumption | Can be minimized at an optimal droplet size | Balancing droplet generation energy with irradiation energy |
Experimental Protocols for Scalability Evaluation
Protocol 1: Determining Optimal Droplet Size for Mist-Based Photocatalysis
This protocol is based on the investigation of the energy efficiency of photocatalyst-containing droplets [109].
- Objective: To find the droplet size that minimizes specific energy consumption while maximizing phenol degradation efficiency.
- Materials:
- Photocatalyst suspension (e.g., TiO2 in water).
- Phenol solution as a model pollutant.
- Droplet generator with controllable size output.
- UV or visible light source with controlled intensity.
- HPLC or spectrophotometer for phenol concentration analysis. . Energy meter.
- Methodology: a. Droplet Generation & Reaction: Generate droplets of the photocatalyst-phenol mixture at varying, controlled diameters. Expose these stationary droplets to a fixed light intensity for a set duration. b. Efficiency Analysis: Measure the removal ratio of phenol for each droplet size condition. c. Energy Calculation: Calculate the specific energy consumption (total energy input per mass of phenol degraded) for each droplet size. The model should account for both the energy required to generate the droplets and the irradiation energy. d. Optimization: Plot specific energy consumption and degradation efficiency against droplet diameter. The optimal size is where specific energy consumption is minimized without significantly compromising efficiency.
Protocol 2: Evaluating the Impact of Active Aeration in a Pilot-Scale System
This protocol addresses the common scale-up challenge of oxygen depletion [107].
- Objective: To quantify the role of active aeration in maintaining photocatalytic degradation efficiency in a large-volume reactor.
- Materials:
- Pilot-scale photocatalytic reactor with immobilized catalyst (e.g., TiO2-coated Luffa scaffold).
- Real or synthetic wastewater containing target pollutants (e.g., Naproxen, Amoxicillin).
- Aeration system (air pump, diffusers).
- Dissolved Oxygen (DO) probe and meter.
- Online or periodic analytical equipment (e.g., ORP sensor, LC-MS).
- Methodology: a. Baseline without Aeration: Start the photocatalytic process with light on but aeration off. Monitor the DO concentration and pollutant degradation rate over time. b. Introduction of Aeration: Once DO levels drop and degradation plateaus, activate the aeration system. Continue monitoring DO and pollutant concentration. c. Controlled Comparison: Run parallel experiments: one with continuous aeration from the start, and one without any aeration. d. Data Analysis: Correlate the DO levels with the instantaneous degradation rate. The experiment will demonstrate the critical threshold of DO required for effective photocatalysis and the necessity of active aeration at pilot scale.
Research Reagent Solutions
Table 3: Essential Materials for Photocatalytic Water Remediation Research
| Reagent / Material | Function / Application | Example from Literature |
|---|---|---|
| TiO2 (Evonik P25 Aeroxide) | Benchmark semiconductor photocatalyst; used for degradation of organics and water splitting. | Used as a standard in PNFR wash-coating and composite synthesis [111]. |
| Graphitic Carbon Nitride (g-C3N4) | Metal-free, visible-light-responsive photocatalyst; often combined with other materials. | Evaluated for H₂ production cost and combined with BiOI to form a heterojunction [110]. |
| Halide Perovskites (e.g., FAPbBr3-xIx) | Emerging photocatalyst with high light absorption efficiency; used for hydrogen evolution. | Served as the core photocatalyst in a separated H₂/O₂ production system [113]. |
| Iodide/Triiodide (I⁻/I₃⁻) Redox Couple | Electron shuttle in Z-scheme systems, enabling separation of reduction and oxidation sites. | Acted as a redox mediator between HER and OER cells [113]. |
| Luffa cylindrica Scaffold | Sustainable, natural biomass used as a 3D porous support for immobilizing photocatalysts. | Provided a structured support for TiO2 coating in a pilot-scale IoT system [107]. |
| NiFe-Layered Double Hydroxide (NiFe-LDH) | Cocatalyst for the Oxygen Evolution Reaction (OER); improves water oxidation kinetics. | Modified BiVO4 photoanodes in the OER cell of a water-splitting system [113]. |
Process Visualization
Conclusion
Photocatalysis represents a highly promising advanced oxidation process for sustainable water remediation, demonstrating exceptional capability in degrading persistent organic pollutants, emerging contaminants, and complex industrial wastewater components. The optimization of photocatalytic systems through advanced material design, particularly heterojunction composites and doped semiconductors, significantly enhances visible-light absorption and charge separation efficiency. Reactor engineering innovations, including rotary and continuous-flow systems, address critical scalability challenges. However, overcoming catalyst deactivation, optimizing energy consumption, and ensuring long-term stability remain key hurdles for widespread implementation. Future research should prioritize developing standardized testing protocols, advanced in-situ regeneration strategies, and smart reactor designs that dynamically respond to variable wastewater compositions. The integration of photocatalysis with existing treatment infrastructures and the exploration of solar-driven systems will be crucial for achieving economically viable, sustainable water treatment solutions applicable across industrial and municipal sectors.
References
- 1. A review of photocatalysis, basic principles, processes, and ... [https://www.sciencedirect.com/science/article/pii/S2949839224000981]
- 2. Principles of Photocatalysts and Their Different Applications [https://pmc.ncbi.nlm.nih.gov/articles/PMC10618379/]
- 3. Band gap [https://en.wikipedia.org/wiki/Band_gap]
- 4. Combined theoretical and experimental characterizations ... [https://www.sciencedirect.com/science/article/pii/S1389556718300649]
- 5. Challenges of photocatalysis and their coping strategies [https://www.sciencedirect.com/science/article/pii/S2667109322002160]
- 6. Hidden but Possibly Fatal Misconceptions in ... [https://www.mdpi.com/2073-4344/6/12/192]
- 7. Recent progress in semiconductor/graphene photocatalysts [https://pmc.ncbi.nlm.nih.gov/articles/PMC9769099/]
- 8. Optimization of the photocatalytic wastewater treatment ... [https://www.sciencedirect.com/science/article/abs/pii/S2214714425017593]
- 9. The generation and transformation mechanisms of reactive ... [https://www.sciencedirect.com/science/article/abs/pii/S001393512401497X]
- 10. The photocatalytic degradation of organic pollutants-a ... [https://www.sciencedirect.com/science/article/pii/S2211715625007416]
- 11. FAQs - International Photocatalyst Standard Testing Centre [https://www.iphotocat.com/faqs/]
- 12. Insights into Photocatalytic Degradation Pathways and ... [https://www.mdpi.com/2079-4991/12/23/4111]
- 13. Applying molecular oxygen for organic pollutant degradation [https://pmc.ncbi.nlm.nih.gov/articles/PMC11387708/]
- 14. Nanomaterials ROS: a comprehensive review for ... [https://pubs.rsc.org/en/content/articlehtml/2025/en/d5en00049a]
- 15. Enhanced photocatalytic degradation of organic pollutants ... [https://www.nature.com/articles/s41598-025-22099-8]
- 16. Editorial for Special Issue “Recent Advances in ... [https://www.mdpi.com/2073-4344/15/12/1103]
- 17. Nanocomposites for Water Treatment, Photocatalysis, and ... [https://pmc.ncbi.nlm.nih.gov/articles/PMC12519431/]
- 18. Advances in molecular interfacial engineering of ... [https://pubs.rsc.org/en/content/articlehtml/2025/gc/d5gc01228g]
- 19. Prospects and good experimental practices for ... [https://www.nature.com/articles/s41467-022-35489-7]
- 20. Enhanced Photocatalytic Degradation of Malachite Green ... [https://pmc.ncbi.nlm.nih.gov/articles/PMC10488963/]
- 21. Effect of pH on photocatalytic degradation of methylene ... [https://www.sciencedirect.com/science/article/pii/S2666934X25000236]
- 22. Influence of temperature and reaction time on ... [https://www.sciencedirect.com/science/article/abs/pii/S2468023025011319]
- 23. Effects of pH on the Photocatalytic Activity and Degradation ... [https://www.mdpi.com/2073-4441/16/17/2389]
- 24. Visible-light driven photocatalytic water body purification ... [https://www.sciencedirect.com/science/article/abs/pii/S0301479725027501]
- 25. High-temperature stabilized defect pyrochlore Bi 2−x Fe ... [https://pubs.rsc.org/en/content/articlelanding/2023/cy/d2cy01774a]
- 26. The photocatalytic process in the treatment of polluted water [https://pmc.ncbi.nlm.nih.gov/articles/PMC9527146/]
- 27. A Breakthrough in Photocatalytic Wastewater Treatment [https://pmc.ncbi.nlm.nih.gov/articles/PMC10421126/]
- 28. Photocatalytic degradation of amoxicillin in aqueous ... [https://www.nature.com/articles/s41598-025-17033-x]
- 29. Critical Issues and Guidelines to Improve the Performance ... [https://www.mdpi.com/2073-4344/10/5/570]
- 30. Pharmaceuticals in wastewater and their photocatalytic ... [https://www.sciencedirect.com/science/article/pii/S2214714423003999]
- 31. Photocatalytic Degradation of Pharmaceutical Residues ... [https://pmc.ncbi.nlm.nih.gov/articles/PMC10821327/]
- 32. Editorial: Emerging trends in advanced oxidation ... [https://www.frontiersin.org/journals/environmental-chemistry/articles/10.3389/fenvc.2025.1693281/full]
- 33. Initiating photocatalytic degradation of organic pollutants ... [https://pubs.rsc.org/en/content/articlehtml/2025/sc/d4sc06339b]
- 34. Photocatalytic removal of pharmaceuticals from wastewater ... [https://www.sciencedirect.com/science/article/pii/S2950648424000051]
- 35. Photocatalytic performance of B-gC 3 N 4 /BiOCl ... [https://www.sciencedirect.com/science/article/pii/S2950648425000513]
- 36. Photocatalytic applications of metal oxide-based ... [https://www.sciencedirect.com/science/article/pii/S2949839224001056]
- 37. Interfacially engineered metal oxide nanocomposites for ... [https://pubs.rsc.org/en/content/articlehtml/2025/ra/d4ra08780a]
- 38. Enhanced photocatalytic degradation of chlorpyrifos in ... [https://www.nature.com/articles/s41598-025-29825-2]
- 39. Tutorial review of error evaluation in experimental water ... [https://www.sciencedirect.com/science/article/pii/S0045653524007264]
- 40. A Review on the Use of Metal Oxide-Based ... [https://www.mdpi.com/2305-6304/11/8/658]
- 41. Photodegradation, kinetics and non-linear error functions ... [https://pmc.ncbi.nlm.nih.gov/articles/PMC11734077/]
- 42. Transformative advancements in visible-light-activated ... [https://link.springer.com/article/10.1007/s13762-025-06397-2]
- 43. Harnessing visible light: Advanced photocatalytic ... [https://www.sciencedirect.com/science/article/pii/S1385894725057870]
- 44. Promising TiO 2 -based Photocatalysts under Visible Light [https://www.nature.com/articles/srep04810]
- 45. Visible-light driven p–n heterojunction formed between α- ... [https://pmc.ncbi.nlm.nih.gov/articles/PMC9827591/]
- 46. Visible-Light-Active BiOI/TiO2 Heterojunction Photocatalysts ... [https://pmc.ncbi.nlm.nih.gov/articles/PMC10666155/]
- 47. heterojunction photocatalysts for adsorption and visible ... [https://www.sciencedirect.com/science/article/pii/S092058612400587X]
- 48. Heterogeneous Photocatalysis for Advanced Water ... [https://www.mdpi.com/2076-3417/15/10/5681]
- 49. Advancements in visible light-driven micro/nanomotors for ... [https://pubs.rsc.org/en/content/articlehtml/2024/va/d4va00230j]
- 50. The spinning disc reactor for photocatalytic degradation [https://pmc.ncbi.nlm.nih.gov/articles/PMC11219348/]
- 51. Continuous photocatalytic reactor: Critical review on the ... [https://www.sciencedirect.com/science/article/abs/pii/S2213343722006194]
- 52. Technological Innovations in Photochemistry for Organic ... [https://pmc.ncbi.nlm.nih.gov/articles/PMC8796205/]
- 53. Novel methods of catalytic activation in flow [https://www.sciencedirect.com/science/article/abs/pii/S0360056425000021]
- 54. Solution combustion synthesis: the relevant metrics for ... [https://pubs.rsc.org/en/content/articlehtml/2022/nr/d2nr02714c]
- 55. Solution combustion synthesis, energy and environment [https://www.sciencedirect.com/science/article/abs/pii/S0960897418300020]
- 56. A review on optimizing photocatalytic performance for ... [https://www.sciencedirect.com/science/article/abs/pii/S2214714424021160]
- 57. Synthesis, Characterization, and Photocatalytic Properties ... [https://www.mdpi.com/2227-9717/12/6/1144]
- 58. A Review of Photocatalysts Prepared by Sol-Gel Method ... [https://pmc.ncbi.nlm.nih.gov/articles/PMC2904920/]
- 59. Effect of hydrothermal treatment on structural and ... [https://www.sciencedirect.com/science/article/abs/pii/S0926860X11006284]
- 60. Photocatalytic sol-gel/P25 TiO2 coatings for water treatment [https://www.sciencedirect.com/science/article/pii/S027288422203382X]
- 61. Synthesis, Characterization, and Photocatalytic Activities of ... [https://pmc.ncbi.nlm.nih.gov/articles/PMC8490810/]
- 62. A Comprehensive Overview of Co3O4 Nanoparticles [https://pmc.ncbi.nlm.nih.gov/articles/PMC12196281/]
- 63. Photocatalytic Dye Degradation from Textile Wastewater [https://pmc.ncbi.nlm.nih.gov/articles/PMC11112581/]
- 64. Recent Advances of Photocatalytic Application in Water ... [https://pmc.ncbi.nlm.nih.gov/articles/PMC8308214/]
- 65. Photocatalytic Degradation of Inherent Pharmaceutical ... [https://pmc.ncbi.nlm.nih.gov/articles/PMC9919318/]
- 66. Development of a UV-LED Photoreactor for Colorant ... [https://www.mdpi.com/2073-4352/15/8/688]
- 67. Catalyst deactivation Common causes [https://ammoniaknowhow.com/catalyst-deactivation-common-causes/]
- 68. How to Prevent Catalyst Deactivation? [https://www.samaterials.com/how-to-prevent-catalyst-deactivation.html]
- 69. Deactivation and regeneration of photocatalysts: a review [https://www.sciencedirect.com/science/article/pii/S1944398624135709]
- 70. Catalyst Recovery, Regeneration and Reuse during Large- ... [https://www.mdpi.com/2073-4441/13/19/2623]
- 71. Overcoming the reactivity-stability challenge in water ... [https://www.nature.com/articles/s41467-025-64684-5]
- 72. Electron-Hole Recombination [https://eng.libretexts.org/Bookshelves/Materials_Science/Supplemental_Modules_(Materials_Science)/Electronic_Properties/Electron-Hole_Recombination]
- 73. Kinetics and mechanisms of charge transfer processes in ... [https://www.sciencedirect.com/science/article/pii/S1389556712000457]
- 74. Enhanced photocatalytic water splitting for green hydrogen ... [https://www.sciencedirect.com/science/article/abs/pii/S2468023025000793]
- 75. High-Throughput Screening of 2D Photocatalyst Heterostructures with... [https://arxiv.org/html/2508.17483v1]
- 76. Suppressing Photoinduced Charge via the Lorentz... Recombination [https://pmc.ncbi.nlm.nih.gov/articles/PMC6755512/]
- 77. A significant enhancement of bulk charge separation in ... [https://pmc.ncbi.nlm.nih.gov/articles/PMC9037354/]
- 78. via Optimizing spin control - Chemical... photocatalysis electron [https://pubs.rsc.org/en/content/articlehtml/2025/cs/d4cs00317a]
- 79. Recent prospects, challenges and advancements of ... [https://www.oaepublish.com/articles/wecn.2025.03]
- 80. Solar-driven photocatalytic removal of cefuroxime from water [https://pubs.rsc.org/en/content/articlehtml/2025/ra/d5ra04447b]
- 81. Optimizing sodium percarbonate oxidation for wastewater ... [https://pubs.rsc.org/en/content/articlehtml/2025/ew/d5ew00689a]
- 82. Heterogeneous TiO2 photocatalysis coupled with ... [https://link.springer.com/article/10.1007/s13201-025-02493-3]
- 83. Recent research progress of photoelectrocatalysis ... [https://www.sciencedirect.com/science/article/abs/pii/S2214714425009833]
- 84. Measuring photocatalytic degradation and quantum ... [https://www.sciencedirect.com/science/article/pii/S0009250925018433?dgcid=rss_sd_all]
- 85. Innovative Black TiO 2 Photocatalyst for Effective Water ... [https://www.mdpi.com/2073-4344/14/11/775?]
- 86. Photocatalytic treatment of natural waters. Reality or hype? ... [https://www.sciencedirect.com/science/article/pii/S0043135420310782]
- 87. Application of visible light active photocatalysis for water ... [https://pmc.ncbi.nlm.nih.gov/articles/PMC9828070/]
- 88. Challenges and Future Perspectives in Photocatalysis [https://pmc.ncbi.nlm.nih.gov/articles/PMC11350580/]
- 89. Hybrid adsorption–photocatalysis composites [https://link.springer.com/article/10.1007/s40243-025-00319-5]
- 90. Mechanism and Purification Effect of Photocatalytic ... [https://www.mdpi.com/2073-4441/13/14/1915]
- 91. Photocatalysis coupling with membrane technology for ... [https://www.sciencedirect.com/science/article/pii/S1383586623021330]
- 92. Current Progress in Advanced Functional Membranes for ... [https://pmc.ncbi.nlm.nih.gov/articles/PMC12565979/]
- 93. Comprehensive technologies for heavy metal remediation [https://www.sciencedirect.com/science/article/abs/pii/S0011916425007374]
- 94. Advancements, Challenges, and Future Directions of ... [https://www.sciencedirect.com/science/article/abs/pii/S2468023025019832]
- 95. Comparative experimental evaluation and empirical ... [https://www.nature.com/articles/s41598-025-18131-6]
- 96. The Evolving Landscape of Advanced Oxidation Processes ... [https://www.mdpi.com/2227-9717/13/4/987]
- 97. Kinetic modeling and rate of reactions for the photocatalytic ... [https://www.sciencedirect.com/science/article/pii/S0065237724000486]
- 98. 邓垚成副教授团队在Chemical Engineering Journal发表最新研究 ... [https://hjst.hunau.edu.cn/kxyj_9097/kycg/202506/t20250613_466039.html]
- 99. 01 图文摘要 [http://hjxy.zjsu.edu.cn/View-6173.html]
- 100. Status and challenges of photocatalysis in environmental ... [https://www.sciopen.com/article/10.26599/NR.2025.94907750]
- 101. 俞汉青院士领衔!光催化水处理,最新Nature子刊! [https://www.huasuankeji.com/news/?p=328029]
- 102. Photocatalytic degradation of textile dye utilizing biocl [https://www.nature.com/articles/s41598-025-25451-0]
- 103. FAQs [https://puralytics.com/faqs-shield]
- 104. Catalyst reuse in biomass-based Biodiesel: Life cycle and ... [https://www.sciencedirect.com/science/article/abs/pii/S0961953425004829]
- 105. High-efficiency treatment of oily wastewater by ... [https://www.sciencedirect.com/science/article/pii/S1385894724083396]
- 106. Techno-economic assessment of integrated photochemical ... [https://www.sciencedirect.com/science/article/abs/pii/S221471442300822X]
- 107. A scalable IoT-controlled photocatalytic system for ... [https://www.sciencedirect.com/science/article/abs/pii/S1385894725055457]
- 108. Design, modelling and experimentation of a new large ... [https://www.sciencedirect.com/science/article/abs/pii/S0009250998005077]
- 109. Investigation of the energy efficiency of the process using ... [https://www.sciencedirect.com/science/article/pii/S0263876225001820]
- 110. The development of techno-economic assessment models ... [https://www.sciencedirect.com/science/article/abs/pii/S0196890423000961]
- 111. Novel Pilot-Scale Photocatalytic Nanofiltration Reactor for ... [https://pmc.ncbi.nlm.nih.gov/articles/PMC9966609/]
- 112. Electroanalysis as a method for monitoring photocatalytic ... [https://www.sciencedirect.com/science/article/pii/S2451910324001315]
- 113. A scalable solar-driven photocatalytic system for separated ... [https://www.nature.com/articles/s41467-025-56314-x]