Optimizing Smartphone Cameras for Low-Light Fluorescence Detection: A Guide for Biomedical Research and Point-of-Care Diagnostics
This article provides a comprehensive guide for researchers and drug development professionals on leveraging smartphone cameras for sensitive, quantitative low-light fluorescence detection.
Optimizing Smartphone Cameras for Low-Light Fluorescence Detection: A Guide for Biomedical Research and Point-of-Care Diagnostics
Abstract
This article provides a comprehensive guide for researchers and drug development professionals on leveraging smartphone cameras for sensitive, quantitative low-light fluorescence detection. It covers the foundational principles of smartphone-based detection systems, details methodological setups for applications from biosensing to super-resolution imaging, and offers strategies for troubleshooting and optimization to enhance sensitivity and reduce noise. The content also includes validation protocols and performance comparisons with traditional instrumentation, highlighting the potential of this portable, cost-effective technology to transform point-of-care testing and clinical diagnostics.
Principles and Potential: Understanding Smartphone-Based Fluorescence Detection
Core Components of a Smartphone Fluorescence Detection System
Fluorescence detection is a powerful technique used across life sciences, medical diagnostics, and drug development for its high specificity and sensitivity in identifying target molecules. Traditional fluorescence microscopy and detection systems can be cost-prohibitive, often ranging from several thousand to several hundred thousand US dollars, limiting their accessibility in resource-constrained settings [1]. The emergence of smartphone-based fluorescence detection systems represents a transformative approach, leveraging the sophisticated cameras and processing power of consumer devices to create portable, low-cost alternatives. These systems typically combine a smartphone with custom hardware attachments and software to perform quantitative fluorescence analysis, achieving performance levels suitable for research, educational, and diagnostic applications [2] [3].
For researchers and drug development professionals, optimizing these systems for low-light detection is paramount, as fluorescence signals can be exceptionally faint. This technical support guide details the core components of smartphone fluorescence detection systems and provides practical troubleshooting advice to ensure experimental rigor and reproducibility in low-light conditions.
Core Components and Their Functions
A functional smartphone fluorescence detection system integrates hardware components for optical control and software for image acquisition and analysis.
Hardware Components
The table below summarizes the essential hardware components and their specific functions within the system.
| Component | Function | Examples & Specifications |
|---|---|---|
| Smartphone Camera | Acts as the primary detector. Its sensitivity, sensor size, and pixel quality directly impact detection limits. | CMOS sensors (e.g., Sony IMX179); Capable of 10 µm resolution; Back-illumination sensor technology for improved low-light performance [1] [4] [5]. |
| Excitation Light Source | Provides light at the specific wavelength needed to excite the target fluorophore. | Blue LEDs (~405 nm for PpIX, ~466 nm for FAM); Recreational LED flashlights; Smartphone's built-in flash (dual-tone LED) [1] [3] [5]. |
| Excitation Filter | Placed between the light source and sample to ensure only the desired excitation wavelength illuminates the sample. | Rosco #4990 (CalColor Lavender) for green fluorophores; Rosco #88/#89 (Light/Moss Green) for red fluorophores; Interference filter (466 nm CWL) [1] [5]. |
| Emission Filter | Placed between the sample and camera to block scattered excitation light and transmit only the fluorescence emission. | Rosco #14/#312 (Medium Straw/Canary) for green; Rosco #19 (Fire) for red; Longpass filter (>600 nm for PpIX); Interference filter (525 nm CWL for FAM) [1] [3] [5]. |
| Optical Attachment & Sample Chamber | Holds all components in precise alignment, provides a light-tight environment, and positions the sample. | 3D-printed monolithic enclosures; Frames made of wood and plexiglass; Incorporates reflectors (e.g., diffusive film) to enhance photon collection efficiency [1] [4] [3]. |
| Additional Optics | Lenses to magnify the image or focus light. | Clip-on macro lenses (e.g., 25X magnification); Plano-convex lenses (f=25 mm) for focusing [1] [4]. |
Software and Data Processing
Specialized software is required to control camera settings and process the acquired images or videos.
- Camera Control Apps: Enable manual control over critical camera parameters such as exposure time, ISO sensitivity, and focus. Examples include commercial apps like
FV5andManualor custom-built applications likeCompact Fluorescence Camera (CFCam)[4] [3]. - Data Processing Algorithms: Software routines, often developed in environments like MATLAB or integrated into custom apps, are used to extract quantitative data. A key algorithm for low-light applications is the Noise Reduction by Ensemble Averaging (NREA), which stacks multiple image frames to reduce random noise and significantly improve the signal-to-noise ratio (SNR) [4].
Troubleshooting Guides & FAQs
Frequently Asked Questions (FAQs)
Q1: What are the key advantages of using a smartphone over a traditional fluorescence detector? Smartphones offer a highly integrated, portable, and low-cost platform. They combine a sensitive CMOS camera, powerful processor, user interface, and connectivity in a single device, enabling rapid on-site analysis and data sharing. The economy of scale for smartphones makes this technology more accessible and affordable than traditional, bulky instruments [2].
Q2: My fluorescence signal is too weak. What settings should I adjust on my smartphone camera? For low-light fluorescence detection, you must manually control your camera settings using a dedicated app. The two most critical parameters are:
- Exposure Time: Increase the exposure time (shutter speed) to allow more light to reach the sensor. Start with 1-2 seconds and increase as needed; some apps allow exposures of 30-60 seconds [4].
- ISO Sensitivity: Increase the ISO gain to amplify the sensor's signal. Be cautious, as very high ISO values can introduce significant digital noise. Find a balance between ISO and exposure time that maximizes signal while minimizing noise [3].
Q3: I am seeing a high, uneven background in my images. What could be the cause? High background, or non-specific signal, can have several causes [6] [7]:
- Light Leaks: Ensure your optical attachment is completely light-tight.
- Insufficient Filtering: Verify that your emission filter is effectively blocking the bright excitation light.
- Autofluorescence: The sample itself or its container may autofluoresce. Include a "no dye" control to check for this.
- Non-specific Binding: In staining experiments, use appropriate blocking reagents and validate antibody specificity.
Advanced Troubleshooting Guide
The following table addresses common experimental issues and their solutions.
| Problem | Possible Causes | Solutions & Best Practices |
|---|---|---|
| No Signal | 1. Camera settings incorrect.2. Light source failure.3. Filters blocking all light. | 1. Verify manual mode is on; increase exposure and ISO.2. Check LED power and connections.3. Confirm filter combination is correct for your fluorophore (e.g., GFP vs. RFP) [1] [7]. |
| Weak or Faint Signal | 1. Sub-optimal camera settings.2. Fluorophore concentration too low.3. Insufficient excitation light. | 1. Systematically optimize exposure time and ISO [4] [3].2. Confirm protocol for staining or sample preparation.3. Ensure light source is close and angled correctly (~45°) [1]. |
| High Background Noise | 1. Ambient light leaks.2. Electronic noise from high ISO.3. Sample autofluorescence. | 1. Use a black, opaque attachment and perform analysis in a dark room.2. Use longer exposure with lower ISO if possible.3. Use the NREA algorithm to stack multiple images [4]. |
| Blurry or Out-of-Focus Images | 1. Incorrect working distance.2. Camera autofocus is engaged. | 1. Use a fixed-focus attachment or manually set focus in the app.2. Ensure the app allows for manual focus lock [3]. |
| Signal Fades Over Time | 1. Photobleaching of the fluorophore.2. Sample drying out. | 1. Reduce light intensity or exposure time; use more stable fluorophores [6].2. Ensure the sample chamber is sealed if required. |
Experimental Protocols for Key Applications
Protocol: Detecting Fluorescent Proteins in Zebrafish Embryos
This protocol is adapted from the "glowscope" setup for educational and research use [1].
System Setup:
- Construct a simple frame from plywood or plexiglass with a hole for the smartphone camera.
- Attach a clip-on macro lens (e.g., 25X) over the smartphone's primary camera.
- For green fluorescence (eGFP): Use a blue LED flashlight and place a Rosco #4990 (Lavender) filter over the light source. Place a Rosco #14 (Medium Straw) filter between the sample and the camera as an emission filter.
Sample Preparation:
- Use transgenic zebrafish embryos expressing fluorescent proteins (e.g.,
Tg(myl7:EGFP)for heart tissue). - To immobilize live embryos for heart rate imaging, add Tricaine Methanesulfonate to the egg water.
- Use transgenic zebrafish embryos expressing fluorescent proteins (e.g.,
Image Acquisition:
- Place the smartphone on the frame with the embryo on the stage.
- Position the filtered blue LED light at a 45-degree angle, 3-6 inches from the sample.
- Use a camera app like
ProCam 8to lock the lens and set video acquisition to 1080p resolution at 60 fps. Higher resolutions (4K) may reduce fluorescence sensitivity.
Data Analysis:
- Transfer videos to a computer without compression.
- Import the video into Fiji/ImageJ as an image sequence.
- Use the software's analysis tools to measure fluorescence intensity changes or movement over time.
Protocol: Quantitative PCR (qPCR) Fluorescence Detection
This protocol outlines how a smartphone camera module can be repurposed for a compact qPCR system [5].
System Setup:
- Use a miniature surveillance camera module with a smartphone-grade CMOS sensor (e.g., Sony IMX179).
- Diagonally illuminate the PCR chip with a high-brightness blue LED (9600 mcd).
- Place an excitation filter (466 nm center wavelength) in front of the LED and an emission filter (525 nm center wavelength) in front of the camera module.
Experimental Run:
- Load the PCR chip with the sample and reagents.
- Execute the thermal cycling program (Denaturation, Annealing, Extension) controlled by a microcontroller.
- The camera module captures images of the fluorescence signal at each cycle.
Data Processing:
- Analyze the image sequence to plot fluorescence intensity versus PCR cycle.
- Calculate the threshold cycle (Ct) for quantitative analysis. The performance of this smartphone-based system has been shown to be within 0.41 cycles of a commercial instrument [5].
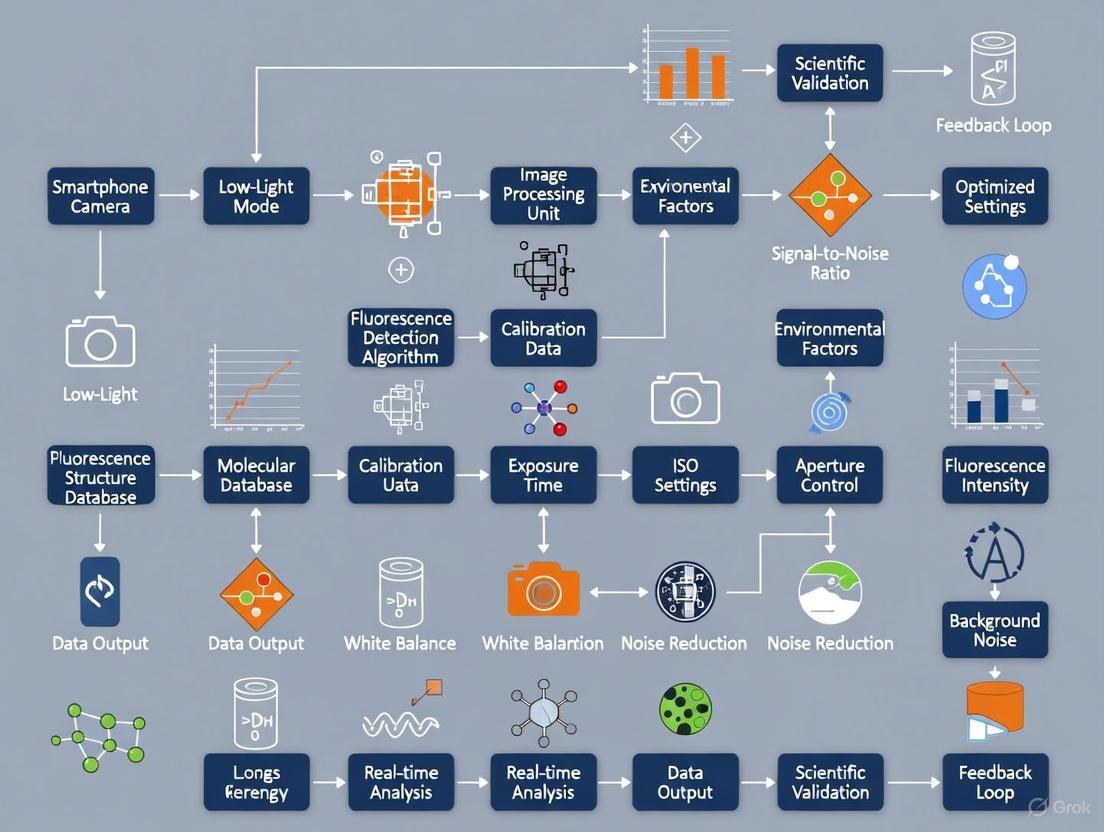
System Workflow and Signaling Pathways
The following diagram illustrates the logical workflow and component relationships for building and operating a smartphone fluorescence detection system.
The Scientist's Toolkit: Research Reagent Solutions
The table below lists key reagents and materials commonly used in fluorescence experiments compatible with smartphone detection.
| Reagent/Material | Function/Best Practices |
|---|---|
| Fluorescent Proteins (e.g., EGFP, DsRed, mCherry) | Genetically encoded tags for visualizing gene expression and protein localization in live cells or organisms like zebrafish [1]. |
| Chemical Fluorophores (e.g., FAM, PpIX) | Synthetic dyes used for labeling antibodies, in-situ hybridization, or as endogenous markers (e.g., Protoporphyrin-IX in dermatology) [3] [5]. |
| Tricaine (MS-222) | A reversible anesthetic used to immobilize live aquatic organisms like zebrafish embryos for clear imaging without sacrificing them [1]. |
| Antibodies for Immunofluorescence | Primary and secondary antibodies conjugated to fluorophores for specific target detection. Always include controls (no primary antibody) to check for non-specific binding [6] [7]. |
| Mounting Media | Preserves fluorescence signal and sample integrity. Use an anti-fade mounting medium to reduce photobleaching during prolonged imaging [7]. |
| Optical Filters (Theater Lighting Gels) | A low-cost alternative to glass filters. Rosco gels (e.g., #4990, #14, #88) can be cut to size and used as effective excitation/emission filters [1]. |
This technical support center is designed for researchers leveraging smartphone cameras for low-light fluorescence detection. The miniaturization of powerful sensors and the integration of sophisticated computational pipelines have positioned smartphones as a transformative platform for point-of-care diagnostics and field-deployable research tools. This guide provides targeted troubleshooting and FAQs to help you overcome common challenges in optimizing these devices for high-sensitivity applications.
Fundamental Operating Principles
Q1: What core smartphone components enable low-light fluorescence detection?
The smartphone's complementary metal-oxide-semiconductor (CMOS) image sensor is the primary detector. Its performance is critical for low-light applications. Modern sensors feature advancements like Backside-Illumination (BSI) and Stacked CMOS architectures, which increase photon collection efficiency and reduce noise [8]. The smartphone's central processing unit (CPU) and graphical user interface (GUI) enable on-device data processing, analysis, and visualization, facilitating rapid decision-making at the point of need [2] [9].
Q2: How does smartphone-based detection quantitatively compare to traditional laboratory equipment?
While research-grade microscopes and plate readers may offer superior specifications, smartphone-based systems provide a compelling balance of performance, cost, and portability for many applications. The table below summarizes a key performance comparison from a recent study.
Table 1: Performance Benchmark of a Smartphone-Based Microscope
| Parameter | Smartphone-Based Microscope | Traditional Laboratory Equipment |
|---|---|---|
| Single-Molecule Detection | Directly demonstrated [10] | Standard capability |
| Super-Resolution Imaging | Achieved (84 nm localization precision) [10] | Standard capability |
| Setup Cost | < €350 [10] | Often >€10,000 |
| Portability | 1.2 kg, 11 x 22 x 12 cm [10] | Bulky, benchtop |
| Key Application Example | Detection of Ebola RNA fragments [10] | Various |
Troubleshooting Guides & FAQs
Optimizing Signal-to-Noise Ratio (SNR)
Q3: My fluorescence images are too noisy. What steps can I take to improve the SNR?
A low SNR is a common challenge. We recommend a multi-faceted approach:
- Maximize Signal Collection:
- Use TIRF or HILO Illumination: Implement Total Internal Reflection Fluorescence (TIRF) or Highly Inclined and Laminated Optical (HILO) sheet illumination. This technique drastically reduces background signal by exciting only a thin layer of the sample near the substrate, which is particularly beneficial for single-molecule imaging [10].
- Ensure Proper Filtering: Use high-quality, spectrally matched emission filters to block scattered laser light. Ensure the filter is correctly seated in its slot [10].
- Employ Computational Enhancement:
- Leverage Computational Photography: Utilize the smartphone's built-in capabilities. Techniques like image stacking (capturing and merging multiple frames) can significantly improve SNR by averaging out random noise [11]. Some smartphone "Night Mode" functions use this principle.
- Access RAW Image Data: Where possible, use apps that allow access to unprocessed RAW image data from the sensor. This bypasses the phone's built-in noise reduction and compression algorithms, which can sometimes discard scientifically valuable data [12].
- Consider Ratiometric Fluorescence (RF): For quantitative sensing, develop or use assays based on ratiometric fluorescence. This method uses the ratio of intensities at two different wavelengths, which self-corrects for variations in probe concentration, excitation light intensity, and other environmental factors, leading to more reliable and sensitive detection [13].
Q4: How can I achieve uniform and stable illumination with my smartphone setup?
Stable illumination is non-negotiable for quantitative measurements.
- Use a Laser Source: For fluorescence excitation, lasers are preferred over LEDs due to their higher radiance and spectral purity, which are crucial for sensitive detection [10].
- Ensure Stable Power: Power your laser with a stable source, such as a regulated battery or power supply, to prevent intensity fluctuations.
- Check Mechanical Stability: Vibrations from cooling fans can degrade image quality, especially in super-resolution applications. For high-precision work, turn off optional fans or use passive heatsinks [10].
Experimental Protocol and Workflow
The following diagram and protocol detail a representative experiment for single-molecule detection using a smartphone microscope.
Diagram 1: Single-Molecule Detection Workflow. This outlines the key steps from sample preparation to data analysis for a smartphone-based fluorescence microscopy experiment.
Table 2: Detailed Protocol for Single-Molecule Detection [10]
| Step | Procedure | Purpose & Technical Notes |
|---|---|---|
| 1. Sample Prep | Immobilize fluorescently labeled DNA origami or other samples on a quartz substrate. | Provides a known nanoscale structure for validating microscope performance. Six biotins on the structure enable surface binding. |
| 2. Optical Setup | Apply immersion oil between the prism holder and sample substrate. Align the laser stage for TIRF illumination. | Matches refractive indices to achieve TIRF, which minimizes background by exciting only a thin evanescent field. |
| 3. Smartphone Integration | Place the smartphone using slip-resistant silicone supports. Insert the appropriate emission filter into the objective stage. | The modular design accommodates different smartphones. The lateral filter slot allows for easy exchange. |
| 4. Data Acquisition | Focus on the sample plane using the objective stage's alignment screws. Record a time-series of images (e.g., 100 ms exposure). | Enables observation of single-molecule photobleaching events, which appear as single-step intensity drops. |
| 5. Data Analysis | Transfer images for processing. Use Single-Molecule Localization Microscopy (SMLM) algorithms. | Achieves super-resolution. The referenced study reported a localization precision of 84 nm, enabling a 6.6-fold resolution enhancement. |
Connectivity and Data Management
Q5: What are the best practices for managing and analyzing the image data generated?
Smartphones excel at integrating data acquisition with analysis and communication.
- On-Device Analysis: For rapid feedback, develop custom smartphone applications that can perform initial image analysis, such as particle counting or intensity quantification, directly on the device [14].
- Cloud-Based Processing: For computationally intensive tasks like SMLM or deep learning-based analysis, transfer data to a cloud server. The smartphone's inherent connectivity (Wi-Fi, cellular) makes this seamless. This approach is central to the "mobile health (mHealth)" platform paradigm [14].
- Leverage Machine Learning: Machine learning and artificial intelligence algorithms are increasingly used to analyze complex biological images from smartphone-based platforms, improving classification accuracy and feature detection [14] [2].
The Scientist's Toolkit
Table 3: Research Reagent Solutions for Smartphone-Based Fluorescence Detection
| Item | Function in the Experiment |
|---|---|
| DNA Origami Structures | Nanoscale scaffolds (e.g., 60x52 nm 2-layer sheets) used as fiducial markers to validate microscope resolution and performance [10]. |
| ATTO 542 / ATTO 647N Dyes | Bright, photostable fluorescent dyes used as single-molecule reporters. Their photobleaching characteristics are used to confirm single-molecule detection [10]. |
| Emission Filters | Optical filters that block the excitation laser light while transmitting the longer-wavelength fluorescence emission, crucial for achieving a high signal-to-noise ratio [10]. |
| Quartz Substrate | A sample substrate with high optical clarity and low autofluorescence, ideal for sensitive single-molecule measurements. |
| Microfluidic Chips | Lab-on-a-chip devices that automate and miniaturize sample handling, enabling high-throughput and reproducible assays integrated with smartphone detection [13] [14]. |
| Ratiometric Fluorescence Probes | Probes that exhibit a shift in emission intensity at two wavelengths upon binding the target. This self-calibrating property improves measurement accuracy and sensitivity [13]. |
Core Concepts: CMOS Technology and Noise
What is a CMOS image sensor and how does it work?
A Complementary Metal-Oxide-Semiconductor (CMOS) image sensor is a type of digital device that captures light and converts it into electrical signals to form an image [15] [16]. Its core components are millions of tiny photodiodes, or pixels, arranged in a 2D array [15]. Each pixel generates an electrical charge proportional to the amount of light it receives [16]. A key differentiator from older CCD technology is that CMOS sensors have individual amplifiers and readout circuits for each pixel (or column of pixels), allowing for faster processing and lower power consumption [17].
What are the main sources of noise in CMOS sensors, particularly for low-light applications?
In low-light fluorescence detection, understanding and mitigating noise is critical. The primary noise sources are:
- Photon Shot Noise: Inherent, unavoidable noise arising from the quantum nature of light itself [18].
- Read Noise: Introduced during the process of converting the accumulated charge into a measurable voltage and reading it out [18] [16].
- Dark Current Noise: Caused by the thermal generation of electrons within the pixel in the absence of light. This increases with exposure time and sensor temperature [16].
- Fixed-Pattern Noise (FPN): A pattern of pixel-to-pixel variability caused by minor differences in the responsivity and base offset of each pixel on the sensor [18].
How do CMOS sensors compare to CCDs for quantitative low-light imaging?
CMOS sensors, especially scientific-grade (sCMOS), have become the preferred choice for most applications. The table below summarizes the key differences:
Table: CCD vs. CMOS Sensor Comparison for Scientific Imaging
| Feature | CCD (Charge-Coupled Device) | CMOS (Complementary Metal-Oxide-Semiconductor) |
|---|---|---|
| Image Quality | Traditionally superior with less noise [15]. | Now comparable or superior; modern sCMOS offers high quality with minimal noise [17] [18]. |
| Power Consumption | High [15]. | Low, ideal for portable or battery-powered devices [15] [17]. |
| Speed & Frame Rate | Lower speed and frame rates [15]. | High speed and frame rates due to parallel readout [15] [16]. |
| Cost | More expensive to produce [15]. | Cost-effective due to standard semiconductor manufacturing [15]. |
| Low-Light Performance | Excellent, historically the best choice [15]. | sCMOS sensors now approach EMCCD performance with much higher resolution and speed [19] [18]. |
Smartphone Camera Hardware for Low-Light Detection
What key specifications should I look for in a smartphone CMOS sensor for low-light detection?
When selecting a smartphone for research, prioritize sensors with specifications engineered for low-light sensitivity. Key metrics are summarized in the table below.
Table: Key Smartphone CMOS Sensor Specifications for Low-Light Fluorescence
| Specification | Importance for Low-Light Detection | Example from Recent Sensors |
|---|---|---|
| Sensor Size | A larger sensor has larger photosites (pixels) that collect more light, directly improving low-light performance [20]. | Sony LYT-828 uses a 1/1.28-type (12.49 mm diagonal) sensor [21]. |
| Pixel Size | Larger individual pixels (e.g., 1.22µm) can capture more photons, reducing noise [21]. | Samsung ISOCELL technology creates tiny pixels (down to 0.56µm) but uses binning to simulate larger pixels in low light [17]. |
| Dynamic Range | The ratio of brightest to darkest detectable signals. A wide dynamic range (>100 dB) prevents blowouts in bright areas and loss of detail in shadows [21]. | Sony LYT-828 boasts >100 dB dynamic range using Hybrid Frame-HDR technology [21]. |
| HDR Technology | Combines multiple exposures into one image to preserve details in high-contrast scenes. Essential for bioluminescence against a dark background [21]. | "HF-HDR" fuses single-frame and multi-frame HDR for superior results, even while zooming [21]. |
| Random Noise Suppression | Specialized circuit designs are crucial for minimizing graininess in dark images [21]. | "Ultra-High Conversion Gain (UHCG)" circuit technology in the LYT-828 efficiently converts charge to voltage, drastically cutting random noise [21]. |
How can I leverage a smartphone's inherent capabilities for my research?
Smartphones are ideal for portable scientific instrumentation because they integrate high-resolution CMOS sensors, significant computing power, and network connectivity into a single, low-cost device [22]. You can utilize the smartphone's processing capabilities to run real-time noise-reduction algorithms [22] and control camera parameters like exposure time programmatically to maximize signal capture in low-light conditions [22].
Experimental Protocol: Smartphone-Based Low-Light Bioluminescence Detection
This protocol is adapted from a published study that successfully detected low-light bioluminescence from bacterial reporters using unmodified smartphones [22].
Aim: To quantitatively detect bioluminescent signals from a bacterial reporter (Pseudomonas fluorescens M3A) using a smartphone-based imaging platform.
Methodology:
Hardware Setup (BAQS Platform):
- Construct a light-tight cradle to house the smartphone and sample tube.
- Position a collection lens between the sample tube and the smartphone's camera to enhance photon capture efficiency.
- For optimal performance, line the sample chamber with a diffusive reflection polymer film, which was shown to enhance signal capture up to three-fold compared to opaque materials [22].
Software and Imaging:
- Utilize an app or custom code that allows manual control over the camera settings, specifically enabling a long exposure time (e.g., up to 180 seconds) [22].
- Capture a sequence of images (e.g., 5 or more) of the bioluminescent sample in complete darkness.
Image Processing and Noise Reduction:
- Process the image stack using a noise-reduction algorithm. The cited study used the "Noise Reduction by Ensemble Averaging (NREA)" algorithm.
- Unlike simple image averaging, which amplifies both signal and noise, the NREA algorithm effectively reduces random noise while preserving the desired signal, significantly improving the Signal-to-Noise Ratio (SNR) [22].
Quantification:
- Analyze the processed image, measuring the intensity of the bioluminescent signal in the region of interest.
- Relate the pixel intensity to the radiant flux or colony-forming units (CFU) based on a pre-established calibration curve. The referenced setup achieved detection of luminescence from ~10^6 CFU/mL [22].
The workflow for this experiment is outlined below.
Troubleshooting & FAQ
My images are too noisy for reliable quantification. What can I do?
- Increase Exposure Time: This is the most direct way to collect more signal photons. The longer the integration, the better the signal-to-noise ratio, provided the dark current is managed [22].
- Use Computational Denoising: Apply advanced post-processing algorithms like the ACsN (Automatic Correction of sCMOS-related Noise) or the NREA method mentioned in the protocol. These are designed to suppress camera-related noise while preserving image details [22] [18].
- Control Temperature: If possible, cool the sensor. Dark current noise doubles with every 6-8°C increase in sensor temperature. While difficult in a smartphone, avoiding device heating is beneficial [16].
- Leverage Pixel Binning: Some sensors allow binning adjacent pixels, combining their charges to act as a single, larger pixel. This increases sensitivity and reduces noise at the cost of spatial resolution [23].
How can I improve the dynamic range of my smartphone camera for high-contrast samples? Enable the smartphone's HDR (High Dynamic Range) mode if available for video or manual control. Modern sensor HDR technologies, like Sony's "Hybrid Frame-HDR," work by capturing and combining short and long exposure frames, either on-sensor or on the application processor, to preserve details in both bright and dark areas of a scene [21].
I see distortion when imaging moving samples. What is causing this? This is likely the rolling shutter effect common to many CMOS sensors. The sensor scans the scene from top to bottom rather than capturing it all at once. For fast-moving objects, this can cause skewing. A global shutter, which exposes all pixels simultaneously, is ideal but rare in smartphones. To mitigate this, use the shortest possible exposure time that still collects sufficient light to "freeze" the motion [16].
My low-light images lack detail and sharpness even after denoising. Is there a hardware solution? The core limitation is often the amount of light collected. Ensure you are using the highest quality, cleanest optics in your setup. Furthermore, a sensor with larger pixels (or one that uses pixel binning technology, like Samsung's Tetrapixel or Nonapixel) will inherently perform better in low light by gathering more photons [17].
The Scientist's Toolkit: Essential Research Reagents & Materials
Table: Key Materials for Smartphone-Based Low-Light Detection Experiments
| Item | Function / Application |
|---|---|
| Bioluminescent Reporter Strains | Genetically modified bacteria (e.g., Pseudomonas fluorescens M3A) that emit photons in response to specific analytes; the core biological sensing element [22]. |
| 3D-Printed Cradle & Chamber | Provides a light-tight, standardized environment that holds the smartphone and sample in a fixed, optimal configuration for reproducible imaging [22]. |
| Diffusive Reflection Film | A polymer film used to line the sample chamber. It scatters radially emitted photons, enhancing the efficiency of light collection by the camera by up to three-fold [22]. |
| Neutral Density (ND) Filter Sets | Calibrated filters used to attenuate light by known amounts. Essential for establishing a calibration curve and determining the detection limits of the setup [22]. |
| Signal Calibration Light Source | A stable, low-intensity light source (e.g., a green LED) used to calibrate the imaging system and verify its performance before using biological samples [22]. |
Frequently Asked Questions (FAQs)
In low-light fluorescence imaging with smartphone cameras, noise originates from several key physical and electronic processes. The three primary components are photon shot noise, read noise, and dark noise [24]. Photon shot noise is fundamental, arising from the random statistical variation in the arrival rate of photons incident on the sensor and is equal to the square root of the signal [24]. Read noise is a combination of system noise components introduced during the conversion of charge into a voltage and subsequent analog-to-digital processing [24]. Dark noise, or dark current noise, comes from the thermal generation of electrons within the image sensor, which is highly dependent on temperature [24]. For sCMOS sensors (the technology in many smartphone cameras), an additional significant noise source is fixed-pattern noise (FPN), where different pixels have different responsivities and offsets, making them appear to flicker even in the absence of light [18].
How can I maximize the Signal-to-Noise Ratio (SNR) with my smartphone camera?
Maximizing SNR involves strategies to increase your signal while minimizing the various noise components. The general SNR equation for an imaging system is [24]: SNR = (P × Qe × t) / √[ (P × Qe × t) + (D × t) + Nr² ] Where P is incident photon flux, Qe is quantum efficiency, t is integration time, D is dark current, and Nr is read noise. Based on this:
- Increase Signal: Use longer exposure times (
t) and ensure your sample is brightly and evenly illuminated. A higher quantum efficiency (Qe) sensor will also capture more signal [24] [25]. - Reduce Noise: Cooling the sensor dramatically reduces dark current (
D). While not always feasible in smartphones, this is a key technique in scientific cameras [24]. Using cameras with lower read noise (Nr) specifications is also beneficial. Furthermore, for sCMOS sensors, applying a calibration to correct for fixed-pattern noise is critical for clean quantitative data [18].
My fluorescence images have a high, uneven background. What could be the cause?
A high, uneven background is often caused by one or a combination of the following issues:
- Sample Autofluorescence: The sample itself may fluoresce. This is common in tissues and some cell types. Autofluorescence is typically highest in blue wavelengths, so using far-red or near-infrared dyes can help mitigate it [26].
- Non-Specific Antibody Binding: If using immunofluorescence, your primary or secondary antibody may be binding to sites other than your target. Titrating your antibody concentration and using highly cross-adsorbed secondary antibodies can reduce this [26].
- Insufficient Washing: Residual unbound dye or antibody in the sample can create a high background. Ensure you are using a generous volume of wash buffer with adequate rocking [26].
- Camera Fixed-Pattern Noise: As mentioned, this can create a static, uneven pattern in your images that is misinterpreted as background [18].
Troubleshooting Guides
Problem: No Staining or Very Low Signal
Potential Causes and Solutions:
| Cause | Diagnostic Steps | Solution |
|---|---|---|
| Low Antibody Concentration or Activity | Check antibody validation for your application. Perform a titration. | Increase antibody concentration or use a fresh, validated aliquot. |
| Inaccessible Intracellular Target | Confirm if the target is intracellular or on the cell surface. Check the antibody epitope location. | Use permeabilization buffers for intracellular targets. |
| Suboptimal Camera Settings | Use a histogram to check if the signal is saturated or too low. | Systematically increase exposure time before increasing light intensity to avoid photobleaching [25]. |
| Rapid Photobleaching | Check if signal fades quickly during imaging. | Use an antifade mounting medium and choose photostable dyes (e.g., rhodamine-based) [26]. |
Problem: High Background or Speckled Noise
Potential Causes and Solutions:
| Cause | Diagnostic Steps | Solution |
|---|---|---|
| Sample Autofluorescence | Include an unstained control to determine autofluorescence level. | Use autofluorescence quenchers. Avoid blue fluorescent dyes for low-expression targets [26]. |
| Secondary Antibody Cross-Reactivity | Perform a control with secondary antibody alone. | Use highly cross-adsorbed secondary antibodies and block with IgG-free BSA or fish gelatin [26]. |
| High Read Noise / Fixed-Pattern Noise | Take a "dark" image with the shutter closed to visualize camera-specific noise. | Use a content-adaptive algorithm (like ACsN) that combines camera physics and sparse filtering to correct sCMOS-related noise [18]. |
| Antibody Concentration Too High | Check if both specific signal and background are high. | Perform an antibody titration to find the optimal concentration [26]. |
Experimental Protocols
Protocol 1: Camera Characterization and Fixed-Pattern Noise Correction
Purpose: To characterize the inherent noise of your smartphone camera system and create calibration maps for high-quality quantitative imaging [18].
- Offset (Bias) Map: Capture a series of short-exposure images (e.g., 100 frames) with the camera in complete darkness (lens cap on). The average of these frames yields a map of the pixel-to-pixel offset variation (
βp). - Gain Map: Capture images of a uniformly illuminated field at different known brightness levels. The pixel-to-pixel variation in response to this uniform signal provides the gain map (
γp). - Application: These maps can be used to correct subsequent experimental images using the model:
Corrected Signal = (Measured Signal - βp) / γp[18].
Protocol 2: Optimizing Acquisition Parameters for Low-Light Fluorescence
Purpose: To establish a methodology for finding the best camera settings that maximize SNR while minimizing phototoxicity and photobleaching [25].
- Initial Setup: Focus on your sample and locate your target. Close the fluorescence shutter when not capturing images.
- Set Camera for Acquisition: Start with the gentlest (lowest) excitation light intensity possible.
- Adjust Exposure Time: Systematically lengthen the exposure time until the signal is clearly distinguishable from the background noise.
- Check Histogram: Continuously monitor the image histogram to ensure no pixel values are saturated (pushed to the maximum value). A clipped histogram means lost data.
- Iterate if Necessary: If the required exposure time is impractically long, slightly increase the excitation light intensity and repeat from step 3. The goal is to find a balance between light intensity and exposure time that is appropriate for your sample's health and the phenomenon you are capturing [25].
Research Reagent Solutions
| Item | Function/Benefit |
|---|---|
| Photostable Dyes (e.g., Rhodamine-based) | Resist photobleaching during prolonged exposure to excitation light, crucial for time-lapse imaging [26]. |
| Antifade Mounting Medium | Slows the photobleaching process, preserving fluorescence signal over time [26]. |
| TrueBlack Lipofuscin Autofluorescence Quencher | Specifically reduces tissue autofluorescence, a major source of background in many samples [26]. |
| IgG-Free BSA or Fish Gelatin | Used in blocking buffers to prevent cross-reactivity of secondary antibodies, reducing non-specific background [26]. |
| Highly Cross-Adsorbed Secondary Antibodies | Minimizes off-target binding in multicolor staining experiments, ensuring signal specificity [26]. |
Signal and Noise Relationships in Imaging Systems
Workflow for Low-Light Image Optimization
Building Your System: Hardware, Software, and Assay Integration
Designing and 3D-Printing a Light-Tight Attachment
Troubleshooting Guides
Guide 1: Resolving Light Leaks in 3D-Printed Enclosures
| Problem | Possible Cause | Solution |
|---|---|---|
| Visible light leaks at part seams | Insufficient wall thickness; Poor fit between components | Increase shell/perimeter count in slicer (≥4 layers). Design press-fit tolerances of 0.2 mm - 0.5 mm for a snug, light-blocking fit [3]. |
| Light leaks at filter interfaces | Gap between filter and 3D-printed housing | Design a filter groove or recess. Use a compliant gasket material (e.g., black foam tape) to create a seal between the filter and the printed part [3]. |
| Light piping through resin | Semi-transparency of cured 3D printing resin | Post-process printed parts by painting all exterior surfaces with a opaque, matte black paint to prevent internal light reflection and transmission [3]. |
| Poor print quality causing pinholes | Sub-optimal 3D printing parameters | For LCD MSLA printing: Use layer heights of 0.05-0.10 mm and calibrate exposure times (e.g., 2-15 seconds) for complete curing without light bleed [27]. |
Guide 2: Optimizing Smartphone Camera Settings for Low-Light Fluorescence
| Problem | Smartphone Setting | Recommended Configuration & Rationale |
|---|---|---|
| Low signal, noisy image | Exposure Time / Shutter Speed | Maximize exposure time (e.g., 15-60 seconds) using a manual camera app. This integrates more photons, boosting signal [4]. |
| Washed-out signal, background noise | ISO / Gain | Use a low-to-moderate ISO setting (e.g., 100-800). High ISO amplifies signal but also noise; find the optimal balance for your setup [3]. |
| Inconsistent focus | Focus | Manually lock focus to the sample plane. Autofocus can hunt in low light, blurring the image [3]. |
| File format limitations | Image/Video Format | Utilize 10-bit video capability if available for higher dynamic range, capturing more intensity levels for accurate quantification [3]. |
Frequently Asked Questions (FAQs)
Q1: What is the best 3D printing technology for a light-tight attachment? Stereolithography (SLA) is often the best choice. It produces parts with high dimensional accuracy, smooth surface finishes, and excellent feature resolution, which are crucial for creating tight-fitting, light-blocking joints and complex internal channels [28]. Fused Deposition Modeling (FDM) can be used but may require more post-processing to seal layer lines that can leak light.
Q2: How can I prevent my snap-fit joints from breaking during repeated use? To ensure durability, design the cantilever arm with an appropriate thickness and length. A common rule is to keep the strain during deflection below the material's yield strain. For many 3D printing resins and plastics, designing for a strain below 2-3% is advisable. Orient the print so the layer lines are perpendicular to the direction of bending stress to maximize strength [28].
Q3: My fluorescence signal is weak. How can I improve it without a more powerful light source? You can improve signal collection by:
- Increasing integration time: Use the smartphone's manual controls to set a longer exposure time (e.g., 15-60 seconds) [4].
- Using a lens: Incorporate a simple plano-convex lens (e.g., f=25mm) between the sample and camera, which can boost collected light by up to 17 times [4].
- Internal reflectors: Line the attachment with a diffusive reflective film (e.g., white polymer) to enhance photon capture efficiency from the sample [4].
Q4: What post-processing steps are critical for a functional attachment? Proper post-processing is essential:
- Washing and Curing: Thoroughly wash prints in isopropyl alcohol to remove uncured resin, then post-cure under UV light according to resin specifications for optimal mechanical properties [27] [3].
- Painting: As cured resin can be slightly translucent, painting the entire exterior of the attachment with matte black paint is crucial for blocking ambient light [3].
- Support Removal: Carefully remove support structures and sand contact surfaces to ensure a flush fit between components.
Q5: How do I align the smartphone's flash and camera with the attachment's optics? The attachment should be designed to clip firmly onto the phone's body. Use the phone's native flash as the excitation source. For the iPhone 12 Pro Max, the ultra-wide camera's proximity to the flash makes it ideal. Design an internal light guide or chamber that angles the flash's light toward the sample while keeping the excitation and emission paths separated by filters [3].
Experimental Protocols & Data
Protocol: Validating Attachment Light-Tightness and Performance
Objective: To quantitatively verify that the 3D-printed attachment is fully light-tight and to characterize its fluorescence detection limit.
Materials:
- Assembled and painted 3D-printed attachment.
- Smartphone with manual camera control app.
- Target fluorophore (e.g., Rhodamine 6G, Protoporphyrin-IX (PpIX)).
- Serial dilutions of the fluorophore in a suitable solvent.
- A power meter or spectrometer (optional, for light source characterization).
Methodology:
- Light-Tightness Test: In a darkroom, place the attachment on the smartphone and cover the sample port. Capture a long-exposure image (e.g., 60 seconds) with the flash on. The resulting image should show no detectable signal above the camera's dark noise level.
- Sensitivity and Limit of Detection (LOD):
- Prepare serial dilutions of the fluorophore (e.g., PpIX from 10 nM to 1000 nM).
- Place each sample in the attachment and capture an image using standardized smartphone settings (e.g., 15s exposure, ISO 400).
- Use an image analysis algorithm (like NREA - Noise Reduction by Ensemble Averaging) to process the images and calculate the average signal intensity in a Region of Interest (ROI) [4].
- Plot the mean intensity against concentration. The LOD can be determined as the concentration yielding a signal three standard deviations above the background.
Expected Outcomes: A well-designed system, as reported in the literature, can achieve a light-tight seal and detect PpIX at concentrations below 10 nM, with a linear response from 10-1000 nM (R² > 0.99) [3].
Quantitative Data from Literature
Table 1: Performance of Different Smartphone Models in Low-Light Detection
| Smartphone Model | Low-Light Performance (Detected Luminescence) | Key Finding |
|---|---|---|
| OnePlus One (Android) | ~10⁶ CFU/mL of P. fluorescens (~10⁷ photons/s) | Best performance with 180s integration time [4]. |
| iPhone 5 S (iOS) | Comparable to OnePlus One at ~10⁷ photons/s | Achieved similar detection limits with long exposure [4]. |
| LG G2 (Android) | Good performance in standardized test | Performance was dramatically increased with the addition of a collection lens [4]. |
Table 2: Key 3D Printing Parameters for Optical Components
| Printing Parameter | Recommended Setting | Impact on Print Quality |
|---|---|---|
| Layer Height | 0.05 mm | Finer resolution for smoother surfaces and better-fitting parts [3]. |
| Bottom Layer Exposure | 30 seconds | Ensures strong adhesion to the build platform [3]. |
| Standard Layer Exposure | 3 seconds | Sufficient to fully cure each layer without excessive light bleed [3]. |
| Material | eSUN Black Standard Resin | Common, low-cost resin suitable for creating the initial structure [3]. |
The Scientist's Toolkit: Research Reagent Solutions
Table 3: Essential Materials for Fabricating a Smartphone Fluorescence Attachment
| Item | Function | Example/Specification |
|---|---|---|
| LCD MSLA 3D Printer | Fabricates high-resolution, custom attachment housings. | Phrozen Sonic Mini; 50-micron axial resolution [3]. |
| Black Photopolymer Resin | Base material for the light-tight enclosure. | eSUN Black Standard Resin [3]. |
| Longpass Optical Filter | Blocks reflected excitation light; transmits only fluorescence emission. | >600 nm filter for PpIX imaging [3]. |
| Matte Black Paint | Applied to exterior of print to block light piping and ambient light [3]. | --- |
| Plano-Convex Lens | Increases light collection efficiency from the sample. | f = 25 mm, diameter = 10 mm [4]. |
| Diffusive Reflective Film | Lines the sample chamber to enhance photon capture. | White polymer film [4]. |
Visualization Diagrams
Within the broader objective of optimizing smartphone cameras for low-light fluorescence detection in research, selecting the correct excitation sources and optical filters is a critical determinant of success. This guide provides detailed, experiment-focused protocols and troubleshooting advice to help researchers configure these core components effectively, overcoming the inherent limitations of smartphone-based systems to achieve high-sensitivity, quantitative results.
FAQs: Core Concepts and Configuration
What are the essential components for a smartphone-based fluorescence detector?
A basic setup requires an excitation source, optical filters, and the smartphone camera. The excitation source (LED or laser) illuminates the sample, causing the fluorophore to emit light. Optical filters are then used to separate this typically dim emission light from the much brighter excitation light, allowing the smartphone camera to detect the specific fluorescence signal [3] [29] [30].
The excitation source must have a wavelength that matches the absorption peak of your target fluorophore. The table below summarizes common sources used in smartphone-based setups.
| Source Type | Common Wavelengths | Key Features | Best For |
|---|---|---|---|
| UV LED | ~400 nm [29] | Low-cost, low-power consumption | Exciting blue-emitting fluorophores like carbon nanodots [29] |
| Blue LED | ~460 nm [30] | Readily available, can use smartphone flash [3] | Fluorophores like 2,3-diaminophenazine (DAP) [30] |
| Laser Module | e.g., 640 nm [10] | High radiance, spectrally narrow, enables TIRF | High-sensitivity applications like single-molecule detection [10] |
Why are optical filters necessary, and how do I select them?
Without filters, scattered excitation light will overwhelm the camera sensor, making the weaker fluorescence emission impossible to detect. You need two primary filters:
- Emission Filter (EF): Placed between the sample and the camera, this is a longpass (LP) or bandpass (BP) filter that blocks the excitation wavelength but transmits the longer-wavelength fluorescence light [10] [3].
- Exciter Filter (Optional but recommended): Placed in front of the light source, it ensures the excitation light is spectrally pure.
The choice depends on your fluorophore. The following table provides guidance based on demonstrated experimental setups.
| Filter Type | Function | Example Use Case |
|---|---|---|
| Longpass Filter | Blocks wavelengths below a cutoff point, transmits longer wavelengths. | A >600 nm LP filter for detecting PpIX fluorescence excited by a 405 nm LED [3]. |
| Bandpass Filter | Transmits a specific band of wavelengths, blocking others. | Used in front of a smartphone camera to isolate the specific emission of a fluorophore [13]. |
| DIY Color Filters | Uses colored transparent acrylic as a low-cost alternative [29]. | Orange/yellow acrylic used to filter light for carbon nanodot-based Mn2+ sensing [29]. |
What smartphone camera settings are optimal for low-light fluorescence?
To maximize signal capture in low-light conditions:
- Use Manual Mode: Take control of automatic settings.
- Increase ISO Cautiously: Start with an ISO between 400-800 and increase as needed, but higher values introduce more image noise [13].
- Maximize Shutter Speed: Use the longest exposure time possible (e.g., several seconds). This must be combined with absolute stability from a tripod or fixed mount to prevent motion blur [31].
- Set White Balance Manually: Do not use Auto White Balance. Set it to a preset (e.g., "incandescent" or "fluorescent") that matches your lighting to ensure consistent color and intensity readings [31].
- Avoid Digital Zoom: It reduces image quality by cropping and enlarging the image [31].
Troubleshooting Guides
Issue 1: Low Fluorescence Signal or Poor Signal-to-Noise Ratio
| Possible Cause | Solution | Supporting Experiment/Protocol |
|---|---|---|
| Excitation source is too weak | Use a more powerful LED or a laser diode. Ensure the source is correctly aligned to illuminate the sample brightly and evenly. | The single-molecule detection microscope uses a laser module for high-radiance excitation [10]. |
| Emission filter is blocking signal | Verify that the filter's transmission spectrum overlaps with your fluorophore's emission peak. Consider using a wider bandpass filter. | |
| High background noise | Implement background subtraction in image analysis. Use a dark box to block all ambient light. Ensure all internal surfaces of the setup are non-reflective (matte black). | The smartphone-based microscope uses a protective black case to shield from external light [10]. |
| Camera settings suboptimal | Increase exposure time and use a tripod. Avoid increasing ISO too much, as it amplifies noise. |
| Possible Cause | Solution | Supporting Experiment/Protocol |
|---|---|---|
| Incorrect or poor-quality filters | Confirm that the emission filter's blocking range fully covers the excitation wavelength. Use high-quality, optical density-rated filters. | The ultracompact attachment design insets optical filters directly in front of the camera sensor to ensure all light is filtered [3]. |
| Stray light leaks | Check for light leaks in the enclosure. Use light traps and ensure all components are securely fitted. | The modular microscope design includes a protective case and a beam blocker to control stray light [10]. |
| Sample substrate fluorescence | Use low-fluorescence substrates like quartz instead of standard glass slides for sample mounting [10]. |
Experimental Protocols for System Validation
Protocol 1: Validating Filter Performance with a Standard Fluorophore
This protocol tests the effectiveness of your filter combination in isolating the emission signal.
Workflow: Filter Performance Validation
Materials:
- Fluorophore Solution: A standard such as ATTO 542 or ATTO 647N at a known concentration [10].
- Cuvette or sample slide
- Your assembled smartphone detector with excitation source and filters.
Method:
- Place the fluorophore sample in the setup.
- With the emission filter removed, take an image (Image A). You will likely see a very bright spot from excitation light bleed.
- Insert the emission filter and take another image under identical conditions (Image B).
- Use image analysis software to measure the average pixel intensity in the same region of interest in both images.
- Calculation: A significant intensity drop in Image B (e.g., >90%) confirms the filter is effectively blocking the excitation light. The remaining signal in Image B is your detectable fluorescence.
Protocol 2: Determining Limit of Detection (LOD) for a Target Analyte
This protocol outlines the general method for establishing the sensitivity of your smartphone-based assay, as demonstrated in multiple studies [29] [30].
Workflow: Limit of Detection (LOD) Determination
Materials:
- Target Analyte: e.g., Mn2+ [29] or Nitrite ions (NO2–) [30].
- Fluorescence Probe: A selective probe, such as N,S-doped carbon nanodots (N,S-CDs) for Mn2+ [29].
- Sample series of known concentrations.
Method:
- Prepare a series of samples with known analyte concentrations, including a blank (zero concentration).
- For each sample, measure the fluorescence intensity using your smartphone setup and image analysis app (measuring G or RGB values) [3] [29].
- Plot a calibration curve with analyte concentration on the x-axis and mean fluorescence intensity on the y-axis. Perform linear regression.
- Calculate the Limit of Detection (LOD) using the formula: LOD = 3σ/k, where:
Research Reagent Solutions
The following table lists key materials used in the experiments cited in this guide, which can serve as references for your own research.
| Reagent/Material | Function in Experiment | Example Application |
|---|---|---|
| DNA Origami Structures | Fluorescence standard; scaffold for digital assays | Validating single-molecule detection; implementing DNA-PAINT for super-resolution imaging [10]. |
| N,S-doped Carbon Nanodots (N,S-CDs) | Fluorescence probe | Selective detection and quantification of Mn2+ ions in cosmetic samples [29]. |
| CTAB-stabilized Gold Nanoparticles (CTAB-AuNPs) | Mediating probe for catalytic signal generation | Etched by NO2– to produce Au3+, which catalyzes a reaction to create a fluorescent product (DAP) [30]. |
| Triton X-100 (TX-100) | Non-ionic surfactant | Forming micelles to enhance the fluorescence emission of hydrophobic fluorophores, improving detection sensitivity [30]. |
| o-Phenylenediamine (OPD) | Fluorogenic substrate | Non-fluorescent precursor that is oxidized to fluorescent 2,3-diaminophenazine (DAP) [30]. |
| ATTO Dyes (e.g., 542, 647N) | Bright, photostable fluorophores | Used as single-molecule labels in DNA origami models to benchmark microscope performance [10]. |
Frequently Asked Questions (FAQs)
Q1: How can pro camera apps like ProCamera benefit low-light fluorescence detection research?
Pro camera apps provide manual control over critical camera parameters that are essential for scientific imaging. With apps like ProCamera, you can manually set longer exposure times to capture more light from weak fluorescent signals, control ISO to manage digital noise, and lock focus to ensure consistent imaging across multiple samples. Features like ProCamera's LowLight+ mode use multi-frame capture and computational stacking to create a single, high-quality image with superior signal-to-noise ratio, which is directly applicable to detecting faint fluorescence [32] [33].
Q2: What is the single most important setting to adjust for a better signal in low-light conditions? Exposure time is the most critical setting. A longer exposure time allows the camera sensor to collect more photons, thereby strengthening the weak signal emitted by fluorescent markers. This is often more effective than increasing the ISO, which primarily amplifies the signal but also significantly increases noise. The goal is to find the longest exposure time possible without causing motion blur (by using a stabilizer) or inducing photobleaching in your sample [34] [35] [25].
Q3: My fluorescence images have high background noise. What steps can I take to fix this? High background can stem from several sources. To troubleshoot, first ensure you have included appropriate controls, such as a "no dye" control, to check for sample autofluorescence [26] [6]. Technically, you can:
- Lower your ISO setting to reduce sensor amplifier noise.
- Use a pro camera app to shoot in RAW format, which preserves more data and allows for better noise reduction during post-processing [35].
- Employ computational noise reduction like the
LowLight+mode in ProCamera or algorithms like VLight, which blend multiple frames to suppress random noise [32] [36]. - Experiment with different blocking buffers if your background is caused by non-specific antibody binding [26].
Q4: Can smartphone cameras really be used for quantitative fluorescence analysis? Yes, with careful protocol design. The key is consistency and rigor. You must:
- Standardize all settings (exposure, ISO, white balance, focus distance) and save them as presets in your pro camera app for every imaging session [37] [6].
- Use a stabilizer to eliminate variability from hand-held operation.
- Include controls and standards in every imaging session to account for day-to-day variations in the system [6].
- Avoid altering raw pixel values during processing; always use scientific software for analysis to ensure data integrity [25] [6].
Q5: How do I know if my exposure time is correct? Use the live histogram feature available in many pro camera apps. A well-exposed fluorescence image will have a histogram where the signal is clearly separated from the background peak, without being clipped at the maximum value (which indicates saturation). If the histogram is crowded in the low-intensity range, your exposure is too short. If there is a sharp peak at the far right, your signal is saturated and you should shorten the exposure time [34] [25].
Troubleshooting Guides
Problem 1: No Staining or Very Low Signal
| Possible Cause | Diagnostic Steps | Solution |
|---|---|---|
| Insufficient Exposure | Check the live histogram; signal peak will be very low. | Manually increase the exposure time in your pro camera app. Use a stabilizer to allow for longer exposures without blur [34] [35]. |
| Low Antibody Concentration | Perform an antibody titration test. | Increase the concentration of your primary or secondary antibody to optimal levels [26]. |
| Photobleaching | Signal fades rapidly during observation. | Use an antifade mounting medium. Minimize sample exposure to excitation light by closing the shutter when not acquiring images [26]. |
| Incorrect Imaging Settings | Confirm dye specifications. | Ensure the camera is set to the correct channel. Use a filter set that matches your fluorophore's excitation/emission spectrum [26]. |
Problem 2: High Background or Non-Specific Staining
| Possible Cause | Diagnostic Steps | Solution |
|---|---|---|
| Sample Autofluorescence | Image an unstained control sample. | Use autofluorescence quenchers. Avoid using blue fluorescent dyes for low-expression targets, as autofluorescence is high in blue wavelengths [26]. |
| ISO Setting Too High | Review your camera settings. | Manually set the ISO to the lowest possible value that still provides an acceptable signal with your chosen exposure time [35]. |
| Non-Specific Antibody Binding | Perform a control with secondary antibody alone. | Use highly cross-adsorbed secondary antibodies and optimize your blocking buffer composition [26]. |
| Insufficient Washing | Review protocol. | Increase the number and volume of washes after antibody incubation steps [26]. |
Problem 3: Blurry or Out-of-Focus Images
| Possible Cause | Diagnostic Steps | Solution |
|---|---|---|
| Camera Shake | Check for blur across the entire image. | Mount the smartphone on a stabilizer (tripod). Use a timer or remote shutter release to prevent shake when pressing the button [33] [35]. |
| Incorrect Focus | The subject appears consistently soft. | Use the manual focus (MF) and focus peaking features in your pro camera app to precisely set and lock the focus distance [37]. |
| Sample Drift | Focus is good initially but is lost over time. | Ensure the sample and setup are on a stable surface. Allow the system to equilibrate to the room temperature if needed [6]. |
Experimental Protocols
Protocol 1: Standard Workflow for Smartphone Fluorescence Imaging
This workflow details the steps for capturing a reproducible fluorescence image using a pro camera app.
Protocol 2: Implementing a Computational Low-Light Enhancement Algorithm
This protocol outlines how to apply a real-time enhancement algorithm like VLight for video data.
Research Reagent Solutions
| Item | Function/Application in Fluorescence Detection |
|---|---|
| Primary & Secondary Antibodies | Specifically bind to the target antigen and carry the fluorophore for detection. Must be validated for the specific application and species [26]. |
| Antifade Mounting Medium | Preserves fluorescence signal by reducing photobleaching during microscopy and long exposure times [26]. |
| Autofluorescence Quenchers | Suppresses natural background fluorescence from cells or tissues (e.g., TrueBlack Lipofuscin Autofluorescence Quencher) [26]. |
| IgG-Free BSA or Fish Gelatin | Used in blocking buffers to prevent non-specific binding of secondary antibodies, thereby reducing background noise [26]. |
| Spectrally Separated Fluorophores | Fluorescent dyes chosen with minimal emission spectrum overlap are critical for clear multi-color imaging and to avoid cross-talk between channels [26]. |
Implementing Ratiometric Fluorescence for Self-Calibration
Ratiometric fluorescence is a powerful analytical technique that measures the ratio of two fluorescence signals instead of relying on a single, absolute intensity. This method incorporates a built-in self-calibration function, which corrects for various interferences and instrumental fluctuations, leading to significantly improved accuracy, sensitivity, and reliability in detection [38]. This technical guide focuses on the application of this technique within a specific research context: optimizing smartphone camera settings for low-light fluorescence detection. We address common experimental challenges and provide detailed protocols to help researchers and drug development professionals obtain robust and reproducible data.
Frequently Asked Questions (FAQs) & Troubleshooting
1. Why is my ratiometric fluorescence signal too weak or undetectable with my smartphone camera?
A weak signal is a common challenge in low-light detection. This can be caused by several factors related to both your sample and your detection setup.
- Probable Causes and Solutions:
- Insufficient Fluorophore Concentration: The concentration of your sensing and reference fluorophores may be below the detection limit of your smartphone camera. Prepare fresh stock solutions and perform a concentration series to determine the optimal range.
- Suboptimal Smartphone Camera Settings: The default camera settings are not suited for low-light fluorescence.
- Action: Use a professional camera application that allows manual control. Maximize the exposure time (shutter speed) and increase the ISO sensitivity [4]. Be aware that very high ISO can introduce noise.
- Action: Ensure all detections are performed in a light-tight environment to eliminate background light interference [4] [39].
- Inefficient Excitation or Photon Collection: The hardware setup may not be efficiently exciting the fluorophores or collecting the emitted light.
- Action: Integrate a plano-convex lens in your setup to focus and collect more emitted photons onto the camera sensor [4] [39].
- Action: Use a reflector inside your sample chamber. A diffusive reflection polymer film has been shown to enhance output intensity up to three-fold compared to a default chamber [4].
2. The fluorescence ratio seems unstable and fluctuates between measurements. How can I improve reproducibility?
Fluctuations in the ratio signal often stem from environmental and instrumental variables that are not being corrected by the self-calibration function.
- Probable Causes and Solutions:
- Probe Concentration Variations: Even with ratiometric self-calibration, drastic changes in the overall probe concentration can affect signals. Ensure consistent probe dosage across all samples [38].
- Fluctuations in Excitation Source: An unstable laser or LED light source will cause intensity drifts. Use a constant, well-regulated power supply for your excitation source.
- Background Noise: Electronic noise from the smartphone's camera sensor or ambient light leakage can overwhelm weak signals.
- Action: Apply a Noise Reduction Ensemble Averaging (NREA) algorithm during image processing. This technique significantly reduces random noise while preserving the desired fluorescence signal, improving the signal-to-noise ratio (SNR) [4] [39].
- Action: Use an optical low-pass filter (emission filter) in front of the camera to block scattered excitation light and only transmit the fluorescence emission [39].
3. The color change of my ratiometric probe is difficult to distinguish visually or with the smartphone. What can I do?
Visual detection relies on a clear contrast between the two emission colors.
- Probable Causes and Solutions:
- Low Contrast between Emission Channels: The two fluorophores may have overlapping or too-similar emission spectra.
- Action: Design or select a probe pair with a large wavelength gap (Δλ) between the two emission peaks. For example, a probe with Δλem = 153 nm provides a distinct color change that is easier to distinguish [40].
- Smartphone Image Processing: The native camera app may automatically correct colors. Use an app that allows you to capture images in a raw, unprocessed format and then extract the Red-Green-Blue (RGB) values quantitatively for ratiometric analysis [41].
- Low Contrast between Emission Channels: The two fluorophores may have overlapping or too-similar emission spectra.
Experimental Protocols for System Validation
This section provides a step-by-step guide for a key experiment: verifying the self-calibration capability of your ratiometric sensor and smartphone system against depth-dependent signal attenuation.
Protocol: Validating Self-Calibration Against Depth Variation
1. Principle In vivo or in tissue-simulating environments, the depth of a fluorescent sensor can greatly influence the detected signal intensity due to light scattering and absorption. A key advantage of ratiometric probes is their ability to correct for this variation. This protocol uses a ratiometric diffuse in vivo flow cytometry (R-DiFC) method to demonstrate this principle [42].
2. Materials
- Ratiometric fluorescent sensor (e.g., fRBC sensors containing both Chromoionophore III (red) and Rhodamine 18 (green) [42])
- Smartphone-based fluorescence detection setup with dual-channel emission capability [42] [13]
- Tissue-simulating phantom (e.g., made of intralipid or other scattering materials)
- Microfluidic tubing or channel embedded at varying depths (0.1 - 1 mm) within the phantom
- Syringe pump
- Data acquisition and processing software (e.g., MATLAB)
3. Procedure
- Step 1: System Setup. Configure your smartphone-based detector to simultaneously excite the sensors and collect fluorescence in two distinct channels (e.g., green and red). Use appropriate dichroic mirrors and bandpass filters [42].
- Step 2: Sample Preparation. Prepare a suspension of your ratiometric sensors at a physiological concentration in a suitable buffer.
- Step 3: Data Acquisition. Use the syringe pump to flow the sensor suspension through the microchannel at different depths within the phantom. For each depth, record the transient fluorescence peaks from both the green and red channels using the smartphone camera.
- Step 4: Signal Processing.
- Identify fluorescence peaks that appear simultaneously on both channels (within a 0.03 s time window) [42].
- For each coincident peak, record the amplitude (intensity) from both the green (reference, IG) and red (sensing, IR) channels.
- Calculate the intensity ratio (IR / IG) for each peak.
- Calculate the mean ratio for all detected sensors at each depth.
4. Data Analysis
- Plot the individual green and red fluorescence intensities versus sensor depth. You will likely observe a significant decrease in both signals as depth increases.
- On the same graph, plot the calculated mean intensity ratio (IR / IG) versus depth. A well-functioning ratiometric sensor will show a ratio that remains constant regardless of depth, successfully demonstrating self-calibration.
The workflow for this validation experiment is summarized below.
Performance Data for Smartphone-Based Detection
The following table summarizes key quantitative data from recent studies utilizing smartphone-based fluorescence detection, which can serve as benchmarks for your own system optimization.
Table 1: Performance Metrics of Smartphone-Based Fluorescence Detection Systems
| Detection Target | Sensor Type | Linear Range | Limit of Detection (LOD) | Key Smartphone Feature Used | Ref. |
|---|---|---|---|---|---|
| Tetracycline (Antibiotic) | Ratiometric (AuNCs/CDs on Photonic Crystal) | 0.1 - 10 μM | 34 nM | High-resolution CMOS camera for dual-emission capture | [43] |
| Folic Acid (Vitamin) | Ratiometric (N-Nb2C QDs/CQDs) | 0.1 - 350 μM | 189 nM | RGB analysis for visual quantitative determination | [41] |
| Bioluminescence (Bacteria) | Single-channel (P. fluorescens M3A) | N/A | ~10⁶ CFU/mL (≈10⁷ photons/s) | Long exposure (180 s) with NREA algorithm | [4] |
| Systemic Sodium (Ion) | Ratiometric (fRBC sensors with R-DiFC) | Physiological range (135-145 mM) | N/A | Dual-channel peak detection for self-calibration against depth | [42] |
The Scientist's Toolkit: Essential Research Reagents & Materials
This table lists critical components used in developing and implementing ratiometric fluorescence assays, as featured in the cited research.
Table 2: Key Reagents and Materials for Ratiometric Fluorescence Experiments
| Item Name | Function / Description | Example Application |
|---|---|---|
| Gold Nanoclusters (AuNCs) | Ultrasmall, stable fluorescence probe serving as the responsive signal element. | Fluorescence quenched by Cu²⁺ and restored by Tetracycline in a ratiometric sensor [43]. |
| Carbon Dots (CDs) / Quantum Dots (QDs) | Highly fluorescent nanomaterials that can serve as a stable reference signal. | Used as a constant internal reference in sensors for tetracycline and folic acid [43] [41]. |
| NBD (7-nitro-2,1,3-benzoxadiazole) | A fluorescence quencher that undergoes specific thiolysis with H₂S. | Used to create an "Off-On" responsive signal in a self-correcting H₂S probe [40]. |
| Rhodamine and Naphthalimide | Classic organic fluorophores with distinct emission profiles. | Paired as reference and responsive units, respectively, in a ratiometric H₂S probe [40]. |
| Photonic Crystals (PCs) | Periodic nanostructures that can enhance fluorescence via the slow light effect. | Used to amplify the fluorescence of AuNCs by a factor of 7.6, improving sensitivity [43]. |
| Noise Reduction Ensemble Averaging (NREA) Algorithm | A signal processing algorithm that reduces random noise in low-light images. | Critical for achieving low detection limits in smartphone-based bioluminescence detection [4]. |
Core Biomarker Data: miRNA Signatures for Infection Typing
MicroRNA (miRNA) profiling offers a promising approach to differentiate between bacterial and viral infections by identifying distinct expression patterns in plasma samples. The tables below summarize significantly downregulated miRNAs identified via microarray analysis, providing a quantitative basis for diagnostic assay development. [44]
Table 1: Significantly Downregulated Plasma miRNAs in Bacterial Infection (vs. Control)
| miRNA | Corrected p-value | Fold Change (FC) |
|---|---|---|
| hsa-miR-24-2-5p | 0 | -10.0 |
| hsa-miR-26a-2-3p | 0.002962 | -13.422 |
| hsa-miR-3167 | 2.2170502E-4 | -10.9888 |
| hsa-miR-3176 | 9.1387825E-5 | -40.2192 |
| hsa-miR-331-5p | 0.01968 | -22.8854 |
| hsa-miR-431-3p | 1.1901482E-5 | -22.38 |
| hsa-miR-4522 | 0.002968 | -17.2019 |
| hsa-miR-548b-5p | 8.144242E-4 | -11.7516 |
| hsa-miR-569 | 0.01786 | -20.6015 |
| hsa-miR-579-3p | 0.01786 | -137.592 |
| hsa-miR-767-5p | 0.002822 | -13.132 |
Table 2: Significantly Downregulated Plasma miRNAs in Viral Infection (vs. Control)
| miRNA | Corrected p-value | Fold Change (FC) |
|---|---|---|
| hsa-miR-26a-2-3p | 0.002753767 | -13.422 |
| hsa-miR-3167 | 3.2166985E-4 | -10.9888 |
| hsa-miR-326 | 3.4808484E-4 | -62.7199 |
| hsa-miR-331-5p | 0.019167775 | -22.8854 |
| hsa-miR-3659 | 3.2166985E-4 | -17.1089 |
| hsa-miR-431-3p | 2.529065E-5 | -22.38 |
| hsa-miR-4522 | 0.002803409 | -17.2019 |
Experimental Protocol: Plasma miRNA Profiling via Microarray
This protocol details the methodology for identifying infection-specific miRNA signatures from human plasma, a technique foundational to developing smartphone-based detection assays. [44]
Sample Collection and Ethics
- Source: Obtain plasma samples from patients with clinically diagnosed bacterial (e.g., pneumonia) or viral (e.g., human papillomavirus) infections. Include healthy control samples for baseline comparison.
- Ethics: Secure approval from the relevant institutional ethical committee. Obtain informed consent from all patients prior to sample collection.
- Storage: Post-collection, freeze plasma samples immediately and store at -80 °C.
RNA Extraction
- Kit: Use Norgen’s Plasma/Serum Circulating and Exosomal RNA Purification Kit Dx (Slurry Format).
- Input: Use 100 ng of total RNA per sample for downstream analysis.
Microarray Profiling
- Platform: Use the Agilent SurePrint Human miRNA v21.0 microarray (G4872A).
- Labeling & Hybridization:
- Employ the Agilent microRNA Spike-In kit and the miRNA Complete Labeling and Hyb Kit for sample preparation.
- Include a purification step using Micro Bio-Spin 6 spin columns to reduce artifacts.
- Desiccate the sample via vacuum centrifugation and resuspend in 18 µL of RNase-free water.
- Hybridize the samples on the microarray slide at 55°C for 20 hours in a hybridization oven.
- Scanning & Data Extraction: Wash the slides and scan using an Agilent Microarray Scanner. Analyze resulting images with Agilent Feature Extraction software to generate numerical expression values.
Data Analysis
- Normalization: Perform data normalization using the quantile algorithm in the Agilent GeneSpring GX program.
- Identification of Differentially Expressed miRNAs: Use the "Filter on Volcano Plot" analysis with an unpaired t-test. Apply a significance threshold of a fold change of ±1.5 and a corrected p-value < 0.05 (Benjamini-Hochberg method) for comparisons between infection samples and controls.
- Pathway Analysis: Use Ingenuity Pathway Analysis (IPA) software to elucidate the biological functions and pathways associated with the identified miRNAs.
miRNA Biogenesis and Function in Infection
The following diagram illustrates the pathway of miRNA biogenesis and its role in post-transcriptional gene regulation during host immune responses to bacterial infection. [45]
Smartphone Fluorescence Microscopy Setup
This section outlines the configuration of a low-cost, portable smartphone-based microscope capable of direct single-molecule fluorescence detection, which is a key platform for point-of-care bioassays. [10]
Microscope Assembly Workflow
The diagram below shows the logical workflow for assembling and using a smartphone-based fluorescence microscope for single-molecule detection assays.
The Scientist's Toolkit: Research Reagent Solutions
Table 3: Essential Materials for Smartphone-Based Fluorescence Bioassays
| Item | Function/Application | Key Considerations |
|---|---|---|
| Norgen’s Plasma/Serum RNA Purification Kit | Extraction of circulating miRNAs from plasma/serum for biomarker discovery. [44] | Designed for low-concentration, fragmented RNA in biofluids. |
| Agilent Microarray Platform | High-throughput profiling of miRNA expression signatures. [44] | Provides comprehensive coverage; requires specialized equipment and bioinformatics analysis. |
| DNA Origami Structures | Fluorescence standards and biosensing scaffolds for single-molecule detection. [10] | Allows precise nanoscale control over dye placement for quantitative imaging. |
| Total Internal Reflection (TIR) Configuration | Illumination technique for single-molecule imaging. Reduces background signal by exciting a thin sample layer. [10] | Requires laser, focusing lens, half-ball lens (prism), and immersion oil for index matching. |
| Low NA Air Objective | Collects emitted fluorescence from the sample. | A cost-effective, low numerical aperture objective is sufficient for many smartphone microscopy applications. [10] |
| Emission Filter (EF) | Spectrally filters light, allowing only the dye-specific fluorescence to reach the camera. [10] | Critical for achieving a high signal-to-noise ratio by blocking scattered laser light. |
| Ratiometric Fluorescence (RF) Probes | Probes with two inverse dynamic emissions for highly reliable and sensitive detection. [13] | Internal calibration minimizes interference from environmental and instrumental factors. |
Troubleshooting Guide & FAQs
Troubleshooting Fluorescence Imaging on Smartphone Platforms
Problem: No Staining or Low Signal
- Cause & Solution: Check application validation and species reactivity of primary antibodies. [26] Titrate antibody concentration to find the optimal level, as concentrations that are too low will yield weak signals. [26] For intracellular targets, ensure proper fixing and permeabilization protocols are used. [46] Use mounting medium with an antifade reagent and choose photostable dyes (e.g., rhodamine-based) to combat photobleaching. [26] Verify that the correct excitation/emission settings are being used for the specific dyes, as far-red dyes are not visible to the eye and require a camera for detection. [26]
Problem: High Background or Non-Specific Staining
- Cause & Solution: This is often due to cell or tissue autofluorescence. Use an unstained control to assess its level. [26] Avoid blue fluorescent dyes for low-expression targets, as autofluorescence is high in blue wavelengths. Use autofluorescence quenchers. [26] Perform staining controls with the secondary antibody alone to check for direct binding to the sample. [26] Titrate down the antibody concentration if both signal and background are high. [26] For smartphone imaging, ensure proper TIR illumination configuration to minimize background from the excitation light. [10]
Problem: Signal Saturation or Weak Dynamic Range
- Cause & Solution: Use the camera's live histogram to determine ideal exposure. A sharp cliff at the maximum signal level indicates saturation. [34] Reduce excitation light intensity or shorten the exposure time to rectify this. [34] Match the display dynamic range to the data dynamic range for better visibility without losing original image data. [34] Start with gentle excitation and lengthen exposure until the signal is clear above the background noise. [34]
Problem: Inconsistent Results Between Imaging Sessions
- Cause & Solution: Maintain consistent sample preparation, focus, light intensity, and environmental factors (temperature, CO₂). [6] Use a predetermined, unbiased method for selecting regions of interest (ROI), such as random or fixed location acquisition across the sample well. [6] Calibrate hardware regularly and check overlay/registration of channels using fluorescent beads. [6]
Frequently Asked Questions (FAQs)
Q1: What are the key advantages of using miRNAs as biomarkers for infectious diseases?
- A: miRNAs offer several advantages: 1) Early Detection: Changes in miRNA profiles can be observed early in disease onset, often before the pathogen is directly detectable or seroconversion occurs. [47] 2) Stability: They are remarkably stable in biofluids like plasma, enduring multiple freeze-thaw cycles and extreme pH conditions. [47] 3) Specific Signatures: They provide distinct molecular signatures that can differentiate between bacterial and viral infections, as well as disease severity, guiding appropriate treatment. [44] [47]
Q2: Can a smartphone microscope truly detect single molecules, and how is this achieved?
- A: Yes. Direct single-molecule detection has been achieved with low-cost, portable smartphone-based microscopes. This is accomplished by using Total Internal Reflection (TIR) illumination, which drastically reduces background signal by only exciting a very thin layer of the sample adjacent to the substrate. This, combined with a sensitive smartphone CMOS sensor and appropriate emission filters, allows for the detection of single fluorescent molecules without the need for signal amplification. [10]
Q3: What strategies can improve the sensitivity of my smartphone-based fluorescent biosensor?
- A: Key strategies include:
- Ratiometric Fluorescence (RF): Use probes with two emissions that change inversely. This provides an internal calibration, making measurements more reliable and sensitive to low analyte concentrations. [13]
- Plasmon-Enhanced Fluorescence: Leverage metal nanostructures to amplify the local electromagnetic field, which can significantly increase the fluorescence intensity of nearby dyes. [13]
- Optimized Optical Path: Ensure your setup uses a laser for bright, spectrally narrow excitation and high-quality emission filters to maximize signal-to-noise ratio. [10]
Q4: My flow cytometry experiment shows high background. How can I fix this?
- A: High background in flow cytometry can be addressed by:
- Blocking and Washing: Optimize your blocking step (e.g., try different blocking solutions, include an Fc block) and increase the number or volume of washes, potentially with a low concentration of detergent. [46]
- Reducing Autofluorescence: Keep cells on ice, avoid over-fixing, and use viability dyes to exclude dead cells during analysis. Consider using fluorophores that emit in the red channel for highly autofluorescent cell types. [46]
- Antibody Titration: Titrate your antibodies to find the optimal concentration, as overly high concentrations can increase background. [26] [46]
Single-Molecule Detection and Super-Resolution Imaging
Troubleshooting Guides and FAQs
Frequently Asked Questions
Q1: My smartphone camera cannot detect any fluorescence signal. What are the most common causes? The most common causes for a lack of signal are insufficient light collection and high background noise.
- Solution: Ensure you are using a long exposure time (e.g., 15-60 seconds) [4]. Verify that your setup is completely light-tight. Use high-quality emission filters to block scattered excitation light and improve the signal-to-noise ratio (SNR) [10] [48]. Employing a collection lens can also dramatically increase captured light [4].
Q2: My images are too noisy for quantitative analysis. How can I improve the signal-to-noise ratio? Noise can be reduced through both hardware and software methods.
- Solution: Implement computational noise reduction algorithms. The Noise Reduction by Ensemble Averaging (NREA) algorithm, which averages multiple image frames, can improve SNR by up to four times compared to simple image accumulation [4]. Alternatively, apply post-processing filters; a 3D Gaussian filter with a kernel size of 21x21x21 and σ=5 has been shown to significantly enhance signal quality [48].
Q3: Can I really achieve single-molecule detection with a standard smartphone? Yes, recent advances have made direct single-molecule detection possible without signal amplification.
- Solution: A specialized portable microscope attachment using Total Internal Reflection (TIR) or Highly Inclined and Laminated Optical sheet (HILO) illumination with a laser source is required. This configuration minimizes background, allowing commercially available smartphones to detect single molecules with a signal-to-noise ratio of ~3.3 [10].
Q4: What are the key hardware components needed to build a smartphone-based super-resolution microscope? The key components for a low-cost, portable setup include [10]:
- A laser diode (e.g., 640 nm for dyes like ATTO 647N) for high-radiance excitation.
- A low-cost, low numerical aperture (NA) air objective.
- Precision emission filters to isolate the fluorescence signal.
- A 3D-printed or custom-made modular microscope body to align all components.
- A smartphone, which acts as both the detector and the "tube lens" for the system.
Q5: Which smartphone camera features are most critical for low-light fluorescence detection? The most important features are manual control over exposure and a sensitive CMOS sensor.
- Solution: Use a smartphone that allows manual control of exposure time (shutter speed) through its native camera app or a third-party application (e.g., FV-5 for Android). Long exposure times (many seconds) are essential for collecting enough photons from dim samples [4]. Larger sensor sizes and larger pixel sizes generally contribute to better low-light sensitivity [2].
Experimental Protocols for Key Applications
Protocol 1: Detecting Bioluminescence from Bacterial Reporters This protocol is adapted from bioluminescence detection of Pseudomonas fluorescens M3A [4].
- Sample Preparation: Culture bioluminescent reporter bacteria to a concentration of ~10^6 CFU/mL.
- Hardware Setup: Place the sample in a 12 x 75 mm glass tube. Position the tube in a 3D-printed, light-tight cradle. A diffusive reflection polymer film inside the chamber enhances photon collection efficiency by up to three-fold. A plano-convex collection lens (f=25 mm) can be added to increase signal.
- Smartphone Settings: Use a smartphone app that allows long exposure (e.g., 180 seconds). Set the exposure to its maximum value and the ISO to a medium setting to avoid saturation.
- Image Acquisition and Processing: Capture a series of images in rapid succession. Process the images using the NREA algorithm to average the frames and suppress random noise.
Protocol 2: Direct Single-Molecule Detection and DNA-PAINT Super-Resolution Imaging This protocol is adapted from single-molecule detection on DNA origami and SMLM of cells [10].
- Sample Preparation: Immobilize fluorescently labeled samples (e.g., DNA origami structures or fixed cells with target proteins labeled for DNA-PAINT) on a quartz substrate.
- Microscope Setup: Use a portable smartphone-based microscope with TIR illumination.
- Excitation: Use a laser (e.g., 640 nm for ATTO 647N) focused through a half-ball lens prism.
- Emission Collection: Use a low-NA objective. Place an emission filter matching your fluorophore before the smartphone camera.
- Smartphone Settings: Set the smartphone to video mode with the highest possible resolution (e.g., 1080p) and frame rate. Use manual focus locked onto the sample plane.
- Data Acquisition: Record a video of the blinking fluorescence of single molecules. For DNA-PAINT, this involves transient binding of dye-labeled imager strands.
- Super-Resolution Reconstruction: Transfer the video to a computer. Use single-molecule localization software (e.g., for DNA-PAINT) to determine the precise coordinates of each blinking event and reconstruct a super-resolution image with a theoretical localization precision of around 84 nm [10].
Quantitative Performance Data
Table 1: Smartphone Performance in Low-Light Detection Applications
| Application | Key Metric | Reported Performance | Smartphone Model(s) Used | Required Integration/Processing |
|---|---|---|---|---|
| Bioluminescence Detection [4] | Minimum Detectable Radiant Flux | ~picoWatts (pW); ~10^7 photons/s | OnePlus One (Android), iPhone 5S | 180 seconds exposure; NREA algorithm |
| Single-Molecule Detection [10] | Signal-to-Noise Ratio (SNR) | ~3.3 | Apple, Samsung, Huawei models | Direct detection; TIR illumination |
| Super-Resolution Imaging [10] | Localization Precision / Resolution Enhancement | 84 nm / 6.6-fold enhancement | Apple, Samsung, Huawei models | DNA-PAINT; SMLM processing |
| Fluorescence Microscopy [48] | Signal-Difference-to-Noise Ratio (SDNR) & Contrast-to-Noise Ratio (CNR) | Significant improvement post-filtering | Samsung Galaxy S21 Ultra | 3D Gaussian Filter (21x21x21, σ=5) |
Table 2: Comparison of Computational Noise Reduction Techniques
| Method | Principle | Advantages | Limitations | Reported Efficacy |
|---|---|---|---|---|
| NREA Algorithm [4] | Ensemble averaging of multiple image frames | Effectively reduces random noise; improves SNR up to 4x | Requires capture of multiple images | SNR plateau after ~5 integrated frames |
| 3D Gaussian Filter [48] | Spatial averaging with Gaussian weighting | Simplistic application; enhances SDNR and CNR | May blur fine details if overused | Best results with 21x21x21 kernel and σ=5 |
| VLight Algorithm [36] | Physics-inspired brightness boosting for video | Real-time processing (up to 67 FPS for 4K) | Post-processing on ISP output; display-referred | Enables real-time low-light video enhancement |
Essential Research Reagent Solutions
Table 3: Key Reagents and Materials for Smartphone Fluorescence Imaging
| Item | Function/Description | Example Application |
|---|---|---|
| DNA Origami Structures [10] | Nanoscale scaffolds for precise positioning of fluorescent dyes; used as standards and biosensors. | Single-molecule detection calibration; DNA-PAINT super-resolution imaging. |
| ATTO Dyes (e.g., ATTO 647N) [10] | Bright, photostable fluorescent dyes for single-molecule microscopy. | Labeling DNA origami or antibodies for high-sensitivity detection. |
| Indocyanine Green (ICG) [49] | Near-infrared (NIR) fluorescence contrast agent used in clinical imaging. | NIR fluorescence imaging in tissue phantoms and rodent models. |
| N,S-doped Carbon Nanodots (N,S-CDs) [29] | Fluorescent nanoprobes that can be synthesized for specific analyte sensing. | Sensing and quantifying trace metal ions (e.g., Mn²⁺) in cosmetic products. |
| Fluorescent Microspheres [48] | Synthetic beads of defined size (0.8 µm to 8.3 µm) with uniform fluorescence. | System calibration and resolution testing for fluorescence microscopes. |
Workflow and System Diagrams
Single-Molecule Detection Workflow
Signal Pathway and Enhancement Logic
Maximizing Sensitivity and Signal-to-Noise Ratio
This guide provides technical support for researchers using smartphone cameras in low-light fluorescence detection experiments. Mastering manual control over camera settings is crucial for obtaining reliable, quantitative data from applications such as detecting specific biomarkers, imaging single molecules, or monitoring biological processes in real-time.
Frequently Asked Questions (FAQs) and Troubleshooting
1. My fluorescence images are too dark and lack any discernible signal. What should I adjust?
- Primary Solution: Increase the exposure time (shutter speed). A slower shutter speed allows more light to reach the sensor, which is essential for weak fluorescence signals [50]. For bioluminescence, exposure times can be extended to 60 seconds or more [4].
- Secondary Adjustment: Increase the ISO sensitivity. If the subject is static, prioritize a slow shutter speed and use a moderate ISO (e.g., 400-800) to brighten the image while managing noise [50].
- Check: Ensure your experimental setup is light-tight to avoid ambient light contamination.
2. My images are grainy with high noise, obscuring the fluorescence signal. How can I improve clarity?
- Primary Solution: Lower the ISO setting. High ISO values amplify the signal and the electronic noise, leading to graininess [50]. Use the lowest ISO possible that still provides an acceptable signal level.
- Secondary Adjustment: Compensate for the lower ISO by significantly increasing the exposure time (shutter speed). This trade-off is key for clean images in low-light conditions [50].
- Advanced Solution: Employ computational noise reduction. One proven method is the Noise Reduction by Ensemble Averaging (NREA) algorithm, which can improve the signal-to-noise ratio (SNR) by up to four times compared to simple image accumulation [4].
3. The background in my images is too bright, washing out the specific fluorescence. How do I fix this?
- Primary Solution: Ensure you are using high-quality optical filters. An emission (barrier) filter that precisely blocks the excitation laser or LED light while transmitting the fluorescence wavelength is critical [3] [1] [51].
- Secondary Adjustment: Re-evaluate your ISO and shutter speed. An over-bright background can indicate that the overall exposure is too high. Try decreasing the ISO first [50].
- Check: Verify that all components in your setup, especially the imaging chamber, are made of non-fluorescent materials to minimize autofluorescence.
4. When I try to capture fast biological processes, like a beating heart, the motion is blurred.
- Solution: Use a faster shutter speed. This freezes motion but results in a darker image [50]. To compensate, you will need a very bright fluorophore or a higher-intensity excitation light source. This often requires a balance between motion capture and signal intensity.
5. The colors in my image do not look accurate. How can I ensure true-to-life color representation?
- Solution: Manually set the White Balance (WB) instead of using Auto mode. Different lighting conditions have different color temperatures. Auto White Balance can incorrectly render colors, especially under specialized excitation light. Use a preset (e.g., "Sunny") or a custom Kelvin value to neutralize the color cast [50].
Optimized Camera Settings for Low-Light Fluorescence
The table below summarizes the function and optimal adjustment strategy for key manual camera settings in the context of low-light fluorescence detection.
| Camera Setting | Function & Effect | Optimization Strategy for Low-Light Fluorescence |
|---|---|---|
| ISO | Controls the sensor's sensitivity to light. Higher values brighten the image but introduce more digital noise [50]. | Use the lowest possible ISO that provides a detectable signal (e.g., start at 100-400). Prioritize a longer shutter speed over a high ISO to reduce noise [50]. |
| Shutter Speed | Determines how long the camera's sensor is exposed to light. Measured in seconds or fractions of a second [50]. | Use a slow shutter speed (e.g., 1/30s to several seconds or more) to collect more photons. Essential for weak signals. For fast processes, use the fastest speed that still captures a usable signal [50] [4]. |
| Exposure Value (EV) | A general setting that makes the overall image brighter (positive EV) or darker (negative EV) [50]. | Often kept at 0 after manually setting ISO and Shutter Speed. Use for fine-tuning if those primary settings are locked. |
| Focus | Controls which part of the image appears sharp. Can be automatic or manual [50]. | Use Manual Focus. Auto-focus can struggle in low-light conditions. Manually adjust the focus until the fluorescent object is sharpest [50]. |
| White Balance (WB) | Adjusts the color temperature to make light appear neutral (white), removing unrealistic color casts [50]. | Set manually using a preset (e.g., "Sunny" at 5000K) or a custom value to ensure consistent color representation across experiments [50]. |
Experimental Protocols for System Validation
Protocol 1: Characterizing the Limit of Detection (LOD) for a Fluorophore
This protocol is adapted from methods used to validate smartphone-based systems for detecting protoporphyrin-IX (PpIX) [3].
- Sample Preparation: Prepare a dilution series of your target fluorophore (e.g., from 10 nM to 1000 nM) in an appropriate buffer or liquid tissue phantom.
- Imaging Setup: Mount your smartphone on the fluorescence microscope or imaging attachment. Ensure the excitation source and emission filters are correctly positioned.
- Image Acquisition: Using your optimized manual settings (low ISO, long shutter speed, manual focus), capture images of each fluorophore concentration. Maintain consistent distance and illumination power for all samples.
- Signal Quantification: Use analysis software to draw a Region of Interest (ROI) around the sample area and measure the average pixel intensity. Subtract the average intensity of a background ROI.
- Data Analysis: Plot the background-subtracted fluorescence intensity against the known fluorophore concentration. The Limit of Detection (LOD) can be determined as the concentration that yields a signal three times the standard deviation of the background (noise) signal. A well-optimized system can achieve an LOD of <10 nM for PpIX with good linearity (R² >0.99) [3].
Protocol 2: Single-Molecule Imaging and Validation
This protocol outlines the core steps for achieving single-molecule sensitivity, as demonstrated with a portable smartphone microscope [10].
- Sample Preparation: Use a known standard for validation, such as DNA origami structures with a single fluorescent dye attached [10]. Immobilize the structures on a quartz substrate at a low density.
- Microscope Configuration: Employ Total Internal Reflection (TIR) or Highly Inclined and Laminated Optical (HILO) illumination to minimize background fluorescence. A laser is typically required as the excitation source for sufficient intensity [10] [51].
- Camera Settings Optimization:
- Shutter Speed: Set to a relatively fast speed (e.g., 10-100 ms) to capture the dynamics of single molecules, such as blinking.
- ISO: Set as low as possible while still being able to detect the faint signal. This is critical for minimizing noise.
- Focus: Use manual focus and fine-tune it to achieve the smallest possible point spread function from the single emitters.
- Validation: Record a time-lapse video of the sample. The signature of a single molecule is a "blinking" fluorescence followed by a single, irreversible step down to the background level (photobleaching). A signal-to-noise ratio (SNR) of 3.3 or higher confirms single-molecule detection [10].
Research Reagent and Material Solutions
The following table lists key materials and reagents commonly used in building and using smartphone-based fluorescence detection systems.
| Item | Function / Application | Example / Note |
|---|---|---|
| Smartphone with Manual Control | The core imaging and computation unit. | Must support full manual control over ISO, Shutter Speed, and Focus in a "Pro" or "Manual" mode [50] [52]. |
| LED or Laser Light Source | Provides excitation light for the fluorophore. | Blue (450-490 nm) or cyan (495 nm) LEDs for GFP/RFP [1]. 405 nm or 640 nm lasers for specific assays [10] [51]. |
| Emission Filter (Barrier Filter) | Blocks excitation light and transmits only the fluorescence emission signal. | Rosco theatrical gels (e.g., #14, #312 for green/red fluorescence) are a low-cost option [1]. High-quality glass filters are used for superior performance [3]. |
| 3D-Printed Attachment / Microscope Frame | Houses the optical components and aligns them with the smartphone camera. | Custom-designed enclosures can be fabricated using black resin to reduce internal reflections [3] [51]. |
| Ratiometric Fluorescence Nanoprobe | For quantitative sensing of specific analytes (e.g., pesticides, metal ions). | A mixture of different nanoparticles (e.g., carbon dots and quantum dots) that produce an internal reference signal and a analyte-sensitive signal, allowing for more robust quantification [53]. |
| Fluorescently Labeled Antibodies / Reporters | Used to tag specific biological targets (cells, proteins, pathogens). | FITC-labeled antibodies for disease diagnosis (e.g., Chagas, ANCA) [51]. Bioluminescent reporter bacteria for environmental sensing [4]. |
Workflow and System Diagrams
Smartphone Fluorescence Detection Workflow
Inverted Laser Fluorescence Microscope Design
Advanced Noise Reduction through Computational Algorithms
This technical support center provides essential guidance for researchers optimizing smartphone cameras for low-light fluorescence detection. Fluorescence-based biosensors are a cornerstone of modern biomedical research and drug development due to their high sensitivity and specificity [13]. However, achieving reliable results in low-light conditions is challenging due to inherent signal noise. This resource details computational strategies to overcome these limitations, enabling robust quantitative analysis.
Troubleshooting Guides & FAQs
Frequently Asked Questions
Q1: What is the simplest computational method to improve my signal-to-noise ratio (SNR) for basic fluorescence imaging?
A1: For initial experiments, frame averaging is the most straightforward and effective method. Capture multiple images of your sample in rapid succession and compute the average pixel intensity across all frames. This technique reduces random temporal noise, a major component of the total noise in low-light conditions. For static samples, even a simple average of 5-10 frames can yield a noticeable improvement in SNR, making it a good starting point before implementing more complex algorithms [4].
Q2: My research requires detecting very dim bioluminescence. Are there specialized algorithms for this?
A2: Yes. For ultra-low-light applications like bioluminescence detection, the Noise Reduction by Ensemble Averaging (NREA) algorithm has proven highly effective. Unlike simple frame averaging, the NREA algorithm is mathematically designed to cancel out noise when the input signal is close to the system's noise floor. In one study, this algorithm improved SNR by up to four times compared to simple accumulation, enabling the detection of single-digit picoWatts of radiant flux intensity, which corresponds to signals on the order of ~10^7 photons per second [4].
Q3: Can I perform low-light fluorescence video enhancement in real-time on a smartphone?
A3: Yes, real-time enhancement is becoming feasible. Recent research has led to the development of highly efficient algorithms like VLight, a single-parameter low-light enhancement algorithm designed for mobile deployment. VLight functions as a custom brightness-boosting curve applied to video frames after they are processed by the phone's Image Signal Processor (ISP). It has been demonstrated to run at up to 67 frames per second (FPS) for 4K videos directly on a smartphone, allowing for real-time adaptation to changing lighting conditions during an experiment [36].
Q4: What smartphone camera settings are most critical for maximizing low-light sensitivity?
A4: The most critical setting is exposure time. Whenever your experimental setup allows for a stationary sample, maximize the camera's exposure time (shutter speed) to collect as many photons as possible. Secondly, control the ISO sensitivity carefully. While a higher ISO brightens the image, it also amplifies noise; find a balance that maximizes signal without introducing excessive grain. Finally, use applications that allow you to capture images in RAW format, as this bypasses the phone's aggressive noise reduction and compression, preserving more data for your computational algorithms to process [4] [2].
Troubleshooting Common Experimental Issues
Problem: High background noise overwhelming the fluorescence signal.
- Solution: Implement ratiometric fluorescence measurement. This method uses two inverse dynamic emissions and is more reliable than single-wavelength readout because it provides a built-in calibration mechanism, correcting for variations in excitation light intensity, probe concentration, and environmental effects [13].
Problem: Images are too dark even with long exposure times.
- Solution: Verify your optical setup. Ensure you are using efficient light collection methods. One study found that using a diffusive reflection polymer film in the sample chamber enhanced output signal up to three-fold compared to basic 3D-printed materials. Additionally, a simple plano-convex collection lens can increase captured light by up to 17 times [4].
Problem: Need to detect single molecules for a digital bioassay or super-resolution imaging.
- Solution: Achieving single-molecule sensitivity requires a holistic approach. A specialized smartphone microscope has demonstrated this capability using total internal reflection (TIR) illumination to minimize background, a high-numerical aperture objective, and a low-cost laser for focused, high-intensity excitation. This setup, combined with standard single-molecule localization microscopy techniques like DNA-PAINT, achieved a localization precision of 84 nm [54].
Quantitative Performance Data
Table 1: Smartphone Performance in Low-Light Bioluminescence Detection [4]
| Smartphone Model | Low-Light Detection Limit (Photons/s) | Key Enabling Factor |
|---|---|---|
| OnePlus One (Android) | ~10^7 | 180s integration time + NREA algorithm |
| iPhone 5S (iOS) | ~10^7 | 60s exposure via app + NREA algorithm |
| Standard Android phones (e.g., LG G2) | ~10^8 | Limited to ~1/6s exposure time |
Table 2: Comparison of Computational Noise Reduction Algorithms [4] [36]
| Algorithm | Principle | Best Use Case | Computational Load |
|---|---|---|---|
| Frame Averaging | Temporal averaging of multiple frames | Basic noise reduction for static samples | Low |
| NREA (Noise Reduction by Ensemble Averaging) | Advanced ensemble averaging for sub-noise signals | Ultra-low-light bioluminescence/fluorescence | Medium (PC-based analysis) |
| VLight | Single-parameter brightness boosting for video | Real-time low-light video enhancement | Very Low (runs on smartphone in real-time) |
Experimental Protocols
Protocol 1: Implementing the NREA Algorithm for Low-Light Detection
This protocol is adapted from a study that successfully detected bioluminescence from bacterial reporters [4].
Hardware Setup:
- Place the sample (e.g., in a 12 x 75 mm glass tube) in a 3D-printed, light-tight chamber.
- For optimal photon collection, line the chamber with a diffusive reflection polymer film.
- Position a plano-convex lens (f=25 mm, diameter=10 mm) between the sample and the smartphone camera.
- Secure the smartphone to image the sample through the lens.
Image Acquisition:
- Use a camera application (e.g., FV-5 for Android) that allows full manual control.
- Set the ISO to a medium value (e.g., 400-800) to avoid excessive noise amplification.
- Maximize the exposure time (e.g., 60-180 seconds), ensuring the sample remains perfectly stationary.
- Capture a sequence of at least 5-10 images in this configuration.
Software Processing (NREA Algorithm):
- Transfer the image set to a computer for processing using software like MATLAB or Python.
- The core of the NREA algorithm involves calculating the mean pixel value across the image stack for each corresponding pixel location, but with a specialized formulation that effectively cancels noise when the signal is minimal.
- As reported, processing a set of five 480x640 pixel images takes approximately 0.15 seconds on a standard PC (Intel i5, 8 GB RAM), making it highly efficient for post-processing.
Protocol 2: Real-Time Low-Light Video Enhancement with VLight
This protocol enables real-time enhancement for video-based experiments [36].
Algorithm Deployment:
- Integrate the VLight algorithm into a custom smartphone application. The algorithm is designed for low complexity and can be implemented using standard mobile development frameworks.
- The algorithm acts as a post-processing step on the video feed after the phone's ISP.
Real-Time Operation:
- The app provides a live video preview with an overlay showing the average intensity within a user-defined Region of Interest (ROI).
- VLight uses a single tuning parameter, allowing researchers to easily fine-tune the level of brightness enhancement in real-time to adapt to specific experimental lighting conditions.
- The system is capable of processing 4K resolution video at up to 67 FPS locally on the smartphone, providing immediate feedback.
Experimental Workflow and Signaling Pathways
Low-Light Fluorescence Detection Workflow
The Scientist's Toolkit: Research Reagent Solutions
Table 3: Essential Materials for Smartphone-Based Fluorescence Detection
| Item | Function/Application | Example/Note |
|---|---|---|
| Fluorescent Reporters | Label target analytes or biological structures for detection. | FITC, Protoporphyrin-IX (PpIX), DsRed, mCherry [3] [1] [51]. |
| Bioluminescent Reporters | Self-photon generating biological sensors for ultra-low-light detection. | Genetically modified Pseudomonas fluorescens M3A [4]. |
| DNA Origami Structures | Nanoscale scaffolds for precise single-molecule assays and super-resolution imaging. | Used as standards and for digital bioassays (e.g., Ebola RNA detection) [54]. |
| Topical Staining Dyes | For direct nuclear staining and visualization of cellular details in fresh tissue. | Acridine orange, proflavine, PARPi-FL (tumor-specific dye) [55]. |
| Emission Filters | Spectrally select fluorescence signal while blocking excitation light. | Longpass filters (e.g., >515 nm for FITC); critical for SNR [4] [51] [54]. |
| 3D-Printed Enclosure | Provides a light-tight environment, precise component alignment, and portability. | Custom-designed chambers can incorporate diffusive reflectors to enhance signal [4] [3]. |
FAQ: Optimizing Your Smartphone Setup for Low-Light Fluorescence Detection
Q1: What is the most effective type of reflector to use inside a sample chamber to maximize photon collection?
Research indicates that a diffusive reflection polymer film is the most effective for enhancing signal in a smartphone-based detection chamber. In comparative testing, this material provided a three-fold enhancement in both maximum signal intensity and the illuminated area compared to the baseline chamber material. A first-surface mirror provided a slight improvement, while standard ABS plastic performed the poorest [4].
Q2: Can adding a simple lens to my smartphone setup significantly improve low-light sensitivity?
Yes, integrating a simple piano-convex lens (e.g., with a focal length of 25 mm and diameter of 10 mm) between the sample and the smartphone camera can dramatically increase light collection. One study demonstrated that this addition increased the detected signal by up to 17 times in low-light regions, significantly lowering the detection limit [4].
Q3: My fluorescence images are too dim. What are the most critical smartphone camera settings to adjust?
For low-light fluorescence detection, you must manually control your smartphone's camera settings. The most critical adjustments are [4] [35]:
- Exposure Time: Use the maximum possible exposure time (e.g., 15, 30, or 60 seconds) to allow the sensor to collect more photons over time.
- ISO: Increase the ISO setting to make the sensor more sensitive to light, but be aware that very high ISO values can introduce image noise.
- File Format: Shoot in RAW format (if supported) to retain the maximum amount of data from the sensor, which allows for better post-processing and noise reduction [35].
Q4: How can I reduce image noise when detecting very weak luminescent signals?
Beyond increasing exposure time, you can employ computational algorithms. The Noise Reduction by Ensemble Averaging (NREA) algorithm, for instance, captures a series of images and processes them to effectively reduce random noise while preserving the desired signal. This method can improve the signal-to-noise ratio (SNR) by up to four times compared to simple image accumulation [4].
Experimental Protocols for System Optimization
Protocol 1: Evaluating Reflector Materials for Chamber Design
This protocol is used to quantitatively compare the photon collection efficiency of different chamber lining materials [4].
- Chamber Fabrication: Design and 3D-print a light-tight sample chamber that holds your sample vial and smartphone in a fixed geometry.
- Material Testing: Prepare identical chambers lined with different reflector materials:
- Diffusive reflection polymer film
- 4-6λ first-surface mirror
- ABS plastic (control)
- Light Source: Place a stable, low-intensity light source (e.g., a green LED) inside the sample holder to simulate a luminescent sample.
- Data Acquisition: For each chamber type, use your smartphone camera with fixed settings (ISO, exposure) to capture an image of the light signal.
- Analysis: Measure the maximum pixel intensity and the total area of pixels above a background threshold. The material that produces the highest values offers the best photon collection efficiency.
Protocol 2: Implementing the NREA Algorithm for Noise Reduction
This methodology details the process for using computational averaging to enhance signal quality [4].
- Image Capture: With the sample in place and the camera stabilized on a tripod, capture a sequence of images (e.g., 5-10 frames) using identical camera settings.
- Algorithm Application: Process the image set using the NREA algorithm. The algorithm works by aligning the images and performing pixel-wise averaging, which reinforces the consistent signal and cancels out random noise.
- Performance Comparison: Compare the Signal-to-Noise Ratio (SNR) of the final processed image against a single frame or an image created by simple accumulation. The NREA-processed image should show a significantly cleaner signal.
Quantitative Performance Data
Table 1: Performance Comparison of Reflector Materials in a Smartphone Detection Chamber [4]
| Reflector Material | Relative Maximum Intensity | Relative Illuminated Area | Measured Output (nW) |
|---|---|---|---|
| Diffusive Film | 3.0x | 3.0x | 678 nW |
| First-Surface Mirror | Slight Enhancement | Slight Enhancement | 200 nW |
| ABS Plastic (Control) | 1.0x (Baseline) | 1.0x (Baseline) | 46 nW |
Table 2: Smartphone Camera Performance in Low-Light Bioluminescence Detection [4]
| Smartphone Model | Key Setting for Low Light | Approx. Detection Limit (Photons/s) | Key Finding |
|---|---|---|---|
| OnePlus One (Android) | 60s exposure, NREA processing | ~10⁷ | Best-performing phone; detected ~10⁶ CFU/mL of P. fluorescens M3A |
| iPhone 5S (iOS) | 60s exposure, NREA processing | ~10⁷ | Matched the low-light performance of the top Android candidate |
| LG G2 (Android) | Standardized test settings | ~10⁸ | Top performer in standardized test, but limited by exposure time |
Experimental Setup and Workflow
The following diagram illustrates the logical workflow for optimizing photon collection and detection in a smartphone-based system.
The following diagram shows a typical optical path configuration for a smartphone-based fluorescence detection system, highlighting key components.
The Scientist's Toolkit: Essential Research Reagents & Materials
Table 3: Key Reagents and Materials for Smartphone-Based Fluorescence Detection
| Item | Function / Application | Example / Specification |
|---|---|---|
| Fluorophores | Fluorescent dyes that absorb excitation light and re-emit at a longer wavelength; used to label targets. | FITC, ATTO 542, ATTO 647N [10] [51]. |
| DNA Origami Structures | Nanoscale scaffolds used as standards to validate single-molecule detection sensitivity and precision [10]. | 60x52 nm 2-layer sheet (2LS) with attached fluorophores [10]. |
| Emission Filter | A critical optical filter that blocks scattered excitation light while transmitting the desired fluorescence signal to the sensor [56] [57]. | Longpass or bandpass filter matched to the fluorophore's emission peak (e.g., 515 nm LP for FITC) [56] [51]. |
| Diffusive Reflection Film | A material used to line detection chambers, scattering emitted photons toward the camera sensor to enhance signal collection [4]. | Diffusive reflection polymer film [4]. |
| Antifading Reagents | Chemicals added to samples to reduce photobleaching, preserving fluorescence signal during prolonged exposure [58]. | Commercial antifading reagents used to maintain FITC signal integrity [58]. |
Selecting and Engineering Fluorophores for Enhanced Brightness and Stability
Frequently Asked Questions (FAQs)
1. What are the key molecular strategies to improve fluorophore brightness? Brightness is a product of a dye's molar extinction coefficient (ε) and its fluorescence quantum yield (Φ). [59] Key chemical strategies to enhance these properties include:
- Scaffold Rigidification: Reducing the flexibility of the fluorophore's molecular structure to minimize non-radiative decay pathways, thereby increasing the quantum yield. [60]
- TICT Inhibition: The twisted intramolecular charge transfer (TICT) state is a major non-radiative decay pathway. Replacing traditional N,N-dimethylamino groups with four-membered azetidine rings restricts molecular twisting, dramatically increasing quantum yield and photostability without altering spectral properties significantly. [61]
- Improving Water Solubility: Adding hydrophilic groups (e.g., sulfonation, PEGylation) prevents dye aggregation in aqueous environments, which can quench fluorescence and reduce observed brightness. [60] [59]
2. My fluorescence signal is weak when using a smartphone camera. What can I do? Maximizing signal detection on smartphone cameras involves both sample and software optimization:
- Maximize Exposure Time: Use the maximum allowable exposure time in your camera application to collect more photons. [4]
- Utilize Noise-Reduction Algorithms: Implement computational techniques like the Noise Reduction by Ensemble Averaging (NREA) algorithm, which can significantly improve the signal-to-noise ratio (SNR) for low-light signals without requiring hardware changes. [4]
- Optimize the Optical Chamber: Use a light-tight sample holder lined with diffusive reflection film (e.g., polymer film) to efficiently capture and reflect radially emitted photons toward the camera sensor. [4]
3. How can I reduce photobleaching in live-cell imaging? Photobleaching is the irreversible destruction of a fluorophore under illumination. [59] To mitigate it:
- Choose Photostable Dyes: Opt for engineered dyes like the Janelia Fluor (JF) series, ATTO dyes, or Alexa Fluor dyes, which incorporate structural rigidification for enhanced resistance to bleaching. [61] [59]
- Minimize Illumination: Use the lowest light intensity and shortest exposure time necessary to detect a signal. Employ shutters to illuminate the sample only during image acquisition. [25]
- Consider the Imaging Media: The presence of molecular oxygen can accelerate photobleaching. Using oxygen-scavenging systems in the mounting media can prolong fluorophore life. [62]
4. How do I select fluorophores for multiplexed imaging to minimize bleed-through? Selecting fluorophores for multiplexing requires careful spectral matching to your instrument and each other.
- Use Computational Tools: Leverage open-source software tools (e.g., FPselection) that use algorithms to select an optimal panel of fluorophores for a given instrument configuration, maximizing signal in each channel while minimizing spectral bleed-through. [63]
- Check Spectral Overlap: Ensure that the emission spectrum of one dye has minimal overlap with the detection channel of another. Dyes with large Stokes shifts are advantageous. [63] [59]
- Prioritize Brightest Dyes for Low-Abundance Targets: Assign the brightest fluorophores to the least abundant cellular targets to ensure all signals are detectable above background. [59]
Troubleshooting Guides
Problem: Low Signal-to-Noise Ratio in Smartphone-Based Detection
Potential Causes and Solutions:
Cause: Insufficient photon collection due to suboptimal camera settings.
- Solution: Fine-tune acquisition settings on the smartphone camera app. Use a manual/pro mode to maximize exposure time and increase ISO sensitivity gradually. Always check the live histogram to ensure you are not saturating the pixels (clipping highlights). [25]
Cause: High background noise overwhelming a weak fluorescent signal.
- Solution:
- Computational Noise Reduction: Apply the NREA algorithm. Capture a series of images and use software to perform ensemble averaging, which reduces random noise while preserving the true signal. [4]
- Optical Improvement: Incorporate a simple plano-convex collection lens between the sample and the smartphone camera. This can increase signal capture by up to 17 times. [4]
- Solution:
Cause: Low brightness of the fluorophore in an aqueous environment.
Problem: Rapid Photobleaching During Time-Lapse Imaging
Potential Causes and Solutions:
Cause: Inherently low photostability of the fluorophore.
- Solution: Switch to fluorophores engineered for high photostability. A prime example is replacing tetramethylrhodamine (TMR) with its azetidine-derived counterpart, Janelia Fluor 549 (JF549), which shows a marked increase in both photon output and survival time under illumination. [61]
Cause: Excessive illumination intensity or duration.
- Solution: Implement a gentler imaging regimen. Use lower excitation light intensity and couple it with longer exposure times if possible. Always close the fluorescence shutter between image acquisitions to minimize total light exposure. [25]
Cause: Chemical degradation from environmental factors.
- Solution: Be aware that some dyes, like Cy5, are susceptible to degradation by atmospheric ozone. Use air filters or sealed imaging chambers to protect samples. [59]
Quantitative Data on Fluorophore Properties
Table 1: Photophysical Properties of Selected Fluorophores and Engineered Counterparts
| Dye Name | Core Structure | Extinction Coefficient (ε) [M⁻¹cm⁻¹] | Quantum Yield (Φ) | Relative Brightness (ε × Φ) | Key Engineering Feature |
|---|---|---|---|---|---|
| Rhodamine 110 [61] | Rhodamine | ~76,000 | 0.88 | ~67,000 | Baseline, unalkylated |
| Tetramethylrhodamine (TMR) [61] | Rhodamine | ~78,000 | 0.41 | ~32,000 | Traditional N,N-dimethyl |
| JF549 [61] | Rhodamine | ~102,000 | 0.88 | ~90,000 | Azetidine ring (TICT inhibition) |
| Rhodol [61] | Rhodol | - | - | - | Azetidine ring (TICT inhibition) |
| Carborhodamine [61] | Carborhodamine | - | - | - | Azetidine ring (TICT inhibition) |
| 6-FAM [59] | Fluorescein | ~75,000 | ~0.90 | ~67,500 | High QY, but pH sensitive |
| Cy3 [59] | Cyanine | ~136,000 | ~0.15 | ~20,400 | High ε, but low QY in water |
| ATTO 655 [59] | Phenoxazine | - | - | - | High photostability, far-red emission |
Table 2: Smartphone Camera Performance for Low-Light Detection
| Smartphone Model | Maximum Low-Light Detection (Photons/s) | Key Enabling Factor(s) | Reference |
|---|---|---|---|
| OnePlus One (Android) | ~10⁷ | 180s integration time + NREA algorithm [4] | Scientific Reports (2017) [4] |
| iPhone 5S (iOS) | ~10⁷ | 60s exposure + NREA algorithm [4] | Scientific Reports (2017) [4] |
| Various (Galaxy S4, Note 3, LG G2) | ~10⁸ (with lens) | Use of a plano-convex collection lens [4] | Scientific Reports (2017) [4] |
| Modern Smartphones (Theoretical) | - | VLight algorithm (67 FPS for 4K video) [36] | Springer Journal (2024) [36] |
Experimental Protocols
Protocol 1: Quantifying Fluorophore Brightness and Photostability
This protocol is used to compare the performance of standard and engineered fluorophores. [61]
- Sample Preparation: Prepare aqueous solutions of the fluorophores (e.g., TMR and JF549) at an identical, low concentration (e.g., 1 µM) in a suitable buffer.
- Absorption Measurement: Use a spectrophotometer to measure the absorption spectrum. Record the peak wavelength (λmax) and the extinction coefficient (ε) at that wavelength.
- Emission Measurement: Use a fluorometer to measure the fluorescence emission spectrum. Excite at the λmax and record the peak emission wavelength (λem) and the integrated emission intensity.
- Quantum Yield (Φ) Determination: Calculate the quantum yield by comparing the integrated fluorescence intensity of the sample to that of a standard dye with a known quantum yield (e.g., Rhodamine 110 in water, Φ = 0.88). [61]
- Photostability Assay: Illuminate the sample continuously with a high-power LED or laser at the excitation wavelength while recording the fluorescence emission over time. Plot the normalized fluorescence intensity versus time to determine the half-life of the signal.
Protocol 2: Smartphone-Based Detection of Low-Level Luminescence
This protocol outlines a method for detecting weak bioluminescent or fluorescent signals using a smartphone. [4]
- Hardware Setup:
- Fabricate a 3D-printed, light-tight cradle that holds the smartphone and a standard sample tube (e.g., 12 x 75 mm glass tube).
- Line the interior of the chamber with a diffusive reflection polymer film to maximize photon collection.
- Optionally, position a plano-convex lens (f=25 mm, diameter=10 mm) between the tube and the smartphone camera for signal enhancement.
- Software and Calibration:
- Install a camera application that allows manual control of exposure time (e.g., up to 60 seconds), ISO, and focus.
- Calibrate the system using a light-emitting diode (LED) of known intensity and neutral density (ND) filters.
- Image Acquisition:
- Place the luminescent sample in the chamber and seal it.
- Set the smartphone camera to the maximum practical exposure time (e.g., 60 seconds) and a low ISO to start.
- Capture an image in RAW format if possible.
- Image Processing (NREA Algorithm):
- Capture a series of multiple images (e.g., 5-10) of the same sample.
- Use software (e.g., MATLAB, Python) to align and process these images.
- For each pixel, perform an ensemble averaging. The final image is generated by taking the median or mean value for each pixel position across the image stack, which suppresses random noise.
Research Reagent Solutions
Table 3: Essential Reagents and Materials for Fluorophore Engineering and Low-Light Imaging
| Item | Function/Benefit | Example Use Case |
|---|---|---|
| Janelia Fluor (JF) Dyes [61] | Rhodamine-based dyes with azetidine rings for high quantum yield and photostability. | Live-cell single-molecule tracking and super-resolution microscopy. |
| HaloTag/SNAP-tag Systems [61] | Self-labeling tag proteins for specific, covalent labeling of intracellular proteins with synthetic dyes. | Genetic targeting of bright, engineered dyes to specific cellular structures. |
| PEGylated Dyes [59] | Fluorophores conjugated with polyethylene glycol (PEG) chains to enhance water solubility and reduce aggregation. | Improving fluorophore performance in aqueous buffers and cellular environments. |
| Sulfonated Dyes (e.g., Alexa Fluor) [59] | Dyes with sulfonate groups for increased hydrophilicity and reduced nonspecific binding. | Applications requiring low background, such as qPCR and in situ hybridization. |
| Noise Reduction Software (NREA) [4] | Algorithm to enhance signal-to-noise ratio in low-light images by ensemble averaging. | Enabling detection of weak bioluminescence signals with smartphone cameras. |
| VLight Algorithm [36] | A single-parameter, low-complexity algorithm for real-time low-light video enhancement on smartphones. | Boosting brightness of live video feeds in low-light conditions for mobile sensing. |
Visualized Workflows and Pathways
Mitigating Ambient Light Interference and Autofluorescence
Frequently Asked Questions (FAQs)
Q1: What are the primary sources of autofluorescence in biological imaging? Autofluorescence originates from two main categories: endogenous biological components and sample processing. Key endogenous sources include molecules like collagen, elastin, riboflavins, NADH, and the heme groups in red blood cells. Sample processing sources involve aldehyde fixatives (e.g., formalin, glutaraldehyde), some nitrocellulose membranes, and tissue culture media components like phenol red and fetal bovine serum (FBS) [64] [65].
Q2: How can I quickly check if my sample has problematic autofluorescence? The most straightforward method is to run an unlabeled control. Process your sample identically to your experimental ones, but omit the fluorophore-labeled antibody reagents. Any fluorescence you then detect can be attributed to autofluorescence from the sample or assay components, giving you a baseline for troubleshooting [64] [65].
Q3: My smartphone-based detection system is noisy in low light. What settings should I adjust? For low-light fluorescence detection, optimizing your smartphone's manual or "Pro" mode is crucial. The key is to balance increasing the signal while managing noise. Use a low ISO setting to reduce grain, a wide aperture (low f-number) to allow in more light, and a longer shutter speed (exposure time) to collect more photons. For video, specialized apps or algorithms like VLight can enable real-time enhancement at high frame rates [4] [36] [66].
Q4: What are the most effective experimental strategies to reduce autofluorescence? Several wet-lab strategies are highly effective:
- Fixation: Replace glutaraldehyde with paraformaldehyde or, where possible, use ice-cold organic solvents like ethanol or methanol [64].
- Remove Red Blood Cells: Lyse red blood cells in whole blood samples or perfuse tissues with PBS prior to fixation, as heme is a major source of autofluorescence [64].
- Clean Your Samples: Eliminate dead cells and debris through centrifugation or Ficoll gradients, as they are more autofluorescent than live cells [64].
- Use Autofluorescence Quenchers: Chemical treatments like sodium borohydride (for aldehyde-induced fluorescence) or commercial quenching kits (e.g., Vector TrueVIEW) can be applied to fixed samples [64] [67].
Q5: Are there computational methods to remove autofluorescence from images? Yes, several computational approaches exist:
- Image Subtraction: Capture an image of autofluorescence (from an unstained control) and subtract it from your experimental image, though this requires precise alignment [68].
- Spectral Unmixing: If you have spectral detection capabilities, you can computationally separate the signal of your fluorophore from the autofluorescence based on their distinct emission spectra [65].
- Advanced Algorithms: Machine learning methods, such as convolutional autoencoders (CAEs), can be trained on artifact-free images to detect and flag anomalies, including autofluorescence, in new images [69].
Q6: What advanced instrumentation techniques can separate signal from autofluorescence? Fluorescence Lifetime Imaging Microscopy (FLIM) is a powerful advanced technique. It does not rely on intensity alone but measures the nanosecond-scale time a fluorophore spends in the excited state. Since autofluorescence typically has a short lifetime (1-4 ns) and many synthetic fluorophores have longer lifetimes, FLIM can distinguish them even if their emission spectra overlap [67] [68]. High-speed FLIM systems combined with phasor analysis now make this feasible for higher-throughput applications [68].
Troubleshooting Guides
Problem 1: High Background Autofluorescence Obscuring Signal
| Step | Action | Principle & Expected Outcome |
|---|---|---|
| 1 | Run an unlabeled control sample. | Identify the level and spectral profile of autofluorescence. Provides a baseline [64] [65]. |
| 2 | Switch to fluorophores in the red/far-red spectrum (>620 nm). | Autofluorescence is often strongest in the blue-green spectrum. Moving to longer wavelengths avoids this background [64] [65]. |
| 3 | Treat sample with an autofluorescence quencher (e.g., sodium borohydride, Sudan Black B). | Chemically quenches the sources of autofluorescence, leading to a darker background and improved signal-to-noise ratio [64] [67]. |
| 4 | For fixed samples, consider photobleaching the autofluorescence before staining. | Uses high-intensity light to permanently bleach autofluorophores without (yet) affecting your specific label, which is added afterwards [65]. |
Problem 2: Low Signal-to-Noise Ratio in Smartphone-Based Detection
| Step | Action | Principle & Expected Outcome |
|---|---|---|
| 1 | Physically block all ambient light. Use a light-tight box or cradle. | Ensures the only light detected comes from your sample, not the environment [4]. |
| 2 | Optimize smartphone settings: Use a long exposure (shutter speed) and the lowest possible ISO. | Maximizes photon collection from the sample while minimizing electronic sensor noise [4] [66]. |
| 3 | Use a lens to efficiently collect and focus light from the sample onto the smartphone sensor. | Increases the number of photons from your sample that reach the detector, boosting the signal [4]. |
| 4 | Apply a computational noise-reduction algorithm (e.g., NREA) to a series of images. | Averaging multiple frames reduces random noise, enhancing the signal-to-noise ratio without sacrificing signal [4]. |
Table 1: Comparison of Autofluorescence Mitigation Techniques
| Technique | Key Metric/Performance | Best Use Case | Limitations |
|---|---|---|---|
| Long-Lived Fluorophores (e.g., ADOTA, ~15 ns) | Time-gating (10 ns delay) improves signal-to-background ratio ~7-fold, eliminates >96% of autofluorescence [67]. | Confocal imaging, single-molecule studies requiring high photon flux. | Requires time-resolved detection equipment (pulsed laser, TCSPC). |
| Smartphone with NREA Algorithm | Detected luminescence from ~106 CFU/mL bacteria, corresponding to ~107 photons/s with 180s integration [4]. | Portable, low-cost bioluminescence/fluorescence detection in resource-limited settings. | Limited by sensor sensitivity and optics compared to scientific cameras. |
| High-Speed FLIM with Phasor Analysis | Can separate signals with lifetime differences of ~1 ns; acquires >500 photons/pixel/second for real-time analysis [68]. | Quantitative immunofluorescence in highly autofluorescent tissues (e.g., liver, spleen). | High cost and complexity of specialized instrumentation. |
Table 2: Smartphone Camera Settings for Low-Light Fluorescence Detection
| Setting | Recommendation | Rationale |
|---|---|---|
| Shutter Speed/Exposure | Maximize (e.g., 15-60 seconds) [4]. | Allows the sensor to collect more photons from the weak fluorescent signal. |
| ISO | Keep as low as possible (e.g., 100-400) [66]. | Minimizes amplification of signal and noise, reducing grainy images. |
| Aperture | Use the widest available (lowest f-number). | Allows the maximum amount of light to enter the sensor. |
| Focus | Use manual focus if available. | Ensures the sample plane is sharply focused, as autofocus can struggle in low light. |
| Format | Capture in RAW if supported. | Retains more image data for post-processing and quantitative analysis [66]. |
Experimental Protocols
Protocol 1: Chemical Quenching of Aldehyde-Induced Autofluorescence with Sodium Borohydride
Purpose: To reduce autofluorescence caused by aldehyde-based fixatives like formalin and glutaraldehyde [64].
- Prepare Solution: Prepare a fresh 0.1% (w/v) solution of sodium borohydride (NaBH₄) in phosphate-buffered saline (PBS). Note: Prepare this in a fume hood as hydrogen gas is released.
- Wash Samples: After fixation and washing, incubate your samples (cells or tissue sections) in the NaBH₄ solution for 30 minutes at room temperature.
- Rinse Thoroughly: Wash the samples multiple times (3-5 times) with PBS to ensure all traces of NaBH₄ are removed.
- Proceed with Staining: Continue with your standard immunofluorescence or staining protocol.
Protocol 2: Smartphone-Based Low-Light Detection with NREA Algorithm
Purpose: To maximize the detection sensitivity of a smartphone for low-light luminescence signals and reduce noise [4].
- Hardware Setup: Place your sample (e.g., in a glass tube) within a 3D-printed, light-tight cradle. A plano-convex lens (f=25 mm) should be positioned between the sample and the smartphone camera to enhance light collection.
- Image Acquisition: Using a smartphone camera app that allows full manual control (e.g., FV-5), set a long exposure time (e.g., 15-60 seconds) and a low ISO. Capture a sequence of images of the luminescent sample.
- Noise Reduction Algorithm: Transfer images to a computer and process them using the Noise Reduction by Ensemble Averaging (NREA) algorithm. This involves:
- Aligning the sequence of images.
- For each pixel, averaging the intensity values across the image stack. This reinforces the consistent signal while averaging out random noise.
- Analysis: Use the processed image for quantitative analysis of the luminescent signal.
Experimental Workflow and Signaling Pathways
Autofluorescence Mitigation Workflow
The Scientist's Toolkit: Research Reagent Solutions
Table 3: Essential Reagents for Mitigating Autofluorescence
| Reagent/Solution | Function | Key Consideration |
|---|---|---|
| Sodium Borohydride (NaBH₄) | Reduces Schiff bases formed by aldehyde fixatives, quenching fixative-induced autofluorescence [64]. | Prepare fresh and use in a well-ventilated area (fume hood) due to hydrogen gas production. |
| Sudan Black B | A lipophilic dye that binds to and quenches autofluorescence from intracellular lipofuscin granules and other lipids [67] [68]. | Typically dissolved in 70% ethanol. Can be used on fixed tissues; may require optimization of concentration to avoid quenching target signal. |
| Vector TrueVIEW Autofluorescence Quenching Kit | Commercial kit that binds and effectively quenches autofluorescent elements in various sample types [64]. | Optimized for specific tissues like kidney, spleen, and pancreas. Follow manufacturer's protocol. |
| Phenol Red-Free Medium | For live-cell imaging; removes the fluorescent pH indicator phenol red from culture media, reducing background [65]. | Essential for live-cell low-light fluorescence imaging. Ensure cells are healthy in this medium. |
| Far-Red Fluorophores (e.g., DyLight 649) | Synthetic dyes whose excitation/emission spectra are in the red/far-red region, away from the peak of common autofluorescence [64] [65]. | Ensure your detection system (microscope or smartphone filter) is sensitive in this wavelength range. |
| Long-Lifetime Probes (e.g., ADOTA dyes) | Fluorophores with long fluorescence lifetimes (~15-20 ns) enabling separation from autofluorescence via time-gated detection or FLIM [67]. | Requires specialized instrumentation for time-resolved or lifetime-based detection. |
Benchmarking Performance and Establishing Analytical Rigor
Calibration Methods Using LEDs and Neutral Density Filters
Frequently Asked Questions (FAQs)
1. What is the primary function of a Neutral Density (ND) filter in a low-light fluorescence setup? ND filters are optical elements that reduce the intensity of light entering the camera sensor without altering its spectral composition. In low-light fluorescence detection, they are used during calibration to attenuate a reference LED light source to a level comparable to the weak emission from your sample, allowing for accurate sensor characterization and preventing saturation during calibration [4] [70] [71].
2. My smartphone camera's auto-exposure keeps changing during measurements, skewing my data. How can I prevent this? You must bypass the phone's automated settings. Use a professional camera application that provides manual control over key parameters [72]. Lock in the following settings for the duration of your experiment:
- ISO: Set to a fixed, mid-to-high value (e.g., 400-800) and avoid the auto setting.
- Shutter Speed: Use the slowest possible shutter speed that does not introduce motion blur from your setup.
- Exposure Value (EV): Keep this setting constant.
- Focus: Manually set and lock the focus on your sample plane.
- File Format: Use RAW file formats (like Apple ProRAW) where possible to minimize in-camera processing, though be aware that some proprietary "RAW" formats may still apply processing [73].
3. Why is my fluorescence signal indistinguishable from the background noise, even with long exposure times? This is a common challenge due to the inherently weak nature of autofluorescence and bioluminescence signals [74]. Solutions include:
- Signal Averaging: Implement a computational noise reduction algorithm, like the Noise Reduction by Ensemble Averaging (NREA) used in BAQS, which integrates multiple image frames to enhance the signal-to-noise ratio (SNR) [4].
- Optical Collection: Improve photon collection efficiency by using a lens to focus emitted light onto the sensor and employing a light-tight sample chamber lined with a diffusive reflective material (e.g., polymer film) to redirect scattered photons toward the camera [4].
- Camera Selection: Different smartphone models have varying low-light capabilities. Research has shown that some Android phones (e.g., OnePlus One) may allow for longer manual exposure times than others, which can lower the detection limit [4].
4. Which color space should I use for quantitative analysis of colorimetric or fluorescence intensity? For quantitative analysis that is resilient to minor changes in ambient lighting, the CIELAB color space (specifically the a* and b* chromatic coordinates) is highly recommended. Research shows that models based on standard RGB (sRGB) are highly sensitive to illumination changes, whereas the CIELAB space exhibits inherent resistance to these variations, providing more reliable and reproducible data [75].
Troubleshooting Guides
Problem: Inconsistent Calibration Measurements Between Sessions
Symptoms: Results from daily calibration runs with a reference LED vary significantly, making it impossible to establish a stable standard curve.
| Potential Cause | Solution |
|---|---|
| Ambient Light Leakage | Inspect the sample chamber for light leaks. Use a 3D-printed, light-tight enclosure and conduct calibration in a darkroom. Verify seals around the smartphone cradle and sample holder [4]. |
| Unstable LED Light Source | Power the LED with a stable, regulated power supply instead of a battery to prevent intensity drift from voltage drop. Use an LED driven by a single-chip microcontroller for consistent output [74]. |
| Insufficient Sensor Warm-up Time | Allow the smartphone and the entire electronic system to power on and stabilize for 15-30 minutes before taking calibration measurements. This allows the CMOS sensor's temperature to stabilize, reducing thermal noise [76]. |
| Variable Contact Pressure (for contact measurements) | Integrate a pressure sensor into your sample stage to monitor and ensure consistent contact force between the sensor and the sample, as pressure can alter optical properties and the detected signal [74]. |
Problem: Poor Signal-to-Noise Ratio in Low-Light Detection
Symptoms: The resulting images are grainy, and the fluorescence signal from the sample is too weak to be quantified against the background.
| Action Item | Protocol and Rationale |
|---|---|
| Optimize Optical Path | Use a plano-convex lens (e.g., f=25 mm) positioned between the sample and smartphone camera. This can increase collected light intensity by up to 17 times. Line the sample chamber with a diffusive reflective film (e.g., Spectralon) to enhance photon capture efficiency [4]. |
| Apply Computational Noise Reduction | Capture a series of images (e.g., 5-10 frames) of the sample. Process them using the Noise Reduction by Ensemble Averaging (NREA) algorithm. This method reduces random noise while preserving the true signal, potentially improving the SNR by a factor of four compared to simple image accumulation [4]. |
| Validate Camera Capabilities | Test your smartphone's low-light limit. Using a calibrated ND filter set, find the optical density (OD) at which the camera can no longer distinguish the signal. Research indicates that some smartphones can detect light levels as low as ~106 photons/s (corresponding to single-digit pW of radiant flux) with long integration times [4]. |
| Utilize Post-Processing Enhancement | For video capture, employ a real-time enhancement algorithm like VLight, which can function as a custom brightness-boosting curve on the digital image post-capture, running at high frame rates even on smartphone hardware [36]. |
Experimental Protocols & Data Presentation
Key Experiment: Calibrating a Smartphone CMOS Sensor with an LED and ND Filters
Objective: To establish a quantitative relationship between the radiant flux of a light source and the pixel intensity value recorded by a smartphone camera.
Materials:
- Smartphone with manual camera control app (e.g., Camera FV-5, Moment)
- Stable LED light source (preferably with a narrow emission spectrum)
- Power supply for the LED (e.g., benchtop supply or microcontroller)
- Set of calibrated Neutral Density (ND) filters
- 3D-printed or custom-built light-tight sample chamber
- Lens (e.g., f=25 mm, diameter=10 mm) for light collection (optional)
Methodology:
- Setup Assembly: Place the LED and the smartphone securely inside the light-tight chamber. If using a lens, position it to focus light from the LED (or sample) plane onto the smartphone camera sensor.
- Camera Configuration: Open the manual camera app and set the following parameters to a fixed value: ISO (e.g., 400), Shutter Speed (e.g., 1 second), White Balance (e.g., Daylight), and Focus (set to manual and locked). Save images in RAW format if possible.
- Reference Measurement: Without any ND filter, capture an image of the powered LED. Ensure the image is not saturated.
- Attenuated Measurements: Place ND filters of known optical density (OD) in sequence between the LED and the camera. Capture an image for each OD level. A typical range for bioluminescence calibration is from OD 4 to OD 8 [4].
- Data Extraction: Transfer images to a computer for analysis. Use image processing software (e.g., ImageJ, MATLAB, Python) to define a Region of Interest (ROI) and calculate the average pixel intensity for each image.
- Data Analysis: Plot the measured average pixel intensity (or Relative Light Units - RLU/pixel) against the known attenuated radiant flux or photon count.
Data Analysis and Expected Results: The table below summarizes hypothetical data from a smartphone sensor calibration, demonstrating the expected trend.
Table 1: Example Data from Smartphone Sensor Calibration
| ND Filter OD | Estimated Radiant Flux (pW) | Estimated Photon Count (photons/s) | Measured Avg. Pixel Intensity (RLU/pixel) |
|---|---|---|---|
| 0.0 | 10000 | 2.5 x 10¹⁰ | 24500 (Saturated) |
| 3.0 | 10.0 | 2.5 x 10⁷ | 1800 |
| 4.0 | 1.00 | 2.5 x 10⁶ | 245 |
| 5.0 | 0.10 | 2.5 x 10⁵ | 32 |
| 6.0 | 0.01 | 2.5 x 10⁴ | 5.5 |
| 7.0 | 0.001 | 2.5 x 10³ | 1.1 (Near noise floor) |
The data should show a strong linear correlation between the log of the radiant flux and the pixel intensity across a specific operational range. The point where the signal merges with the background noise defines the detection limit of your system.
Workflow Visualization
The Scientist's Toolkit: Essential Research Reagent Solutions
Table 2: Key Materials for Smartphone-Based Low-Light Detection
| Item | Function / Explanation |
|---|---|
| Neutral Density (ND) Filter Set | A set of filters with precisely known Optical Density (OD) values. They are used to quantitatively attenuate a reference LED light source during calibration to simulate the low light levels of fluorescence or bioluminescence [4]. |
| Stable LED Source | A light-emitting diode with a stable output, used as a calibrated reference standard. It should be powered by a regulated power supply to prevent intensity drift over time [74]. |
| Nitrogen-Doped Carbon Dots (CDs) | Used as fluorescent labels in bioassays. They can be synthesized via a microwave-assisted method and conjugated with antibodies for specific biomarker detection (e.g., SHBG for PCOS), providing a strong, stable fluorescence signal [77]. |
| Diffusive Reflective Film | A highly reflective material (e.g., polymer-based film) used to line the interior of the sample chamber. It enhances photon collection efficiency by scattering and redirecting emitted light that would otherwise be lost toward the smartphone camera sensor [4]. |
| 3D-Printed Cradle/Chamber | A custom-designed, light-tight enclosure that houses the smartphone, sample, and optical components. It ensures reproducible positioning and blocks ambient light, which is critical for low-light signal integrity [4] [77]. |
| Noise Reduction Algorithm | A computational method, such as Noise Reduction by Ensemble Averaging (NREA), which processes multiple image frames to suppress random sensor noise, thereby enhancing the signal-to-noise ratio for ultra-low-light detection [4]. |
Determining Limit of Detection (LOD) and Linear Dynamic Range
This guide provides technical support for researchers optimizing smartphone-based systems for low-light fluorescence detection. Accurately determining the Limit of Detection (LOD) and Linear Dynamic Range is fundamental for developing quantitative analytical methods suitable for point-of-care testing, environmental monitoring, and diagnostic applications. The following sections address common experimental challenges and detailed protocols to ensure your smartphone-based detection system yields reliable, publication-ready data.
Frequently Asked Questions (FAQs)
1. What is the difference between Linear Dynamic Range and LOD, and why are both critical for my assay?
The Linear Dynamic Range is the concentration span over which your assay's signal response has a linear relationship with the analyte concentration. Accurate quantification is only valid within this range [78]. The Limit of Detection (LOD) is the lowest analyte concentration that can be reliably distinguished from a blank sample. It represents the ultimate sensitivity of your assay. A wide linear dynamic range ensures you can quantify analytes across their natural concentration variations, while a low LOD ensures you can detect trace amounts.
2. My smartphone camera saturates on bright bands but can't detect faint ones. How can I improve this?
This is a classic problem of limited dynamic range. You can address it by:
- Adjusting Camera Settings: Manually control the integration time (exposure), gain (ISO), and aperture if possible. Reduce exposure/gain to prevent saturation of strong signals and increase them to detect weaker signals, though this may require multiple captures [79].
- Using a Wider Dynamic Range Detector: Research-grade instruments offer a linear dynamic range of up to 6 logs, which far exceeds the capabilities of a standard smartphone camera detector [78]. For smartphone-based systems, employing a reference standard can help correct for detector limitations.
- Optimizing Sample Loading: Perform a serial dilution of your sample to determine the optimal amount that falls within the linear range of your detection system [78].
3. The background in my fluorescence images is too high, affecting the LOD. How can I reduce it?
High background severely impacts the signal-to-noise ratio and LOD.
- Use Near-Infrared (NIR) Fluorescence: Membranes and biological proteins autofluoresce strongly in the visible spectrum. Using NIR fluorescent dyes dramatically lowers this autofluorescence, increasing sensitivity [78].
- Employ Total Internal Reflection (TIR): A smartphone microscope with a TIR configuration illuminates only a very thin layer near the sample surface, drastically reducing background signal from the bulk solution and enabling single-molecule detection [54].
- Optimize Your Wavelength: The CIELAB color space (specifically the a* and b* chromatic coordinates) exhibits inherent resistance to illumination changes, which can improve reliability over standard RGB space [75].
4. Can smartphone cameras truly achieve single-molecule detection sensitivity?
Yes. Recent advancements have demonstrated that portable, low-cost smartphone-based fluorescence microscopes can detect single molecules directly, without the need for signal amplification. This is achieved through careful optical design, including laser-based TIR illumination and sensitive CMOS sensors, providing a signal-to-noise ratio sufficient for single-molecule imaging [54].
Troubleshooting Guides
Problem: Low Signal-to-Noise Ratio in Low-Light Fluorescence
Symptoms: Faint target signals are indistinguishable from image background noise, leading to poor LOD.
Solutions:
- Camera Setting Adjustments:
- Increase Integration Time: Allow the sensor to collect light for a longer duration.
- Carefully Increase Gain (ISO): Amplify the signal, but be aware this also amplifies noise.
- Use a Post-Processing Algorithm: Implement a real-time low-light enhancement algorithm like VLight, which can boost perceptual brightness at high frame rates directly on the smartphone [36].
- Sample Preparation Enhancements:
- Utilize Freeze Concentration: This technique can preconcentrate your analyte, improving the LOD by a factor of 30 or more [80].
- Employ Bright Fluorophores: Use fluorescent labels with high quantum yield and extinction coefficients, such as phycoerythrin (PE) or fluorescent microbeads, which offer intense and homogeneous single-fluorophore brightness [79].
- Implement a Ratiometric Probe: Use a dual-emission probe where one signal acts as an internal reference. This self-calibrating system corrects for variations in probe concentration and environmental factors, improving reliability [81].
Problem: Non-Linear or Saturated Calibration Curves
Symptoms: Signal intensity plateaus at higher analyte concentrations, preventing accurate quantification.
Solutions:
- Identify the Source of Saturation:
- Detector Saturation: The signal exceeds the maximum recordable intensity of the camera's sensor. Solution: Reduce camera exposure time or gain [78].
- Membrane Saturation: The solid support (e.g., nitrocellulose membrane) has reached its maximum protein-binding capacity. Solution: Reduce the amount of sample protein loaded [78].
- Characterize Your System's Linear Range:
- Run a Serial Dilution: Prepare and analyze a two-fold serial dilution of your sample.
- Plot and Inspect the Calibration Curve: The linear range is the concentration span where the signal vs. concentration plot is straight. Only quantify data within this range [78].
Experimental Protocols
Protocol 1: Establishing a Linear Dynamic Range for a Smartphone-Based Fluorescence Assay
Purpose: To empirically determine the concentration range over which your assay provides a linear response.
Materials:
- Smartphone-based detection setup (with controlled lighting or housing)
- Sample with analyte of interest at known, high concentration
- Serial dilution buffers
- Image analysis software (e.g., ImageJ or a custom smartphone app)
Method:
- Prepare Serial Dilutions: Create a series of sample solutions with concentrations spanning at least 3 orders of magnitude (e.g., 0.1 µM, 1 µM, 10 µM, 100 µM).
- Image Acquisition: Under consistent and optimized camera settings (fixed exposure, ISO, and white balance), capture images of each sample.
- Image Analysis: For each image, extract the mean signal intensity (e.g., in the green channel) from a defined Region of Interest (ROI).
- Data Analysis & Plotting:
- Plot the mean signal intensity (y-axis) against the analyte concentration (x-axis).
- Perform a linear regression on the data points that form a straight line.
- The Linear Dynamic Range is the concentration interval between the lowest and highest points that maintain a high coefficient of determination (R² > 0.99).
Protocol 2: Calculating the Limit of Detection (LOD)
Purpose: To determine the lowest concentration of analyte that can be reliably detected by your assay.
Materials:
- Data from the linear dynamic range experiment (Protocol 1)
- Blank sample (contains all components except the analyte)
- Statistical software or spreadsheet
Method:
- Measure Blank Signal: Analyze multiple replicates (n ≥ 10) of the blank sample to establish the baseline signal.
- Calculate Standard Deviation: Compute the standard deviation (σ) of the blank measurements.
- Generate Calibration Curve: Using the linear portion of your data from Protocol 1, determine the slope (S) of the calibration curve.
- Compute LOD: Use the formula: LOD = 3.3 × σ / S. This represents the concentration at which the signal is 3.3 standard deviations above the mean blank signal.
Data Presentation
Table 1: Performance Comparison of Fluorescent Labels for Ultrasensitive Detection
This table compares different fluorophore classes based on data from single-molecule imaging studies, critical for selecting the right label to achieve a low LOD [79].
| Fluorophore Class | Example | Relative Brightness (Ensemble) | Single-Molecule Intensity Stability | Key Advantages/Disadvantages |
|---|---|---|---|---|
| Organic Dye | Alexa Fluor 594 | 1.0 | Low - Intensity overlaps with background. | Lower cost; prone to photobleaching. |
| Quantum Dot | Qdot 605 | 6.7 | Medium - Count depends on threshold. | High stability; broad excitation. |
| Fluorescent Protein | Phycoerythrin (PE) | 24.0 | High - Stable count over broad threshold. | Extremely bright & homogeneous; less photostable. |
| Fluorescent Microbead | FluoSphere | 780.0 | Medium - Dispersed intensities. | Highest brightness; large size may cause steric issues. |
Table 2: Key Reagent Solutions for Smartphone Fluorescence Sensing
This table lists essential materials and reagents used in advanced smartphone-based fluorescence detection platforms [81] [54] [80].
| Research Reagent | Function in the Experiment |
|---|---|
| Phycoerythrin (PE) | A bright, homogeneous fluorescent protein label ideal for single-molecule detection and calibration due to its intense signal [79]. |
| Ratiometric Probe (e.g., Fe-MIL-88NH2/Au NCs) | A dual-emission nanosensor where one element (Fe-MIL-88NH2) serves as an internal reference, enabling self-calibration and correction for environmental noise [81]. |
| DNA Origami Structures | Nanoscale scaffolds used as fluorescence standards to benchmark microscope performance and implement digital bioassays like DNA-PAINT [54]. |
| Glycerol with Internal Reference (Mn/In) | Used in freeze concentration to stabilize the frozen sample and, via a double-internal-reference method, to simultaneously determine the concentration rate and target element concentration [80]. |
| Covalent Organic Frameworks (COFs) | Nanoplatforms like COFML-Tp used as fluorescent probes for detecting specific molecules (e.g., pesticides) via mechanisms like the Inner Filter Effect (IFE) [82]. |
Quantitative Performance Comparison
The table below summarizes key performance metrics for smartphone-based detectors, traditional fluorometers, and photomultiplier tubes (PMTs), based on experimental data.
| Parameter | Smartphone-Based Detector | Traditional Fluorometer | Photomultiplier Tube (PMT) |
|---|---|---|---|
| Detector Type | CMOS sensor [4] | Typically PMT or CCD | Photomultiplier Tube [4] |
| Typical Detected Radiant Flux | ~107 photons/s (with algorithm and 180s integration) [4] | Varies, often similar to PMT range | 104 – 107 photons/s [4] |
| Limit of Detection (Example) | ~106 CFU/mL of P. fluorescens M3A [4] | Substance and setup dependent | Extremely low, high sensitivity [4] |
| Key Strengths | Portability, low cost, connectivity, on-site analysis [4] [13] | High sensitivity, well-established protocols | Highest sensitivity, single-photon detection capability [4] |
| Key Limitations | Lower native sensitivity, requires add-ons for best performance [4] [13] | Bulky, expensive, complex operation [4] [13] | Requires high-voltage circuitry, expensive, susceptible to magnetic fields [4] |
| Portability & Cost | High portability, low cost [13] | Low portability, high cost [13] | Low portability, high cost [4] |
Detailed Experimental Protocol: Smartphone-Based Low-Light Detection
This protocol is adapted from the BAQS (Bioluminescent-based Analyte Quantitation by Smartphone) method for detecting low-light bioluminescence [4].
Apparatus and Reagent Setup
- Smartphone Cradle: A 3D-printed, light-tight cradle houses the smartphone, sample tube, and optical components [4].
- Smartphone Selection: Use a model that allows manual control over exposure settings (e.g., shutter speed, ISO). In testing, the OnePlus One (Android) achieved the best results [4].
- Sample Holder: A chamber designed to hold a standard 12 × 75 mm glass test tube.
- Optical Components:
- Software: A commercial camera app that enables manual control (e.g., FV-5 for Android) and software for image processing (e.g., MATLAB).
Step-by-Step Procedure
- Assembly: Secure the smartphone, collection lens, and sample chamber within the 3D-printed cradle. Ensure the environment is light-tight.
- Sample Loading: Place the sample-containing glass tube into the chamber.
- Camera Configuration: Open the manual camera application and configure the settings for maximum low-light sensitivity:
- Shutter Speed: Set to the maximum possible value (e.g., 60 seconds) [4]. This long exposure time is critical for collecting enough photons.
- ISO: Set to a moderate level (e.g., 800). Avoid the highest ISO settings to minimize noise [50].
- Focus: Manually set focus to infinity or the plane of the sample.
- Exposure Value (EV): Set to 0 or a negative value to prevent automatic brightening that can amplify noise.
- White Balance: Set to a fixed preset (e.g., "Flash" or "Sunny") to prevent automatic color shifts [50].
- Image Acquisition: Capture a series of images (e.g., 5-10 frames) in rapid succession without moving the setup.
- Image Processing (Noise Reduction): Process the image stack using the Noise Reduction by Ensemble Averaging (NREA) algorithm [4].
- Principle: This algorithm averages the pixel values across the multiple captured images. Since random noise varies from frame to frame, it averages out, while the true signal from the sample remains constant and is enhanced.
- Output: The result is a single, processed image with a significantly improved Signal-to-Noise Ratio (SNR).
Troubleshooting Guide
| Problem | Possible Cause | Solution |
|---|---|---|
| No or Faint Signal | Insufficient light collection or scattering. | Implement wavefront shaping techniques (e.g., using a Spatial Light Modulator) to counteract scattering in tissue samples [83] [84]. Use a Bessel-Gauss (BG) beam for deeper penetration [83]. |
| Camera settings not optimized for low light. | Maximize shutter speed first, then use a moderate ISO. Use a stable mount or tripod to avoid blur during long exposures [4] [50]. | |
| Antibody concentration too low or not validated for application. | Perform an antibody titration to find the optimal concentration. Confirm the antibody is recommended for your specific application [26]. | |
| High Background Noise | Sample autofluorescence. | Include an unstained control. Use far-red fluorescent dyes (e.g., NIR-II) to avoid blue-range autofluorescence. Use autofluorescence quenchers [26] [85]. |
| Non-specific antibody binding or cross-reactivity. | Perform staining controls with secondary antibody alone. Use highly cross-adsorbed secondary antibodies [26]. | |
| High ISO setting on smartphone. | Lower the ISO setting and compensate by further increasing the shutter speed or improving light collection with a better lens/reflector [50]. | |
| Blurry Images | Camera shake during long exposure. | Use a smartphone tripod and a timer or remote shutter release. |
| Incorrect focus. | Use manual focus in the Pro mode of your camera app to ensure the sample plane is sharp [50]. | |
| Signal Bleaching | Fluorophore is photobleaching. | Use mounting medium with antifade. Choose photostable dyes (e.g., rhodamine-based) over those that bleach quickly (e.g., some blue dyes) [26]. |
Frequently Asked Questions (FAQs)
Q1: Can a smartphone camera really match the sensitivity of a traditional PMT? A1: For the most sensitive applications requiring single-photon counting, PMTs remain superior [4]. However, with optimized hardware (lenses, light-tight enclosures) and advanced signal processing algorithms (like NREA), smartphone cameras can detect radiant flux as low as single-digit picoWatts (pW), making them suitable for many bioluminescence and fluorescence assays previously dominated by PMTs [4] [13].
Q2: What are the most critical smartphone camera settings for low-light fluorescence detection? A2: The two most critical settings are shutter speed and ISO [4] [50].
- Shutter Speed: Prioritize using the longest possible exposure time (e.g., 15-60 seconds) to collect as many photons as possible.
- ISO: Use a moderate ISO (e.g., 400-800) to brighten the image without introducing excessive digital noise. Always use a stable mount for long exposures.
Q3: How can I improve the signal-to-noise ratio (SNR) without buying new hardware? A3: Employ computational methods. The Noise Reduction by Ensemble Averaging (NREA) algorithm is highly effective. By capturing and averaging multiple image frames, random noise is suppressed while the consistent signal is enhanced, significantly boosting SNR [4].
Q4: My target is deep within scattering tissue. Can smartphone imaging still work? A4: Yes, but it requires advanced techniques. Research shows that combining wavefront shaping (to correct for scattered light) with a Bessel-Gauss (BG) beam (which has self-healing properties) can significantly improve imaging depth, contrast, and signal strength in scattering media like biological tissue [83] [84].
Q5: What is the advantage of using ratiometric fluorescence with a smartphone? A5: Ratiometric fluorescence uses the ratio of intensities at two different wavelengths. This built-in calibration corrects for variations in sensor illumination, probe concentration, and environmental effects, leading to more reliable and quantitative results compared to single-wavelength readouts [13].
Research Reagent Solutions
| Reagent / Material | Function / Explanation |
|---|---|
| Bioluminescent Reporter Bacteria (e.g., P. fluorescens M3A) | Biological sensing element that emits photons (~490 nm) in response to specific analytes or environmental changes; used as a model system for detection limits [4]. |
| Carboxylate-Modified Fluorescent Microspheres | Synthetic fluorescent beads (e.g., 40 nm, 633/720 nm) used as stable and bright targets for method development and validation in imaging systems [83]. |
| Photostable Fluorophores (e.g., Rhodamine-based dyes) | Fluorescent tags with high resistance to photobleaching, crucial for obtaining stable signals during long exposure times required in smartphone microscopy [26]. |
| NIR-II Fluorescent Dyes | Fluorophores emitting in the second near-infrared window (1000-1700 nm); reduce tissue scattering and autofluorescence, enabling deeper and higher-contrast imaging in living tissues [85]. |
| TrueBlack Autofluorescence Quencher | A reagent used to suppress natural background fluorescence (autofluorescence) from tissues or cells, thereby improving the signal-to-noise ratio [26]. |
| Spatial Light Modulator (SLM) | An optical device used for wavefront shaping. It adjusts the phase and amplitude of light to counteract distortions caused by scattering media, restoring image clarity [83] [84]. |
| Axicon | A conical lens used to transform a standard Gaussian laser beam into a Bessel-Gauss (BG) beam, which offers greater depth penetration and self-healing properties for imaging through scattering samples [83]. |
Workflow Diagram: Smartphone-Based Fluorescence Detection
The diagram below illustrates the core workflow and logical structure for implementing a smartphone-based fluorescence detection system, incorporating both hardware setup and computational processing.
Troubleshooting Guides
Frequently Asked Questions
Q1: Why is the sensitivity of my smartphone-based fluorescence detector low when analyzing blood plasma samples? Low sensitivity in blood plasma analysis is often caused by matrix effects, including autofluorescence of plasma components and ion suppression, which can quench the fluorescence signal [11]. To improve sensitivity:
- Implement Image Stacking: Use computational techniques like image stacking to improve the signal-to-noise ratio of your smartphone or webcam-based detector [11].
- Optimize Sample Dilution: Dilute the plasma sample to reduce the concentration of interfering compounds, but ensure this does not push the analyte concentration below the limit of detection [86].
- Use a Solid Phase Extraction (SPE) Step: Employ SPE to clean up the sample and isolate the analyte from the plasma matrix, thereby reducing interferences [86].
Q2: What are the main challenges when using a smartphone detector for environmental sample analysis, and how can I overcome them? Environmental samples often contain high dissolved solids and non-target metals, which can cause polyatomic interferences and physical issues like clogging or signal suppression in the detection system [87].
- For Polyatomic Interferences: If adapting advanced laboratory techniques like ICP-MS, triple quadrupole technology can eliminate these interferences. For optical detection, ensure you have appropriate optical filters to isolate the specific fluorescence wavelength [87].
- For High Dissolved Solids: Perform a dilution or use a matrix removal technique prior to analysis to prevent interface issues and reduce noise [87].
- Laser Excitation for Flow Cytometry: Integrating a laser for fluorescence excitation in a flow cytometry setup can significantly improve the sensitivity for detecting rare cells or particles in a complex environmental sample [11].
Q3: How can I minimize ion suppression effects from the sample matrix in my analysis? Ion suppression occurs when co-eluting compounds from the matrix interfere with the ionization of your target analyte.
- Improve Sample Cleanup: Utilize techniques like protein precipitation, liquid-liquid extraction, or solid-phase extraction to remove more of the matrix components before analysis [86].
- Post-Column Infusion: Perform a post-column infusion experiment with your analyte. By injecting a blank matrix sample, you can observe a "negative peak" where ion suppression is occurring, allowing you to identify and troubleshoot the issue [86].
- Use a Stable Isotope-Labeled Internal Standard: This type of internal standard will experience the same ion suppression as the analyte, allowing for accurate correction of the final quantitative result [86].
Q4: What is the best way to establish the lower limit of quantification (LLOQ) for a method validating a smartphone-based sensor? The LLOQ is the lowest concentration of an analyte that can be quantitatively determined with acceptable precision and accuracy.
- Calculation Basis: The LLOQ is typically established at a concentration of 1/20th of the Cmax (maximum plasma concentration) of the drug or analyte [86].
- Experimental Validation: Prepare and analyze at least five samples of the analyte at the proposed LLOQ concentration. The method is considered valid at this level if the precision (relative standard deviation) is within ±20% and the accuracy is 80-120% [86].
Key Experimental Protocols
Protocol 1: Method for Optimizing Matrix Effect in Bioanalytical Validation
This protocol outlines the steps to assess and minimize matrix effects, which is critical for developing a robust smartphone-based detection method.
- Sample Preparation: Prepare a blank biological matrix (e.g., plasma) from at least six different sources [86].
- Post-Extraction Spiking: Spike the analyte of interest into the cleaned-up blank matrix samples.
- Comparison Sample: Prepare the same concentrations of the analyte in a pure solution (e.g., mobile phase).
- Analysis and Calculation: Analyze all samples and compare the response of the analyte in the post-extraction spiked samples to the response in the pure solution. The ratio of the responses is used to calculate the matrix effect. A value of 100% indicates no matrix effect, while lower values indicate ion suppression and higher values indicate ion enhancement [86].
Protocol 2: Determining Extraction Recovery for an Analyte in Blood Plasma
This methodology validates the efficiency of the process used to extract the analyte from the complex plasma matrix.
- Prepare Samples in Triplicate:
- Set A (Pre-extraction Spiked): Spike the analyte into plasma before performing the extraction procedure.
- Set B (Post-extraction Spiked): Spike the analyte into a blank plasma matrix after it has been extracted.
- Analysis: Analyze all samples using the developed smartphone-based detection system.
- Recovery Calculation: Calculate the percentage recovery by comparing the response of Set A (pre-extraction) to the response of Set B (post-extraction). This indicates what proportion of the analyte was successfully recovered during the extraction process [86].
The following tables summarize key quantitative thresholds and parameters for method validation.
Table 1: Bioanalytical Method Validation Parameters
| Parameter | Acceptance Criterion | Description |
|---|---|---|
| Lower Limit of Quantification (LLOQ) | ≤ 1/20th of Cmax [86] | The lowest concentration that can be measured with accuracy and precision. |
| Accuracy | 80 - 120% (±20% for LLOQ) [86] | The closeness of the measured value to the true value. |
| Precision | ± 20% (at LLOQ) [86] | The degree of scatter between multiple measurements of the same sample. |
Table 2: Research Reagent Solutions
| Reagent / Material | Function in Experiment |
|---|---|
| Internal Standard | A compound of known purity, similar to the analyte, used to correct for processing errors and variability [86]. |
| Solid Phase Extraction (SPE) Cartridge | Used for sample cleanup to remove interfering matrix components from biological or environmental samples [86]. |
| Stable Isotope-Labeled Analyte | An ideal internal standard that behaves identically to the analyte during sample preparation and analysis, correcting for matrix effects [86]. |
| Mobile Phase Additives | Components of the liquid phase in chromatographic separation that can be optimized to improve analyte separation and reduce ion suppression [86]. |
Experimental Workflow and Signaling Pathway Diagrams
Inter-Smartphone Performance Variability and Standardization
Frequently Asked Questions (FAQs)
Q1: Why do I get inconsistent fluorescence measurements when using different smartphone models for the same experiment?
The primary cause is the variation in how different smartphones process image data. Key factors include:
- Computational Processing: Unlike scientific cameras, smartphones apply automatic, non-linear processing (like tone mapping) to enhance images for aesthetic purposes. This process dynamically adjusts the dynamic range, which distorts the true intensity values of your fluorescence signal [88].
- Sensor Physical Differences: The physical size of the image sensor and the size of individual pixels vary significantly between models. Larger pixels, typically found on larger sensors, can capture more light, resulting in better performance in low-light conditions like fluorescence detection [89].
- Lens-Induced Distortions: Each camera lens introduces unique geometric distortions (radial and tangential) that can affect spatial measurements if not corrected [89].
Q2: What are the most critical camera settings to control for quantitative fluorescence detection?
For reliable quantitative results, you must gain manual control over the camera and disable automated features. The most critical settings are:
- Tone Mapping: This is the most crucial parameter. It must be set to a linear mode instead of the default automatic setting to prevent non-linear scaling of your signal intensity [88].
- Exposure Time: Manual control of exposure is essential. Use the camera's live histogram to set an exposure time that provides a strong signal without saturating the pixels [34] [25].
- ISO/Gain: While increasing gain can amplify a dim signal, it also amplifies noise. It is better to prioritize increasing exposure time before significantly raising gain to maintain a good signal-to-noise ratio [90].
- White Balance: Set white balance to a fixed preset or manual mode to prevent automatic color shifts between measurements [88] [90].
Q3: How can I calibrate my smartphone camera to ensure accurate intensity measurements?
A two-step calibration process is recommended:
- Linearize the Camera Response: Use a custom application (e.g., leveraging the Android Camera2 API) to disable auto tone mapping and set it to a linear mode [88].
- Determine the Sensor's Minimum Light Threshold: Characterize the sensor's "zero light offset" (ZLO). This involves measuring the camera's signal output in complete darkness, which allows you to correct the baseline (DC component) of your photoplethysmography (PPG) measurements for accurate ratiometric calculations [88]. A benchtop setup with a light-blocking box and programmable LEDs can be used for this calibration.
Q4: My camera app is freezing or showing a "Camera Failed" error during experiments. What should I do?
This is typically a software-related issue. Follow this troubleshooting sequence:
- Restart the application and then your phone [91] [92].
- Force quit the camera app and clear its cache [91].
- Ensure no other applications are running in the background and using the camera [91].
- Check for and install any operating system and camera app updates, as these often contain bug fixes [91].
- As a last resort, back up your data and perform a factory reset [91].
Troubleshooting Guides
Issue: Poor Signal-to-Noise Ratio in Low-Light Fluorescence Images
Problem: Fluorescence images are grainy and dim, making it difficult to distinguish the signal from the background noise.
Solution: Optimize acquisition settings to maximize signal while minimizing noise.
| Step | Action | Rationale |
|---|---|---|
| 1 | Use the histogram to set a baseline. Aim for a distribution where the signal peak is well-separated from the background, with no saturation (no sharp cliff at the maximum intensity) [34] [25]. | The histogram provides an objective measure of exposure, independent of the screen's display adjustments. |
| 2 | Start with the gentlest (lowest) excitation light intensity and a long exposure time. Gradually increase the exposure until you achieve a usable signal [34] [25]. | This minimizes phototoxicity and photobleaching of your sample from the start [25]. |
| 3 | If the required exposure time is impractical, incrementally increase the excitation light intensity [34] [25]. | Finding a balance between light intensity and exposure time protects delicate samples. |
| 4 | Only increase the ISO/gain as a last resort after optimizing exposure and light intensity [90]. | Gain amplifies both the true signal and the underlying camera noise, which can degrade image quality. |
Issue: Inconsistent Measurements Across Different Smartphone Models
Problem: The same fluorescence sample yields different intensity readings when imaged with different smartphones.
Solution: Implement a standardization protocol to control for inter-device variability.
| Step | Action | Objective |
|---|---|---|
| 1 | Camera Selection & Profiling | Characterize the basic performance of the device. |
| 2 | Calibration | Linearize the camera's response and establish a baseline. |
| 3 | Standardized Imaging Protocol | Ensure consistent data acquisition. |
| 4 | Use of Reference Standards | Normalize data across devices and sessions. |
Detailed Methodology:
- Camera Selection & Profiling: Document the key sensor specifications for each phone, such as sensor size, pixel size, and resolution [89]. Understanding these hardware differences helps set realistic expectations for performance.
- Calibration:
- Geometric Calibration: Capture images of a calibration checkerboard pattern. Use photogrammetric software to calculate the camera's internal parameters (focal length, principal point) and lens distortion coefficients. This allows for the correction of spatial distortions in images [89].
- Radiometric Calibration: As detailed in the FAQs, use a calibrated light source and a linear tone mapping setting to characterize and correct for the sensor's non-linearities and minimum light threshold [88].
- Standardized Imaging Protocol: Create a strict imaging protocol that mandates fixed settings for exposure, ISO, white balance, and focus for a given experiment. This protocol must be followed exactly for all devices [88] [90].
- Use of Reference Standards: Image a stable, fluorescent reference standard (e.g., fluorescent microsphere slides or ready-made standard solutions) with each smartphone during every imaging session [93]. The known intensity values of these standards can be used to normalize the experimental data from different devices, correcting for day-to-day and device-specific variations.
The table below summarizes key performance differentiators between a typical smartphone camera and a scientific imaging camera, highlighting the sources of variability.
Table 1: Camera Performance Factors in Fluorescence Imaging
| Parameter | Typical Smartphone Camera | Scientific Camera | Impact on Fluorescence Detection |
|---|---|---|---|
| Sensor Size | Small (e.g., 7.4 x 5.5 mm [89]) | Large (e.g., 35.8 x 23.9 mm [89]) | Larger sensors capture more light, improving low-light performance. |
| Pixel Size | Small (e.g., 0.8 µm [89]) | Large (e.g., 5.97 µm [89]) | Larger pixels capture more photons, leading to a better signal-to-noise ratio. |
| Quantum Efficiency | Varies, often not specified | High (can be >70%) | A higher QE means more efficient conversion of photons to electrons, crucial for faint signals [25]. |
| Tone Mapping | Default is non-linear (e.g., logarithmic) [88] | Linear | Non-linear mapping distorts intensity values, making quantitative measurements unreliable [88]. |
| Cooling | Not available | Active cooling (thermoelectric) | Cooling drastically reduces thermal noise (dark current) during long exposures, which is critical for low-light imaging [25]. |
The Scientist's Toolkit
Table 2: Essential Research Reagent Solutions for Smartphone-based Fluorescence
| Item | Function | Application Note |
|---|---|---|
| Fluorescent Reference Standards | Stable samples with known fluorescence properties used to calibrate and normalize intensity measurements across devices and time [93]. | Essential for correcting inter-smartphone variability. Include microsphere slides for microscopy and standard solutions for cuvette-based measurements. |
| Calibration Checkerboard | A high-contrast grid pattern used to characterize and correct for lens-induced geometric distortions (radial and tangential) [89]. | Required for any experiment where spatial measurements are critical. |
| Programmable LED Source | A stable, controllable light source used for radiometric calibration to characterize the smartphone sensor's linearity and minimum threshold [88]. | Used in a benchtop setup to linearize the camera response. |
| Light-Blocking Enclosure | A dark box to eliminate ambient light during calibration and imaging, ensuring that the measured signal comes only from the sample [88]. | Critical for achieving a high signal-to-noise ratio in low-light conditions. |
Experimental Workflow Diagrams
Conclusion
Optimizing smartphone cameras for low-light fluorescence detection creates a powerful, accessible platform that is no longer just a laboratory curiosity but a validated tool for quantitative biomedical analysis. By integrating purpose-built hardware, intelligent software, and robust assay design, researchers can achieve sensitivities rivaling traditional equipment, from detecting bacterial reporters to achieving single-molecule resolution. This convergence of consumer technology and biosensing paves the way for decentralized diagnostics, high-throughput drug screening, and real-time environmental monitoring, ultimately making advanced analytical capabilities more ubiquitous in both research and clinical settings.
References
- 1. A low-cost smartphone fluorescence microscope for ... [https://www.nature.com/articles/s41598-023-29182-y]
- 2. Smartphones as a platform for molecular analysis [https://pubs.rsc.org/en/content/articlehtml/2025/lc/d4lc00966e]
- 3. Ultracompact fluorescence smartphone attachment using ... [https://pmc.ncbi.nlm.nih.gov/articles/PMC8606126/]
- 4. Smartphone-based low light detection for bioluminescence ... [https://www.nature.com/articles/srep40203]
- 5. Quantitative Analysis of Fluorescence Detection Using a ... [https://www.mdpi.com/1424-8220/21/11/3917]
- 6. A beginner's guide to rigor and reproducibility in fluorescence ... [https://pmc.ncbi.nlm.nih.gov/articles/PMC6080651/]
- 7. Troubleshooting in Fluorescent Staining [https://www.creative-bioarray.com/support/troubleshooting-in-fluorescent-staining.htm]
- 8. Low Light Imaging Market Size, Share, Growth & Industry ... [https://www.mordorintelligence.com/industry-reports/low-light-imaging-market]
- 9. Smartphone-based optical spectroscopic platforms for ... [https://opg.optica.org/boe/abstract.cfm?uri=boe-12-4-1974]
- 10. Direct single-molecule detection and super-resolution ... [https://www.nature.com/articles/s41467-025-63993-z]
- 11. Improving the Sensitivity and Functionality of Mobile ... [https://pmc.ncbi.nlm.nih.gov/articles/PMC4931414/]
- 12. Smartphone-based imaging systems for medical applications [https://pmc.ncbi.nlm.nih.gov/articles/PMC8047775/]
- 13. Sensitivity, high throughput, and smart detection [https://www.sciencedirect.com/science/article/abs/pii/S0924424724001134]
- 14. Smartphone-based platforms implementing microfluidic ... [https://www.nature.com/articles/s41467-023-36017-x]
- 15. CMOS Image Sensors: Technology Insights and Applications [https://reolink.com/blog/cmos-image-sensors/?srsltid=AfmBOoqkROHVLV_42WJGEwy6u88Dzvdz3c6gzw45ZLMxiE-rskoXQw9g]
- 16. CMOS Sensors in Digital Cameras [https://proedu.com/blogs/photography-fundamentals/cmos-sensors-in-digital-cameras-understanding-the-basics?srsltid=AfmBOopDAS57WPTvsWkaDmZAYpMWBDb9FN8Ho4tXB0cH_LNT21G1ZH_8]
- 17. ISOCELL Image Sensor | Samsung Semiconductor Global [https://semiconductor.samsung.com/image-sensor/]
- 18. Fast and accurate sCMOS noise correction for ... [https://www.nature.com/articles/s41467-019-13841-8]
- 19. Optimising image capture for low-light widefield ... [https://arxiv.org/html/2410.19210v1]
- 20. What is CMOS sensor size in embedded cameras? How to ... [https://www.e-consystems.com/blog/camera/technology/what-is-cmos-sensor-size-in-embedded-cameras-how-to-pick-the-right-sensor-size/]
- 21. Information - Sony Semiconductor Solutions [https://www.sony-semicon.com/en/info/2025/2025062601.html]
- 22. Smartphone-based low light detection for bioluminescence ... [https://pmc.ncbi.nlm.nih.gov/articles/PMC5220360/]
- 23. Quantitative Detection of Bioassays Using a Low-Cost Image ... [https://pmc.ncbi.nlm.nih.gov/articles/PMC5509166/]
- 24. CCD Noise Sources and Signal-to-Noise Ratio [https://hamamatsu.magnet.fsu.edu/articles/ccdsnr.html]
- 25. Optimizing Fluorescence Imaging for Clear Results [https://precipoint.com/en/digital-microscopy/how-can-you-optimize-fluorescence-imaging-for-clear-and-accurate-results]
- 26. Troubleshooting Tips for Fluorescence Staining [https://biotium.com/tech-tips-protocols/troubleshooting-tips-for-fluorescence-staining/]
- 27. 3D printing fluorescent material with tunable optical ... [https://www.nature.com/articles/s41598-021-96496-0]
- 28. How to Design and 3D Print Snap-Fit Joints for Enclosures ... [https://formlabs.com/blog/designing-3d-printed-snap-fit-enclosures/?srsltid=AfmBOooy9J-5swAuOcf8h__WnZy74Lwso8Tn-DETGmk-SN1QuNgBnvtx]
- 29. A portable fluorescence detection device based on a ... [https://pubs.rsc.org/en/content/articlelanding/2024/ay/d4ay00027g]
- 30. Smartphone-based portable fluorescence sensor with gold ... [https://www.sciencedirect.com/science/article/abs/pii/S030881462200440X]
- 31. Tips to Improve Low - Light Photography on an Android Smartphone [https://www.maketecheasier.com/improve-low-light-photography-on-an-android/]
- 32. A New Era For LowLight Photography [https://procamera-app.com/en/low-light-plus/]
- 33. Review: ProCamera Low Light Modes [https://nocamerabag.com/blog/review-low-light-modes-procamera-app]
- 34. Microscope Camera Best Practices for Fluorescence Imaging [https://evidentscientific.com/en/insights/microscope-camera-best-practices-for-fluorescence-imaging]
- 35. Mastering Smartphone Photography at Night [https://www.photographytalk.com/mastering-smartphone-photography-at-night/]
- 36. Real-time low-light video enhancement on smartphones [https://link.springer.com/article/10.1007/s11554-024-01532-7]
- 37. Custom Camera Presets in ProCamera [https://procamera-app.com/en/custom-camera-presets/]
- 38. Maximizing analytical precision: exploring the advantages ... [https://www.frontiersin.org/journals/analytical-science/articles/10.3389/frans.2023.1258558/full]
- 39. "Development of Smartphone-Based Fluorescence Detection ... [https://docs.lib.purdue.edu/dissertations/AAI30505514/]
- 40. Self-correcting ratiometric fluorescence assay for H 2 S ... [https://www.sciencedirect.com/science/article/abs/pii/S0925400524012978]
- 41. Ratiometric fluorescent and smartphone-assisted dual ... [https://www.sciencedirect.com/science/article/abs/pii/S0308814625007150]
- 42. Ratiometric fluorescence sensing and quantification of ... [https://pmc.ncbi.nlm.nih.gov/articles/PMC10659809/]
- 43. A self-calibrating ratiometric fluorescence sensor with ... [https://www.sciencedirect.com/science/article/abs/pii/S0308814624010689]
- 44. Understanding microRNAs in the context of bacterial ... [https://pmc.ncbi.nlm.nih.gov/articles/PMC11534382/]
- 45. miRNAs reshape immunity and inflammatory responses in ... [https://www.nature.com/articles/s41392-018-0006-9]
- 46. Flow Cytometry Troubleshooting Guide [https://fluorofinder.com/flow-cytometry-troubleshooting/]
- 47. MicroRNA Biomarkers for Infectious Diseases: From Basic ... [https://www.frontiersin.org/journals/microbiology/articles/10.3389/fmicb.2020.01197/full]
- 48. Enhancing Biomarker Detection and Imaging Performance ... [https://pmc.ncbi.nlm.nih.gov/articles/PMC12293553/]
- 49. Evaluation of Mobile Phone Performance for Near-Infrared ... [https://www.embs.org/tbme/articles/evaluation-mobile-phone-performance-near-infrared-fluorescence-imaging/]
- 50. Smartphone Camera Settings – How to Use Your ... [https://theprincientist.com/smartphone-camera-settings/]
- 51. A Smartphone-Based Low-Cost Inverted Laser ... [https://pmc.ncbi.nlm.nih.gov/articles/PMC9688076/]
- 52. How to use the camera's pro mode on Samsung Galaxy ... [https://www.samsung.com/ae/support/mobile-devices/how-to-use-the-cameras-pro-mode-on-samsung-galaxy-phones/]
- 53. A smartphone-based fluorospectrophotometer and ... [https://www.sciencedirect.com/science/article/pii/S2589004223006302]
- 54. Direct single-molecule detection and super-resolution imaging ... [https://pmc.ncbi.nlm.nih.gov/articles/PMC12508040/]
- 55. Smartphone epifluorescence microscopy for cellular ... [https://opg.optica.org/boe/abstract.cfm?uri=boe-11-1-89]
- 56. Fluorophores and Optical Filters for Fluorescence Microscopy [https://www.edmundoptics.com/knowledge-center/application-notes/optics/fluorophores-and-optical-filters-for-fluorescence-microscopy/?srsltid=AfmBOorRFDM5QlPoQcUd-am0slwVaVYUyN3zBFSRNm7yVf5p6SXaM_iZ]
- 57. Filters for Fluorescence Microscopy Tutorial [https://www.thorlabs.com/newgrouppage9.cfm?objectgroup_id=10769]
- 58. Cellular Fluorescence Microscopy Troubleshooting & Best ... [https://www.aatbio.com/resources/application-notes/cellular-fluorescence-microscopy-troubleshooting-best-practices]
- 59. Selecting Fluorescent Dyes and Quenchers for ... [https://www.linkedin.com/pulse/selecting-fluorescent-dyes-quenchers-oligonucleotide-guide-luke-7gi6f]
- 60. The strategy to improve the brightness of organic small ... [https://www.sciencedirect.com/science/article/abs/pii/S1001841724011616]
- 61. A general method to improve fluorophores for live-cell and ... [https://pmc.ncbi.nlm.nih.gov/articles/PMC4344395/]
- 62. the mission to make more photostable fluorophores [https://www.nature.com/articles/d41586-024-01591-7]
- 63. Algorithms for the selection of fluorescent reporters - PMC [https://pmc.ncbi.nlm.nih.gov/articles/PMC7838271/]
- 64. Tips to Minimize Autofluorescence [https://fluorofinder.com/autofluorescence/]
- 65. Learn how to Remove Autofluorescence from your ... [https://www.leica-microsystems.com/science-lab/life-science/learn-how-to-remove-autofluorescence-from-your-confocal-images/]
- 66. Low Light Phone Photography: The Best Settings and Pro ... [https://photogpedia.com/low-light-phone-photography/]
- 67. Elimination of autofluorescence background from ... [https://pmc.ncbi.nlm.nih.gov/articles/PMC3566262/]
- 68. A robust method for autofluorescence-free ... [https://www.nature.com/articles/s41598-025-89142-6]
- 69. Artifact detection in fluorescence microscopy using ... [https://www.nature.com/articles/s41598-025-18943-6]
- 70. Lens Filters: The Definitive Guide (2025) [https://www.photopills.com/articles/lens-filters-guide]
- 71. Using ND Filters in Night Photography [https://kasefilters.eu/blog/using-nd-filters-night-photography]
- 72. Smartphone Photography Mastery: Pro Tips for 2025 [https://aestheticsofphotography.com/smartphone-photography-mastery-pro-tips-for-2025/]
- 73. iPhone Photography using Neutral Density Filters ... Why [https://glyndewis.com/blog/nd-filters-iphone]
- 74. Mobile and Wireless Autofluorescence Detection Systems and ... [https://pmc.ncbi.nlm.nih.gov/articles/PMC12384273/]
- 75. The optimal color space enables advantageous ... [https://www.sciencedirect.com/science/article/pii/S0956566324010960]
- 76. Precision Calibration of Ambient Light Sensors [https://nastechgroup.com/precision-calibration-of-ambient-light-sensors-from-spectral-physics-to-real-time-exposure-mastery/]
- 77. Design and fabrication of smartphone based single paper ... [https://www.sciencedirect.com/science/article/pii/S2590137025000998]
- 78. Imaging in the Linear Range [https://www.licorbio.com/applications/quantitative-western-blots/imaging]
- 79. Expanding the Dynamic Range of Fluorescence Assays ... [https://pmc.ncbi.nlm.nih.gov/articles/PMC6462413/]
- 80. Improving limit of detection for Cr in total reflection X-ray ... [https://www.sciencedirect.com/science/article/pii/S0584854725002757]
- 81. Deep learning-assisted smartphone-based ratio ... [https://www.sciencedirect.com/science/article/abs/pii/S1385894722004855]
- 82. Preparation of Fluorescent Probes Based on Covalent ... [https://pubs.rsc.org/en/Content/ArticleLanding/2025/AY/D5AY01555C]
- 83. Optimizing fluorescence imaging through scattering media ... [https://pmc.ncbi.nlm.nih.gov/articles/PMC12450743/]
- 84. Optimizing Fluorescence Imaging Through Scattering ... [https://www.sciencedirect.com/science/article/pii/S2589004225016906]
- 85. Enhanced optical imaging and fluorescent labeling for ... [https://pmc.ncbi.nlm.nih.gov/articles/PMC11143489/]
- 86. TROUBLE SHOOTING DURING BIOANALYTICAL ... [https://pmc.ncbi.nlm.nih.gov/articles/PMC3255387/]
- 87. ICPMS Analysis of Complex Sample Matrices: Challenges ... [https://www.eurofinsus.com/environment-testing/resources/webinars/icpms-analysis-of-complex-sample-matrices-challenges-and-considerations/]
- 88. A calibration method for smartphone camera ... [https://www.frontiersin.org/journals/digital-health/articles/10.3389/fdgth.2023.1301019/full]
- 89. Comparative Evaluation of the Performance of a Mobile ... [https://pmc.ncbi.nlm.nih.gov/articles/PMC11314698/]
- 90. Camera settings [https://www.mbfbioscience.com/help/neurolucida/Content/Ribbons/Workspace/CameraSettings.htm]
- 91. How to fix an Android camera that's not working [https://www.asurion.com/connect/tech-tips/android-camera-not-working/]
- 92. Issues with Camera app on Samsung phone or tablet [https://www.samsung.com/us/support/troubleshooting/TSG01001329/]
- 93. Fluorescence Fundamentals | Thermo Fisher Scientific - US [https://www.thermofisher.com/us/en/home/references/molecular-probes-the-handbook/introduction-to-fluorescence-techniques.html]