Overcoming Matrix Challenges: A Comprehensive Guide to Multiple Headspace Extraction (MHE) in Pharmaceutical and Biomedical Analysis
This article provides researchers, scientists, and drug development professionals with a complete framework for implementing Multiple Headspace Extraction (MHE) to quantify volatile impurities in complex, difficult-to-handle matrices where traditional calibration...
Overcoming Matrix Challenges: A Comprehensive Guide to Multiple Headspace Extraction (MHE) in Pharmaceutical and Biomedical Analysis
Abstract
This article provides researchers, scientists, and drug development professionals with a complete framework for implementing Multiple Headspace Extraction (MHE) to quantify volatile impurities in complex, difficult-to-handle matrices where traditional calibration methods fail. Covering foundational theory to advanced applications, it details the principles of MHE for eliminating matrix effects, explores its combination with modern techniques like SPME, SDME, and SIFT-MS, and offers practical troubleshooting for challenging systems. The content validates MHE's performance through case studies on drug products, packaging materials, and biomedical samples, demonstrating its critical role in ensuring product safety and advancing analytical capabilities for solid and complex liquid samples.
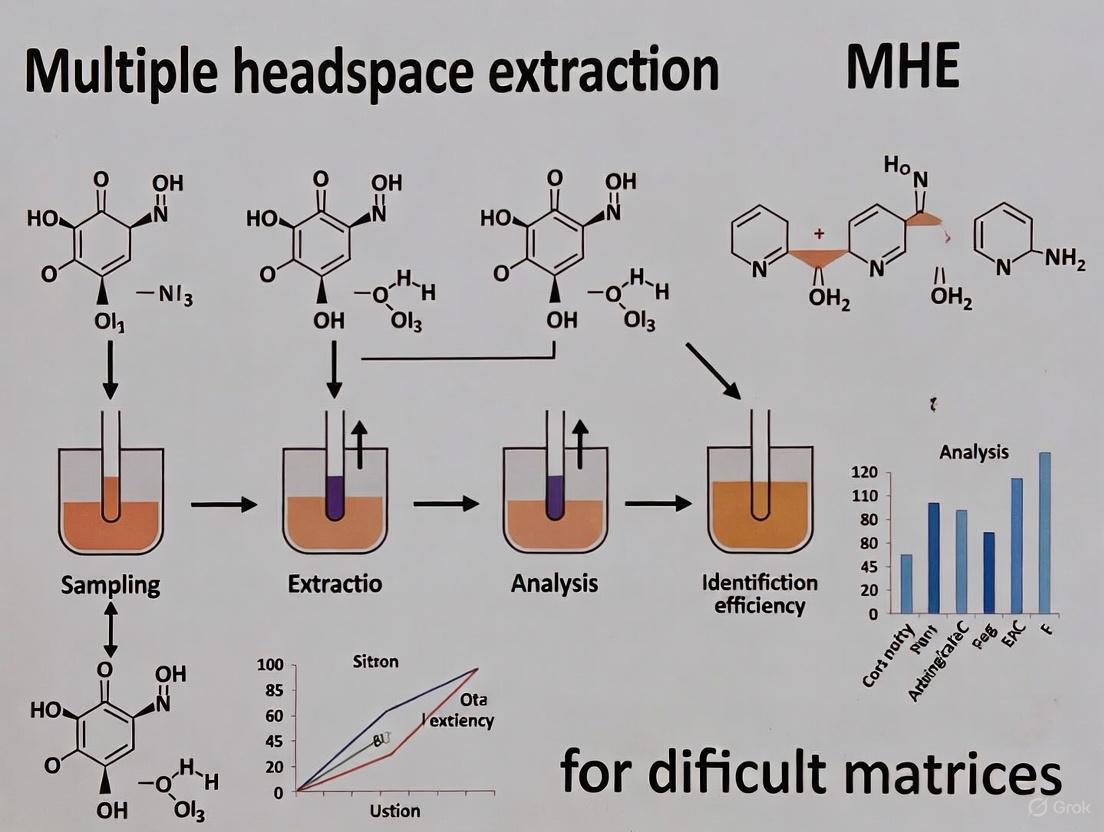
What is Multiple Headspace Extraction? Mastering the Fundamentals for Complex Matrices
For researchers in drug development and analytical science, achieving accurate quantification of volatile and semi-volatile compounds in complex matrices is a fundamental challenge. While matrix-matched calibration (MMC) is a widely recognized strategy to correct for matrix effects, it encounters significant, and sometimes insurmountable, obstacles when dealing with solid and complex liquid samples. This guide explores the inherent limitations of MMC and positions multiple headspace extraction (MHE) as a powerful alternative, supported by comparative experimental data and detailed protocols.
The Fundamental Flaw: The Impossibility of Perfect Matrix Matching
Matrix effects occur when components of a sample other than the analyte interfere with its detection, typically causing ionization suppression or enhancement in mass spectrometry [1] [2]. MMC attempts to correct for this by using calibration standards prepared in a blank matrix that mimics the sample.
However, this approach fails for many complex samples for two core reasons:
- Inherent Matrix Heterogeneity: It is impossible to obtain or create a blank matrix that perfectly replicates the composition of a unique, complex sample, such as a patented drug formulation, a biological tissue, or a specific foodstuff [3] [1]. The matrix composition has a greater effect on analytical precision than the choice of calibration method itself [4].
- Practical Unfeasibility: For many solids (e.g., polymers, packaging materials) and complex liquids (e.g., bronchoalveolar lavage fluid, Baijiu, beer), a blank matrix simply does not exist [5] [6] [7]. Exhaustive extraction or solvent-based sample preparation can be long and complicated, introducing new sources of error [5].
The following diagram illustrates the critical shortcomings of the MMC workflow when applied to these challenging matrices.
Comparative Performance Data: MMC vs. MHE and Other Techniques
The theoretical limitations of MMC are borne out in experimental data. The following tables summarize quantitative comparisons of calibration techniques and the performance of optimized methods in different matrices.
Table 1: Comparison of Calibration Techniques for GC-MS Analysis of Organochlorine Compounds in Varying Matrices [4]
| Calibration Technique | Average Mean Recovery | Overall Standard Deviation (95% Confidence) | Best Use Case |
|---|---|---|---|
| Matrix-Matched Internal Standard (MMIS) | 87% | 38% | Matrices of varying/unknown composition |
| Matrix-Matched External Standard (MMES) | 77% | 32% | Low-matrix samples |
| Solvent-Only Internal Standard (SOIS) | 64% | 38% | High sensitivity methods |
| Solvent-Only External Standard (SOES) | 64% | 32% | Clean matrices |
Table 2: Performance of Optimized MHE and HS-SPME Methods in Complex Matrices
| Matrix | Analyte(s) | Method | Key Optimization Findings | Performance Outcome | Source |
|---|---|---|---|---|---|
| Polystyrene Pellets | Styrene | MHE-SIFT-MS | Equilibrium temp: 140°C | Throughput gain vs. MHE-GC; RSD < 2.5% | [5] |
| Gelucire Excipient | Formaldehyde | MHE-SIFT-MS | Single-injection calibration stable for 4 weeks | Enabled quantitative analysis at 12 samples/hour | [5] |
| Bronchoalveolar Lavage Fluid (BALF) | 1000+ Volatile Compounds | HS-SPME-GC×GC-TOFMS | 10 mL vial, no dilution, 50 min, 45°C, 40% NaCl | 340% increase in total peak area; 80% increase in peak number | [7] |
| Chinese Liquor (Baijiu) | 119 Aroma Compounds | HS-SPME-GC×GC-TOFMS | Dilution to 5% ethanol, 3.0 g NaCl, 45 min, 45°C | Recovery: 86.79–117.94%; RSD < 9.93% | [6] |
Experimental Protocols: Implementing MHE and Optimized HS-SPME
Protocol 1: Multiple Headspace Extraction with SIFT-MS for Solids
This protocol is ideal for quantifying volatile impurities in drug products and packaging materials where matrix-matched standards are impossible to prepare [5].
- Sample Preparation: Weigh a representative portion of the solid sample (e.g., polymer pellets, powdered tablet) into a 20 mL headspace vial. Seal the vial immediately with a PTFE/silicone septum cap.
- Instrument Setup: Configure an automated system combining a SIFT-MS instrument with a multipurpose autosampler equipped with a purge tool.
- MHE Cycle:
- Incubation: Heat the sample vial at the optimized temperature (e.g., 140°C for polystyrene) with agitation to reach equilibrium.
- Headspace Extraction: Extract a defined volume (e.g., 2.5 mL) of the headspace and inject it into the SIFT-MS instrument for analysis.
- Purge: The autosampler purge tool pressurizes the vial and vents the headspace to waste, removing the extracted volatiles.
- Regeneration: The vial is re-equilibrated at the incubation temperature for a fixed time.
- Repetition: Steps 3a-3d are repeated for 5-7 cycles per sample.
- Quantification: The exponentially decreasing peak areas from the successive injections are plotted. The total area (representing 100% extraction) is obtained by mathematical extrapolation, allowing for absolute quantification without a matrix-matched standard.
Protocol 2: Optimized HS-SPME for Complex Liquids
This method, demonstrated for bronchoalveolar lavage fluid (BALF) and Chinese liquor, maximizes the extraction of trace volatiles [7] [6].
- Sample Preparation:
- For BALF: Use 0.5 mL of undiluted, homogenized sample in a 10 mL headspace vial.
- For Baijiu: Dilute 8 mL of sample to 5% ethanol concentration and add 3.0 g of NaCl.
- Ionic Strength Adjustment: Add salt (e.g., 40% w/v NaCl) to the sample to improve the partitioning of volatile compounds into the headspace.
- Internal Standard: Add a suitable internal standard mixture to correct for minor instrumental variations.
- SPME Extraction: Introduce a 2 cm tri-phase DVB/CAR/PDMS or PDMS/CAR/DVB SPME fiber into the headspace. Extract for 45-50 minutes at 45°C with continuous agitation.
- GC×GC-TOFMS Analysis: Desorb the fiber in the GC injection port. Use comprehensive two-dimensional gas chromatography coupled with time-of-flight mass spectrometry for high-resolution separation and detection of co-eluting compounds.
The Scientist's Toolkit: Essential Reagents and Materials
Table 3: Key Research Reagent Solutions for MHE and HS-SPME
| Item | Function | Example Application |
|---|---|---|
| DVB/CAR/PDMS SPME Fiber | Extracts a broad range of volatile and semi-volatile compounds via adsorption. | Extraction of trace aroma compounds in Baijiu and volatiles in BALF [6] [7]. |
| PDMS-Coated Stir Bar (HSSE) | Provides a larger extraction phase volume for higher sensitivity. | Analysis of volatile compounds in beer [8]. |
| Stable Isotope-Labeled Internal Standards | Corrects for matrix-induced signal suppression/enhancement and losses in sample prep. | Considered the gold standard for correcting matrix effects in LC-MS [1]. |
| Selected Ion Flow Tube Mass Spectrometer | Enables rapid, chromatography-free analysis of headspace, drastically speeding up MHE. | Fast quantification of styrene in polymers and NDMA in ranitidine [5]. |
| GC×GC-TOFMS System | Provides superior separation power for complex volatile mixtures, reducing co-elution. | Identification of hundreds of trace compounds in BALF and Baijiu [7] [6]. |
For solids and complex liquids, matrix-matched calibration is often a flawed pursuit, leading analysts to compromise on accuracy, precision, and throughput. As the experimental data demonstrates, Multiple Headspace Extraction provides a scientifically rigorous and practical alternative. By eliminating the need for a matching blank matrix, MHE, especially when coupled with modern detection techniques like SIFT-MS and GC×GC-TOFMS, offers a robust pathway to true absolute quantification, empowering researchers to confidently analyze even the most challenging samples in drug development and beyond.
Multiple Headspace Extraction (MHE) represents a powerful analytical technique for the quantitative determination of volatile and semi-volatile compounds in complex solid and liquid matrices where traditional calibration methods fail. This methodology leverages the fundamental principle of exponential decay to mathematically extrapolate the total quantity of analyte present in a sample through a limited series of sequential headspace measurements. By eliminating the need for matrix-matched calibration standards, MHE provides exceptional accuracy for challenging applications in pharmaceutical development, polymer analysis, environmental monitoring, and food safety. This guide examines the theoretical underpinnings of MHE, provides detailed experimental protocols, and objectively compares its performance against alternative extraction techniques, supported by current experimental data.
Theoretical Foundation: Exponential Decay in MHE
The Exponential Decay Principle
At the core of Multiple Headspace Extraction lies the mathematical principle of exponential decay. A quantity is subject to exponential decay when it decreases at a rate proportional to its current value [9]. This process can be expressed by the differential equation:
dN(t)/dt = -λN(t)
where N is the quantity, t is time, and λ is the decay constant [9]. The solution to this equation is:
N(t) = N₀e^(-λt)
where N(t) is the quantity at time t, and N₀ is the initial quantity [9].
In the context of MHE, this exponential relationship manifests as the progressive reduction of analyte concentration in the headspace of a sealed vial with each successive extraction cycle. After each extraction and vial repressurization, the amount of analyte remaining in the sample decreases according to this exponential decay model [10].
Mathematical Formalism of MHE
The MHE technique, first introduced by Kolb and Pospisil and later formalized in 1981, calculates the total amount of analyte in a solid sample after only a few successive extractions [10]. When a portion of the headspace gas is removed and analyzed, the area obtained is proportional to the amount of analyte present in the sample at that time. As the extraction process is repeated, the peak areas form a decreasing sequence [10].
The fundamental equation governing MHE is:
Aₖ = A₁e^(-β(k-1))
where:
- Aₖ is the peak area obtained from the k-th extraction
- A₁ is the peak area obtained from the first extraction
- β is the decay constant specific to the analyte-matrix system
The total peak area corresponding to the complete release of the analyte from the sample is obtained by summing the infinite geometric series:
A_total = A₁ / (1 - e^(-β))
This total area (A_total) is directly proportional to the total amount of analyte present in the original sample, enabling quantitative determination without matrix-matched standards [10].
The following diagram illustrates the conceptual workflow and theoretical foundation of the MHE process:
Diagram 1: MHE Theoretical Workflow. This diagram illustrates the conceptual process of Multiple Headspace Extraction, from sample preparation to the application of the exponential decay model for total analyte quantification.
Experimental Protocols and Methodologies
Standard MHE Workflow
The implementation of MHE follows a systematic experimental protocol:
Sample Preparation: A precisely weighed solid or complex liquid sample is placed into a sealed headspace vial, typically 10-20 mL in volume [10] [5]. For solid matrices, the sample is often homogenized to ensure representative sampling.
Equilibration: The vial is heated to a predetermined temperature in the autosampler oven for a specified time to establish equilibrium between the analyte in the sample matrix and the headspace gas phase [5]. Temperature and time must be optimized for each analyte-matrix combination.
Headspace Extraction: A defined volume of headspace gas is extracted from the vial using a gas-tight syringe and injected into the analytical instrument (typically GC or SIFT-MS) [5]. The extraction volume is usually 10-25% of the total headspace volume.
Vial Repressurization: Following each extraction, the vial is promptly repressurized with inert gas (typically nitrogen) to maintain pressure equilibrium and prevent vacuum effects that could alter partitioning behavior [5].
Repetition: Steps 3-4 are repeated multiple times (typically 3-6 extractions) to generate the sequence of decreasing peak areas required for the exponential decay calculation [10].
Quantitative Analysis: The peak areas are plotted against the extraction number on a logarithmic scale, and the decay constant (β) is determined through linear regression. The total analyte amount is then calculated using the infinite series sum formula [10].
MHE with Miniaturized Extraction Techniques
Recent advancements have integrated MHE with miniaturized extraction techniques, broadening its applicability:
MHE-Solid-Phase Microextraction (MHS-SPME): Combines MHE with SPME fibers coated with polymeric absorbent or adsorbent [10]. This solvent-free approach offers easy automation, portability, and enhanced sensitivity while maintaining the quantitative capabilities of traditional MHE.
MHE-Single-Drop Microextraction (MHS-SDME): Utilizes a micro-drop of organic solvent suspended in the headspace or immersed directly in aqueous samples [10] [11]. This approach significantly reduces solvent consumption (by approximately 99%) compared to traditional liquid-liquid extraction while improving concentration factors.
The following workflow diagram illustrates the implementation of MHE with modern analytical techniques:
Diagram 2: Comprehensive MHE Experimental Workflow. This diagram outlines the complete experimental procedure for Multiple Headspace Extraction, from sample preparation through to final quantification, including integration with modern miniaturized extraction techniques.
Comparative Performance Analysis
MHE Versus Alternative Extraction Techniques
The following table summarizes the comparative performance of MHE against other common extraction techniques for complex matrices:
Table 1: Performance Comparison of MHE versus Alternative Extraction Techniques
| Technique | Quantitative Capability | Matrix Effects | Solvent Consumption | Automation Potential | Analysis Time | Limit of Quantitation |
|---|---|---|---|---|---|---|
| MHE | Excellent (via mathematical extrapolation) | Eliminated through model | Low to none | Excellent | Moderate to Fast (with SIFT-MS) | Low ng/g to μg/g range [5] |
| MHE-SPME | Excellent | Eliminated through model | Solvent-free | Excellent | Moderate | Comparable to MHE [10] |
| MHE-SDME | Excellent | Eliminated through model | Minimal (single drop) | Good | Moderate | Comparable to MHE [10] |
| Dynamic Headspace (DHA) | Good (exhaustive extraction) | Significant | High (trapping) | Moderate | Very long | Low ng/g range |
| Soxhlet Extraction | Good (exhaustive extraction) | Significant | Very high | Poor | Very long (hours) | μg/g range |
| Liquid-Solid Extraction | Moderate | Significant | High | Moderate | Long | μg/g range |
| Static Headspace | Poor (without matched standards) | Severe | None | Excellent | Fast | μg/g range |
Analytical Performance Data
Recent studies have demonstrated the robust performance characteristics of MHE across various applications:
Table 2: Experimental Performance Data for MHE in Different Applications
| Application | Analyte | Matrix | Linearity (R²) | Repeatability (%RSD) | LOQ | Analysis Time | Reference |
|---|---|---|---|---|---|---|---|
| Pharmaceutical | NDMA | Ranitidine tablets | >0.999 | <2.5% | Low ng/g | 12 samples/hour | [5] |
| Polymer Analysis | Styrene | Polystyrene | >0.999 | <2.5% | μg/g range | 8x faster than MHE-GC | [5] |
| Excipient Analysis | Formaldehyde | Gelucire 44/14 | >0.999 | <2.5% | μg/g range | Calibration stable 4 weeks | [5] |
| Environmental | BTEX | Soil | >0.995 | <5% | Low ng/g | Moderate | [10] |
| Food Packaging | Volatiles | Printed films | >0.995 | <5% | μg/g range | Moderate | [10] |
The data demonstrate that MHE provides excellent linearity and repeatability while achieving low limits of quantitation across diverse applications. The integration with SIFT-MS technology has significantly enhanced analysis throughput, making MHE practical for routine analysis [5].
The Scientist's Toolkit: Essential Research Reagents and Materials
Successful implementation of MHE requires specific materials and instrumentation. The following table details essential components of the MHE research toolkit:
Table 3: Essential Research Reagents and Materials for MHE
| Item | Specification | Function | Application Notes |
|---|---|---|---|
| Headspace Vials | 10-20 mL, sealed with PTFE/silicone septa | Contain sample while allowing headspace formation and sampling | Chemical inertness crucial for reactive analytes |
| Extraction Syringe | Gas-tight, temperature-controlled (2.5 mL typical) | Extracts precise headspace volume for analysis | Must maintain temperature above equilibrium to prevent condensation [5] |
| Autosampler System | Automated, with purge capability | Provides high reproducibility and throughput | MPS Robotic Pro with purge tool cited [5] |
| Analytical Instrument | GC, GC-MS, or SIFT-MS | Separates, identifies, and quantifies volatiles | SIFT-MS reduces run times to <2 minutes/sample [5] |
| Purge Gas | High-purity nitrogen or zero-air | Repressurizes vial after extraction; purge between cycles | Prevents vacuum formation; removes residual volatiles [5] |
| Calibration Standards | Pure analyte standards in appropriate solvents | System performance verification | Required initially but not matrix-matched |
| Thermal Heater/Stirrer | Precise temperature control (±1°C) | Accelerates equilibrium and improves reproducibility | Essential for viscous or solid matrices |
Multiple Headspace Extraction establishes a robust theoretical and practical framework for quantifying volatile and semi-volatile compounds in complex matrices where traditional calibration approaches fail. By leveraging the fundamental principle of exponential decay, MHE eliminates matrix effects through mathematical extrapolation rather than physical sample manipulation. The integration of MHE with modern analytical platforms like SIFT-MS and miniaturized extraction techniques has transformed it from a specialized method into a practical, high-throughput solution for challenging analytical problems in pharmaceutical development, polymer science, and environmental monitoring. As evidenced by comparative performance data, MHE provides superior quantitative capability for complex matrices while reducing solvent consumption and analytical costs compared to exhaustive extraction techniques. The methodology continues to evolve through ongoing research into adsorption system behavior, expanded application domains, and enhanced workflow automation.
Multiple Headspace Extraction (MHE) is a sophisticated analytical technique designed to overcome fundamental challenges in the quantitative analysis of volatile compounds from complex solid matrices. Traditional headspace techniques can be compromised by matrix effects, where the sample matrix itself interferes with the release and accurate quantification of target analytes. MHE circumvents this limitation through a series of sequential extractions from the same sample, mathematically eliminating the matrix's contribution and enabling true quantification. Furthermore, as a solventless technique, MHE aligns with green chemistry principles by virtually eliminating the need for hazardous organic solvents while simultaneously enabling the direct analysis of solid materials. This guide explores the key advantages of MHE, providing a direct performance comparison with alternative methods and detailing the experimental protocols that validate its efficacy for researchers tackling difficult sample matrices.
Overcoming Matrix Effects
The Problem of Matrix Effects
In analytical chemistry, the "matrix" refers to all components of a sample other than the analyte of interest. The matrix effect is the collective interference these components cause during the analysis process, often leading to inaccurate results [12]. This effect can manifest as either signal suppression or signal enhancement, potentially causing false negatives or overestimation of analyte concentration [13]. In techniques like mass spectrometry, co-eluting matrix components can compete for ionization, altering the ionization efficiency of the target analyte [12] [13]. For solid samples, interactions between the analyte and the matrix can physically trap volatiles, preventing their complete release into the headspace and making conventional calibration methods unreliable [14] [12].
The MHE Solution and Mechanism
Multiple Headspace Extraction directly addresses and quantifies these matrix effects. Instead of a single extraction, MHE performs a series of extractions from the same sample vial. With each step, the amount of analyte released decreases exponentially. By plotting the logarithm of the peak area against the extraction number, a linear relationship is established, allowing for the calculation of the total analyte content in the sample by extrapolation [15]. This step-wise process effectively removes the matrix effect by mathematically distinguishing the analyte's signal from the background interference of the sample matrix [14].
Table 1: Comparison of MHE and Conventional Methods for Managing Matrix Effects
| Feature | Multiple Headspace Extraction (MHE) | Traditional Calibration in Solvent | Standard Addition Method |
|---|---|---|---|
| Principle | Stepwise extraction & mathematical extrapolation | Assumes similar response in solvent & matrix | Adds known analyte amounts to the sample |
| Matrix Effect Handling | Eliminates effect mathematically | Ignores effect, high risk of inaccuracy | Compensates for effect, but does not eliminate it |
| Best For | Complex, solid, or heterogeneous matrices | Simple liquid matrices or known minimal interference | Liquid matrices where sample volume can be altered |
| Key Advantage | Direct quantification in solid samples; no need for identical blank matrix | Simplicity and speed | Accounts for matrix-induced signal changes |
| Limitation | More time-consuming; requires multiple injections | Results can be significantly inaccurate for complex matrices | Tedious; requires multiple sample preparations & large sample volume |
Experimental Protocol: Quantitative Determination of Lactide in Polylactide
The application of MHE combined with Single-Drop Micro-Extraction (SDME) for determining lactide in thermo-oxidized polylactide (PLA) provides a robust example of overcoming matrix effects in a solid polymer [14].
- 1. Sample Preparation: Polylactide films are prepared by casting a chloroform solution of PLA onto petri dishes and allowing the solvent to evaporate. The films are then thermally oxidized in a headspace vial at a specific temperature (e.g., 180°C) for a set duration.
- 2. MHE-SDME Analysis: The vial is transferred to a heating block. A micro-syringe is used to suspend a single drop of a suitable solvent (e.g., 1 µL of butyl acetate) in the headspace of the vial.
- 3. Multiple Extractions: The headspace is extracted for a defined time (e.g., 5 minutes). After the extraction, the drop is retracted and injected into a Gas Chromatograph (GC) for analysis. This process is repeated multiple times from the same vial.
- 4. Data Calculation: The peak areas of lactide from each sequential extraction are recorded. The total amount of lactide in the original sample is calculated from the exponential decay curve of these areas, effectively negating the matrix interference from the solid polymer [14].
Diagram 1: MHE overcomes matrix effects via sequential extraction and calculation.
Reducing Solvent Use
The Move Toward Solventless Techniques
The reduction of solvent use is a cornerstone of green analytical chemistry. Traditional sample preparation methods, such as liquid-solid extraction (Soxhlet) and liquid-liquid extraction, are notoriously time and labour intensive, and consume large amounts of toxic organic solvents [14]. These methods also pose risks of volatile compound loss and generate significant hazardous waste. MHE, along with other solventless micro-extraction techniques, presents a viable and sustainable alternative.
Quantitative Comparison of Solvent Consumption
MHE techniques, particularly when coupled with micro-extraction tools like Solid-Phase Microextraction (SPME) or Single-Drop Microextraction (SDME), achieve a dramatic reduction in solvent consumption.
Table 2: Solvent Consumption Comparison Across Extraction Techniques
| Extraction Technique | Typical Solvent Volume per Sample | Sample Preparation Time | Generation of Hazardous Waste |
|---|---|---|---|
| Traditional Liquid-Liquid Extraction (LLE) | 50 - 250 mL | High | High |
| Solid-Phase Extraction (SPE) | 10 - 50 mL | Moderate | Moderate |
| Soxhlet Extraction | 100 - 500 mL | Very High (hours) | High |
| Single-Drop Microextraction (SDME) | 1 - 2 µL | Low | Virtually None [14] |
| Multiple Headspace Extraction (MHE-SPME) | 0 mL | Low | None [14] |
As shown in Table 2, MHE-SPME is a completely solvent-free technique, while MHE-SDME uses a negligible amount of solvent—a single micro-drop [14]. This translates to a reduction in solvent use by several orders of magnitude compared to traditional methods, minimizing environmental impact, reducing costs associated with solvent purchase and waste disposal, and improving workplace safety.
Experimental Protocol: MHE with Solid-Phase Microextraction
The coupling of MHE with SPME is a powerful, entirely solventless method for quantitative analysis.
- 1. Sample Preparation: A representative mass of the solid sample (e.g., 0.1 g of olive oil) is placed in a headspace vial. The vial is sealed immediately [15].
- 2. Equilibrium: The vial is incubated in a heater/shaker at a controlled temperature to allow the volatiles to partition between the sample and the headspace.
- 3. Multiple-Cumulative Trapping (MCT): An SPME fiber is exposed to the headspace of the sample for a set time. After the extraction, the fiber is injected into the GC inlet for desorption and analysis. This process is repeated automatically multiple times from the same vial (SV-MCT) or from multiple vials containing the same sample (MV-MCT) to enhance sensitivity [15].
- 4. Data Analysis: The peak areas from the sequential extractions are used in the MHE calculation model to determine the total analyte mass in the sample, without any solvent use throughout the entire process [15].
Enabling Direct Solid Analysis
The Challenge of Solid Samples
Analyzing solids directly is a significant challenge in analytical chemistry. Most analytical instruments, particularly chromatographs, require samples in a liquid or gaseous form. This necessitates extensive sample preparation for solid materials, which can introduce errors, lead to analyte loss, and increase analysis time. Techniques like the DMA-80 evo direct mercury analyzer demonstrate the value of direct solid analysis by performing thermal decomposition and analysis without pre-treatment, achieving results in about 5 minutes [16]. Similarly, solid AA technology allows for direct elemental analysis of solids by placing the sample directly into a graphite furnace, eliminating dilution errors and analyte losses associated with digestion [17]. MHE brings this same capability to the realm of volatile compound analysis.
MHE Protocol for Direct Solid Analysis
The fundamental strength of MHE is its inherent suitability for solid samples, from polymers and foods to packaging materials.
- 1. Sample Introduction: The solid sample is placed directly into a headspace vial without any dissolution, digestion, or other liquid-based preparation. For instance, a piece of polymer or a weighed portion of soil can be used [14].
- 2. Closed-System Analysis: The vial is sealed, and the analysis takes place within this closed system. This is a critical advantage as it prevents the loss of volatile compounds, which can occur during open-vessel preparation steps in traditional methods [14].
- 3. MHE Quantification: The standard MHE process of sequential extraction and calculation is performed. This protocol has been successfully applied for the quantitative determination of volatiles in solid matrixes like residual styrene in polystyrene and lactide in polylactide [14].
Diagram 2: MHE enables direct solid analysis with a simple, closed-system workflow.
The Scientist's Toolkit: Essential Research Reagents & Materials
Successful implementation of MHE requires specific tools and materials. The following table details key solutions for setting up and executing MHE experiments.
Table 3: Essential Research Reagents and Materials for MHE
| Item | Function/Description | Application Example |
|---|---|---|
| Headspace Vials & Seals | Inert glass vials with airtight crimp or screw caps to contain the sample and prevent volatile loss. | Universal for all MHE applications. |
| Internal Standards (Isotope-Labeled) | Added to the sample to correct for variations in sample preparation and instrument response; crucial for compensating for any residual matrix effect in LC-MS [12]. | Quantification of pharmaceuticals in complex biological or environmental samples [12]. |
| SPME Fibers | Solventless extraction tool with a polymeric coating that absorbs/adsorbs volatiles from the headspace. Available in various coatings (e.g., DVB/CAR/PDMS) for different analyte polarities [15]. | Volatile profiling of food samples (e.g., olive oil) [15]. |
| Micro-syringe for SDME | Device capable of holding and dispensing a single micro-drop (1-2 µL) of organic solvent for headspace extraction [14]. | Extraction of lactide from polylactide [14]. |
| Matrix-Matched Standards | Calibration standards prepared in a matrix that is chemically and physically similar to the sample; used when MHE is not applicable to correct for matrix effects [12]. | Analysis of samples where a blank matrix is available. |
| Automated Headspace Sampler | An autosampler capable of performing incubation, agitation, and sequential sampling from multiple vials; essential for high-throughput and reproducible MHE analysis. | Automated MHE-SPME or MHE-SDME workflows. |
Multiple Headspace Extraction stands as a powerful analytical strategy that directly addresses three critical challenges in modern laboratories. It provides a robust mathematical framework to overcome matrix effects, ensuring accurate quantification in complex solid samples where traditional methods fail. Its solventless or near-solventless nature aligns with sustainable green chemistry goals, drastically reducing hazardous waste and operational costs. Finally, it enables the direct and reliable analysis of solid materials, simplifying sample preparation and preserving volatile analytes. For researchers in drug development, material science, and environmental analysis working with difficult matrices, MHE is an indispensable technique that enhances data quality, improves efficiency, and promotes safer laboratory practices.
The accurate quantitative analysis of volatile compounds in solid or complex liquid samples presents a persistent analytical challenge. Traditional liquid-solid extraction techniques, including soxhlet extraction and microwave-assisted extraction, often prove expensive, time-consuming, and require large amounts of toxic organic solvents [10]. For volatile substances, headspace techniques offered an alternative, but the partition of analytes from a solid sample into the gaseous phase is frequently reduced due to analyte-matrix interactions, a phenomenon known as the "matrix effect" [10]. This effect causes considerable differences in partition coefficients and release rates, meaning that internal and external calibration techniques rarely produce acceptable results. It was within this analytical landscape that the technique originally termed discontinuous gas extraction emerged in 1977, pioneered by Kolb and Pospisil [10]. Later renamed Multiple Headspace Extraction (MHE), this technique was designed to overcome matrix effects, thereby enabling the direct quantitative determination of analytes in solid matrices by headspace analysis [10].
The core innovation of MHE is its ability to theoretically calculate the total amount of an analyte in a sample after a limited number of successive extractions, effectively removing the matrix's influence on quantitation [10]. This article traces the historical development of MHE from its origins as a discontinuous process to its current state as a highly automated, sensitive, and widely applicable technique, with a particular focus on its application in analyzing difficult matrices such as polymers, pharmaceuticals, and food products.
The Evolution of an Idea: From Theoretical Foundation to Automated Systems
The Principle of Multiple Headspace Extraction
The theoretical principles of MHE were formally detailed by Kolb and Pospisil in 1981 [10] [5]. The method is based on a stepwise headspace extraction from the same sample vial. In each extraction step, a portion of the headspace gas is removed and analyzed, which disturbs the equilibrium between the sample matrix and the headspace. The vial is then re-equilibrated, and the process is repeated several times. Because the analyte is exhaustively extracted from the headspace in a stepwise manner, the amount of analyte in the headspace decreases logarithmically with each step [10].
By plotting the logarithm of the analyte's peak area from each step against the extraction number, a linear relationship is obtained. The total amount of the analyte in the original sample can be determined by extrapolating this line to the point where no more analyte remains. This mathematical approach eliminates the need for matrix-matched calibration standards, which are often impossible or exceedingly difficult to prepare for complex solid matrices like polymers, gels, or soil [10] [5].
Combining MHE with Miniaturized Extraction Techniques
A significant developmental leap occurred with the combination of MHE with two miniaturized extraction techniques: solid-phase microextraction (SPME) and single-drop microextraction (SDME). This synergy, extensively reviewed in the scientific literature, broadened the applicability of SPME and SDME to the quantitative determination of analytes in complex liquid and solid matrices [10].
- Multiple Headspace Solid-Phase Microextraction (MHS-SPME): SPME, introduced by Pawliszyn and Arthur in 1990, uses a thin fused-silica fibre coated with a polymeric absorbent or adsorbent [10]. When MHE is combined with SPME, the fibre is exposed to the headspace of a sample in multiple consecutive extractions. This combination is solvent-free, easily automated, portable, and sensitive. It has been successfully applied to the analysis of environmental pollutants in soil, volatile compounds in packaging materials, and odour-causing compounds in cork stoppers [10].
- Multiple Headspace Single-Drop Microextraction (MHS-SDME): SDME is a miniaturized version of liquid-liquid extraction, where volatiles are extracted by a micro-drop of a water-insoluble organic solvent suspended in an aqueous sample [10]. Coupling SDME with MHE allows for the quantitative analysis of volatiles in complex aqueous matrixes, significantly reducing the amount of solvent used and the generation of hazardous waste compared to traditional methods.
The Advent of Full Automation
The true modernization of MHE came with the development of fully automated systems. Companies began producing specialized modules, such as the PAL System Multiple Headspace Extraction Module, which integrates with autosamplers to perform MHE routines without manual intervention [18]. This automation drastically improves reproducibility, increases laboratory throughput, and minimizes human error.
More recently, the integration of MHE with direct-injection mass spectrometry techniques, such as Selected Ion Flow Tube Mass Spectrometry (SIFT-MS), has further revolutionized the workflow [5]. While conventional gas chromatography (GC) implementations of MHE have long run times, making it an expensive technique, SIFT-MS performs chromatography-free analysis. This allows for a single headspace analysis to be completed in less than two minutes. One sample can be analyzed while the headspace is generated in up to 11 other samples, leading to an eightfold throughput enhancement compared to the equivalent GC method [5]. This transformation has made MHE a practical, cost-effective approach for routine quantitative analysis.
Modern Techniques: DHS-VTT and Advanced Workflows
Dynamic Headspace Vacuum Transfer In-Trap Extraction (DHS-VTT)
A novel and significant advancement in the field is the development of Dynamic Headspace Vacuum Transfer In-Trap Extraction (DHS-VTT) [19] [20]. This technique improves upon existing methods like Headspace In-Tube Extraction (HS-ITEX) by operating under reduced pressure. The DHS-VTT method uses a sampling device with a trap filled with a sorbent. The trap is connected via a needle to a headspace vial and, through a flow channel, to a vacuum source and an inert gas source [20].
The key operational steps of the DHS-VTT method, which can be performed in automated mode, are as follows [20]:
- The needle pierces the septum of a sample vial.
- A vacuum is applied, drawing the headspace through the trap where volatile compounds are adsorbed.
- The vacuum is stopped, and the needle is withdrawn.
- For desorption, the needle is inserted into a GC inlet, and the trap is heated.
- An inert gas flows through the trap, transferring the desorbed analytes to the GC column.
This vacuum-assisted approach significantly improves the extraction rate and capacity. Experimental results indicate that the mass spectrometer signal for target compounds can be up to 450 times more intense than with HS-SPME or HS-ITEX techniques under the same experimental conditions [19]. Additionally, the DHS-VTT hardware is robust, with a trap life up to 10 times longer than an SPME fibre, making it a sensitive and low-cost method for a wide range of volatile compounds [19].
Simplified Workflows with SIFT-MS
As previously mentioned, the use of SIFT-MS with MHE has created a new, streamlined workflow. A major advantage is the stability of the MHE calibration over time. Studies have shown that for analytes like formaldehyde in a gelucire excipient matrix, the MHE calibration factor remains stable for at least four weeks [5]. This allows quantitative analysis to proceed from a single headspace injection on any day within that period, eliminating the need for full MHE analysis for every batch and maximizing sample throughput to up to 12 samples per hour [5]. This stability, combined with the technique's ability to analyze challenging volatiles like formaldehyde and N-nitrosodimethylamine (NDMA) without derivatization, makes it a powerful tool for pharmaceutical quality control [5].
Comparative Performance Evaluation: Experimental Data
To objectively evaluate the performance of modern MHE techniques, the following tables summarize key experimental data from the literature, comparing the novel DHS-VTT method with established approaches and highlighting the performance of MHE-SIFT-MS.
Table 1: Comparison of Microextraction Techniques for VOC Analysis [19]
| Technique | Key Feature | Relative MS Signal Intensity | Trap/Fiber Lifespan | Automation Capability |
|---|---|---|---|---|
| DHS-VTT | Vacuum-assisted extraction | Up to 450x higher than SPME/ITEX | Up to 10x longer than SPME fibre | Full automated mode |
| HS-ITEX | Dynamic in-tube extraction | (Baseline) | Longer than SPME | Automated |
| HS-SPME | Solid-phase microextraction | (Baseline) | ~150 extractions per fibre | Automated |
Table 2: Performance of Automated MHE-SIFT-MS for Pharmaceutical Impurities [5]
| Analyte | Matrix | Limit of Quantitation (LOQ) | Throughput | Calibration Stability |
|---|---|---|---|---|
| Formaldehyde | Gelucire excipient | Not Specified | 12 samples/hour | > 4 weeks |
| NDMA | Ranitidine drug product | Low nanogram range | 12 samples/hour | Highly repeatable |
| Styrene | Polystyrene polymer | Not Specified | 8x faster than GC | Not Specified |
Experimental Protocols for Key Methodologies
Protocol for DHS-VTT Method Evaluation
The development and evaluation of the DHS-VTT technique, as described in the open-access study, can be summarized as follows [19]:
- Objective: To develop and evaluate a new vacuum-assisted microextraction technique (DHS-VTT) and compare its performance with established tools (ITEX and SPME).
- Sample Preparation: Various food matrices, specifically dairy products, were used. The sample quantity required is smaller than for traditional methods.
- Extraction Parameters: The DHS-VTT method was optimized using Response Surface Methodology. Key parameters evaluated include reduced pressure level, inert gas flow rate, and trap temperature. The trap temperature during adsorption steps is maintained lower than during the thermal desorption steps in the GC inlet.
- Instrumentation: Analysis was performed using Gas Chromatography-Mass Spectrometry (GC-MS). The DHS-VTT hardware was based on HS-ITEX equipment but modified to include a vacuum source.
- Comparison: All techniques (DHS-VTT, HS-ITEX, HS-SPME) were compared under the same experimental conditions of extraction temperature and time.
Protocol for MHE-SIFT-MS Workflow
The simplified, quantitative approach for volatile impurities using MHE-SIFT-MS involves the following steps [5]:
- Instrumentation: A SIFT-MS instrument (e.g., Voice200ultra or Syft Tracer) coupled with a multipurpose autosampler (e.g., Gerstel MPS Robotic Pro) equipped with a purge tool.
- Sample Preparation: Minimal preparation is required. For ranitidine products, tablets are powdered and analyzed directly without dissolution. For gelucire excipient, the sample is placed directly into a headspace vial.
- Headspace Analysis: Samples are incubated in 20-mL headspace vials. An aliquot of headspace (e.g., 2.5 mL) is extracted using a syringe and steadily injected (e.g., at 50 µL/s) into a flow of nitrogen or zero-air make-up gas in the SIFT-MS instrument.
- MHE Calibration: A full MHE (e.g., six injections) is initially performed to establish a calibration curve. Due to the high stability of SIFT-MS, this calibration factor can then be applied to subsequent samples for a period of several weeks, with quantitative results derived from a single headspace injection.
Visualization of Methodologies and Workflows
DHS-VTT Operational Workflow
MHE-SIFT-MS Simplified Workflow
The Scientist's Toolkit: Essential Research Reagents and Materials
Table 3: Key Reagents and Materials for Modern MHE Experiments
| Item | Function / Application | Examples / Specifications |
|---|---|---|
| Sorbent Materials | Traps and concentrates volatile compounds from the headspace. | Various polymers for ITEX; Multiwalled carbon nanotubes; Polystyrene-divinylbenzene [10] [20]. Choice depends on target molecule. |
| MHE Automation Module | Automates the entire MHE process (sampling, purging, re-equilibration, injection). | PAL System Multiple Headspace Extraction Module [18]. |
| Specialized Autosampler | Handles sample vials and integrates with the analyzer for high-throughput. | Multipurpose autosampler (e.g., Gerstel MPS Robotic Pro) equipped with a purge tool [5]. |
| SIFT-MS Instrument | Enables rapid, chromatography-free analysis of headspace samples. | Voice200ultra or Syft Tracer models (Syft Technologies) using H3O+, NO+, and O2+• reagent ions [5]. |
| Headspace Vials | Contains the sample and provides a closed system for equilibrium. | Standard 20-mL vials with septa [5]. |
| Calibration Standards | For initial method development and calibration when not using MHE. | Pure analyte standards for preparing solutions, though MHE eliminates the need for matrix-matched standards [10] [5]. |
The journey of Multiple Headspace Extraction from its origins as discontinuous gas extraction to its current state as a highly automated and sophisticated technique demonstrates a consistent drive within analytical science to solve the persistent problem of matrix effects. The historical development, marked by the crucial integration with microextraction techniques like SPME and the revolutionary advent of full automation and direct mass spectrometry, has transformed MHE from a theoretically sound but cumbersome method into a practical, high-throughput solution. Modern implementations like DHS-VTT and MHE-SIFT-MS offer unparalleled sensitivity, speed, and reproducibility for quantifying volatiles in the most challenging matrices, from pharmaceuticals and food packaging to environmental samples. This evolution has firmly established MHE as an indispensable tool in the modern analytical laboratory, enabling researchers and drug development professionals to ensure product safety and quality with greater confidence and efficiency than ever before.
Multiple Headspace Extraction (MHE) establishes itself as a superior analytical technique specifically when confronting complex, solid, or semi-solid sample matrices where traditional calibration methods fail. This guide objectively compares MHE's performance against alternative methods, demonstrating its distinct advantages through experimental data for eliminating matrix effects—a critical challenge in pharmaceutical and material analysis. The evidence confirms that MHE provides robust, reproducible quantification where other techniques struggle, fundamentally transforming workflows for difficult-to-prepare samples.
In analytical chemistry, matrix effects present a formidable obstacle, particularly for gas chromatography (GC) analysis of volatile compounds in complex solid or semi-solid samples. Matrix effects occur when components of the sample other than the analyte alter the analytical measurement, leading to inaccurate quantification [21]. For solid samples like polymers, gels, and powdered drug products, preparing matrix-matched calibration standards is often difficult or impossible because the matrix interactions cannot be reliably reproduced [5] [22].
Multiple Headspace Extraction (MHE) is a specialized technique designed to overcome this fundamental limitation. Unlike standard static headspace analysis, MHE is a stepwise process that performs consecutive extractions from the same sample vial. The peak areas from these extractions are plotted and mathematically extrapolated to calculate the total area representing exhaustive extraction, thereby eliminating the influence of the sample matrix on quantification [23] [24]. This protocol allows for quantification using external solvent standards without needing a matching matrix, simplifying method development and validation significantly.
Direct Performance Comparison: MHE vs. Alternative Techniques
Experimental data from various fields consistently demonstrate the superior performance of MHE in handling complex matrices. The table below summarizes key quantitative findings.
Table 1: Quantitative Performance Comparison of MHE-Based Methods vs. Alternatives
| Application & Method | Key Performance Metrics | Comparative Advantage |
|---|---|---|
| Volatile Impurities (Drugs/Packaging)MHE-SIFT-MS [5] | Throughput: 12 samples/hourRepeatability: <2.5% RSDCalibration Stability: ≥4 weeks | 8-fold throughput gain vs. MHE-GC; enables analysis without derivatization. |
| Residual Solvents (Solid Drug)MHS-SDME-GC-FID [23] | Direct analysis of solid drug product; eliminates matrix effect; good agreement with traditional dissolution method. | Overcomes disadvantages of direct injection (contamination) and SPME (carryover, cost); "solvent-free, cheap, sensitive". |
| Volatile Compounds (Macroalgae)MHSSE-GC-MS [25] | Linearity: R² > 0.99Precision (Inter-day): 0.22-19.01% RSDLOD: <1 μg/L for most compounds | First solvent-free, reliable quantitative method applicable to all macroalgae species, overcoming marked matrix differences. |
| Aroma Components (Mushrooms)MHS-SPME-GC/MS [24] | Simultaneous quantification of 20 volatile compounds; superior sensitivity and precision vs. other MHE techniques. | Provides "adequate technique to avoid matrix effects in complex samples quantitation" where no blank samples are available. |
Beyond the data in Table 1, MHE demonstrates decisive advantages in specific scenarios:
- Analysis of Residual Monomers in Polymers: MHE-GC/MS allows for direct analysis of polymers like PMMA and polycarbonate without solvent dissolution. One study achieved a simple workflow requiring only 30 minutes of thermostatting, successfully quantifying Methacrylic acid methyl ester (MMA) at 1726 μg/kg in a PMMA sample [22].
- Handling Complex Excipients: For challenging matrices like polyethylene glycol-based gelucire, MHE-SIFT-MS successfully quantified mutagenic impurities like formaldehyde without any derivatization or preconcentration, a task problematic for chromatographic methods [5].
Ideal Use Cases: When MHE is the Unambiguous Choice
MHE is the superior analytical choice in the following scenarios, supported by experimental evidence:
Solid Samples with Intractable Matrices
When analyzing volatile residues or components in polymers, gels, solid pharmaceuticals, and foodstuffs, MHE is unparalleled. For instance, quantifying styrene in polystyrene pellets [5] [22] or volatile aromas in mushrooms [24] is ideal for MHE because creating a blank or standard-identical matrix is virtually impossible. The technique's design mathematically compensates for the different release kinetics of the analyte from the matrix.
Requirement for High-Throughput, Routine Analysis
The combination of MHE with modern, fast analysis techniques like Selected Ion Flow Tube Mass Spectrometry (SIFT-MS) transforms MHE from a cumbersome R&D tool into a practical routine method. One study showed that scheduling samples in parallel with SIFT-MS analysis taking less than two minutes per injection enabled an eightfold throughput enhancement compared to a conventional GC method [5].
Need for Maximum Sensitivity with Minimal Sample Preparation
MHE techniques coupled with sensitive detection like MS and microextraction approaches (e.g., Single-Drop Microextraction, SDME) offer low limits of detection with minimal solvent use. The MHS-SDME method, for example, uses only a 2 μL microdrop of solvent, making it an environmentally friendly and sensitive option for residual solvent analysis in solid drugs [23].
Detailed Experimental Protocols for Key Applications
This protocol is ideal for quality control of polymeric materials like those used in medical devices or packaging.
- Sample Preparation: Precisely weigh a solid polymer sample (e.g., ~0.7 g) into a 20 mL headspace vial. Crimp the vial shut immediately.
- Instrumental Conditions:
- Headspace (HS-40 Sampler): MHE mode; Oven: 180°C; Needle: 185°C; Transfer Line: 190°C; Thermostat Time: 30 min.
- Gas Chromatograph (Clarus 600): Elite-5MS column (30 m x 0.25 mm x 0.25 µm); Oven program: 40°C (4 min) to 160°C at 5°C/min, then to 260°C at 20°C/min.
- Mass Spectrometer (Clarus 600 T): Full-scan mode (m/z 45-350); Ion Source: 200°C.
- MHE Procedure: The automated system performs consecutive extractions (e.g., 5 steps). After each equilibration and injection, the vial is vented and prepared for the next extraction.
- Quantification: The total peak area is calculated by extrapolating the exponential decay of peak areas from the sequence of injections, often using a provided Excel macro. Concentration is determined by comparison against a total vaporization standard.
This protocol highlights a direct, non-chromatographic approach for a challenging analyte.
- Sample Preparation: The gelucire excipient is placed directly into a headspace vial.
- Instrumental Conditions:
- Headspace: Automated using a Gerstel MPS Robotic Pro autosampler.
- SIFT-MS (Voice200ultra or Syft Tracer): Uses H3O+, NO+, and O2+• reagent ions for soft chemical ionization.
- MHE Procedure: Multiple headspace injections are performed on a single sample. The SIFT-MS instrument analyzes the headspace in real-time (analysis <2 minutes).
- Quantification: The calibration factor derived from a full MHE analysis was shown to be stable for at least four weeks. This allows for quantitative analysis from a single headspace injection during that period, boosting throughput to 12 samples per hour.
The Scientist's Toolkit: Essential Research Reagents & Materials
Table 2: Key Reagents and Materials for MHE Experiments
| Item | Function / Application | Example from Literature |
|---|---|---|
| Headspace Vials (20 mL) | Container for solid/semi-solid samples, withstands pressure and temperature. | Used universally across all cited studies [5] [23] [22]. |
| Dimethyl Sulfoxide (DMSO) | Extraction solvent in Single-Drop Microextraction (SDME). | Used as a 2 μL microdrop for extracting methanol and ethanol from solid drug product [23]. |
| SIFT-MS Instrument | Provides rapid, chromatography-free analysis for high-throughput MHE. | Voice200ultra or Syft Tracer models used for volatile impurities [5]. |
| Headspace Sorptive Extraction (HSSE) Twister | A stir bar coated with PDMS for sorptive extraction from headspace. | A 20 mm Twister was optimized for extracting volatiles from macroalgae [25]. |
| Polymer Reference Materials | Solid samples for method development and validation. | Polymethyl methacrylate (PMMA) and polycarbonate used for monomer analysis [22]. |
Workflow and Decision Pathway
The following diagram illustrates the logical decision process for selecting MHE and its core operational workflow.
Diagram 1: Decision pathway for MHE selection
The operational workflow for a typical MHE analysis is outlined below.
Diagram 2: Generalized MHE experimental workflow
Multiple Headspace Extraction proves to be the superior analytical choice when quantification of volatiles in complex solid or semi-solid matrices is required. Its fundamental ability to eliminate matrix effects mathematically, without exhaustive physical extraction, provides a level of accuracy and reliability that alternative methods cannot guarantee under these conditions. Supported by robust experimental data, MHE—especially when coupled with modern, rapid detection systems—offers a viable, high-throughput solution for challenging applications in pharmaceutical, polymer, and food science research. Its utility is most pronounced in ideal use cases involving intractable matrices, the need for routine analysis, and situations demanding minimal sample preparation with high sensitivity.
From Theory to Practice: Implementing MHE Methods for Pharmaceutical and Biomedical Analysis
Multiple Headspace Extraction (MHE) is an automated, stepwise quantitative analytical technique used in static headspace gas chromatography (GC) for analyzing volatile and semi-volatile compounds in complex, solid, or difficult matrices where traditional calibration methods are problematic [10] [26]. Conventional headspace analysis relies on matrix-matched calibration standards, which are often impossible or prohibitively difficult to prepare for solid samples such as polymers, pharmaceutical products, insoluble materials, and environmental samples like soil [5] [22] [26]. MHE overcomes this fundamental limitation by eliminating the matrix effect through a series of sequential headspace extractions from the same sample vial, enabling absolute quantitation without requiring identical matrix standards [10] [27].
The technique, originally termed "discontinuous gas extraction" by Kolb and Pospisil in 1977 and later renamed MHE, is founded on rigorous theoretical principles that describe the exponential decrease of analyte concentration in the headspace with each successive extraction step [10] [27]. By mathematically extrapolating this decay curve, analysts can determine the total original amount of analyte present in the sample, effectively mimicking an exhaustive extraction without physically completing the process [27] [26]. This makes MHE particularly valuable for quality control in polymer manufacturing, pharmaceutical analysis, environmental testing, and food packaging research where accurate quantitation of residual solvents, monomers, or impurities is critical [28] [22].
Theoretical Foundation of MHE
Fundamental Principles
The theoretical foundation of MHE treats the stepwise extraction process as a first-order reaction, where the peak area of the analyte decreases exponentially with each successive extraction step [27]. This relationship can be expressed mathematically as:
A~i~ = A~1~ · e^(-k(i-1)^)
Where A~i~ is the peak area obtained in the ith extraction, A~1~ is the peak area from the first extraction, and k is the decay constant [27]. In practice, this exponential relationship is transformed into a linear equation by plotting the logarithm of peak area against the extraction number:
ln A~i~ = ln A~1~ - k(i-1)
The total amount of analyte present in the original sample is proportional to the sum of the geometric progression of all infinite extraction steps, which can be calculated from the intercept (A~1~) and slope (k) of this linear plot [27]. The extrapolated total peak area (A~∞~) is given by:
A~∞~ = A~1~ / (1 - e^(-k))
This theoretical framework enables the complete quantification of analytes in solid or complex matrices through a limited number of extraction steps (typically 3-5), significantly reducing analysis time while maintaining accuracy [22] [27].
Critical Parameters Affecting MHE
Several analytical parameters significantly influence the effectiveness and accuracy of MHE quantification. The partition coefficient (K), defined as K = c~s~ / c~G~ (where c~s~ is the concentration in the sample phase and c~G~ is the concentration in the gas phase), determines how readily an analyte partitions between the matrix and headspace [28]. For successful MHE analysis, conditions must be optimized to minimize K, thereby increasing the proportional amount of volatile targets in the gas phase [28].
The phase ratio (β) represents the relative volumes of the gas and liquid/solid phases in the vial (β = V~G~/V~S~) and significantly impacts detector response [28]. A best practice is to maintain at least 50% headspace in the vial, with larger vial sizes (20-mL instead of 10-mL) allowing greater sample volumes and potentially improved sensitivity [28].
Temperature profoundly affects the partition coefficient, with higher temperatures generally decreasing K values and increasing the amount of analyte in the headspace [28]. However, the maximum oven temperature should typically remain approximately 20°C below the solvent boiling point to prevent excessive water vapor pressure from interfering with analysis [28].
MHE Theoretical Workflow and Calculation Process
Comparative Performance: MHE vs. Alternative Techniques
Method Comparison Table
The selection of an appropriate extraction and analysis technique depends on the sample matrix, target analytes, and required sensitivity. The following table compares the key characteristics of MHE with other common approaches for analyzing volatiles in complex matrices.
| Method | Optimal Matrix Types | Quantitation Approach | Sensitivity | Matrix Effects | Key Limitations |
|---|---|---|---|---|---|
| Multiple Headspace Extraction (MHE) | Solids, complex matrices (polymers, pharmaceuticals), insoluble samples [10] [26] | Absolute quantitation via mathematical extrapolation [27] | Good for most residual solvents/monomers [22] | Eliminates matrix effects through calculation [10] | Not suitable for highly soluble analytes; requires multiple injections [26] |
| Static Headspace (SHA) | Simple liquid samples, compatible matrices [29] | Matrix-matched calibration or standard addition [30] | Moderate | Significant for complex matrices [30] | Cannot handle strong matrix effects in solids [10] |
| Purge and Trap (Dynamic Headspace) | Aqueous samples, trace-level volatiles [29] | External calibration | Excellent (ppt-ppb) [29] | Moderate | Complex instrumentation; not ideal for solids; moisture issues [29] |
| Headspace-SPME | Environmental samples, trace analysis [31] | External calibration with careful matrix matching | Excellent for traces [31] | Significant for solid matrices | Fiber saturation; competition effects; not easily automated for MHE [10] |
| Solvent Extraction | Broad range (solids, liquids) [31] | External calibration | Good for higher concentrations [31] | Minimal with exhaustive extraction | Extensive preparation; solvent use; not volatile-specific [31] |
Performance Data Comparison
Experimental data from comparative studies demonstrates the relative strengths and limitations of each technique for specific applications.
Analysis of Soil Fumigants in Environmental Samples [31]:
| Method | Recovery (%) | Precision (RSD%) | Limit of Detection | Suitability |
|---|---|---|---|---|
| HS-SPME | 72-104% | 1.3-17% | 0.09-2.52 μg/kg | Trace analysis |
| Solvent Extraction | 76-103% | 0.8-11% | 5.8-29.2 μg/kg | Higher concentration levels (0.05-5 μg/g) |
Analysis of Volatile Impurities in Consumer Products [30]:
| Method | Runtime per Sample | Time to First Result | Throughput Advantage | Matrix Versatility |
|---|---|---|---|---|
| MHE with SIFT-MS | < 5 minutes | ~16 minutes | 2.9-fold increase vs. GC | Excellent for emulsions, lotions, diverse PCPs |
| MHE with GC-MS | ~30 minutes | >45 minutes | Baseline | Limited by chromatography time |
MHE Applications Across Industries
The unique advantages of MHE make it particularly valuable for specific industrial applications where solid or complex matrices dominate.
Pharmaceutical Industry: MHE is used for residual solvent analysis in active pharmaceutical ingredients (APIs) and finished dosage forms, particularly for insoluble drug compounds where matrix-matched standards are impossible to prepare [5] [26]. The technique has been successfully applied to analyze volatile impurities like N-nitrosodimethylamine (NDMA) in ranitidine products and formaldehyde in gelucire excipients [5].
Polymer Manufacturing: Quality control of residual monomers in finished polymers represents a classic MHE application [22]. The method has been effectively used to quantify methyl methacrylate (MMA) in polymethyl methacrylate (PMMA) and styrene in polystyrene, critical for ensuring product safety and compliance [22] [26].
Food Packaging and Materials: MHE enables analysis of volatile migrants from packaging materials into food simulants and determination of water vapor transmission rates in cellulose-based papers [32]. The technique has been applied to study flavor absorption into plastic packaging materials and residual solvents in printed plastic films [10] [26].
Environmental Analysis: While less common than other techniques, MHE has been used for quantitative analysis of volatiles in soil samples and environmental pollutants where matrix effects complicate traditional headspace analysis [10].
Detailed MHE Methodology Workflow
Sample Preparation Protocol
Proper sample preparation is critical for successful MHE analysis. The specific protocol varies by matrix type but follows these fundamental principles.
For Solid Polymer Samples (e.g., PMMA for MMA analysis) [22]:
- Weighing: Accurately weigh 0.5-1.0 g of representative sample into a headspace vial (typically 10-20 mL capacity)
- Solvent Addition: Add a small volume (10-20 μL) of high-boiling solvent (e.g., dimethyl sulfoxide or N,N-dimethylformamide) to facilitate analyte release through surface modification [26]
- Sealing: Immediately crimp the vial with a PTFE-faced septum cap to prevent loss of volatiles
- Matrix Consideration: Ensure sample particle size is reduced (e.g., ground or cryomilled) to increase surface area and improve extraction efficiency
For Pharmaceutical Products (e.g., ranitidine tablets) [5]:
- Homogenization: Powder tablets using a mortar and pestle or mechanical grinder
- Weighing: Transfer an appropriate amount (typically 0.1-0.5 g) to a headspace vial
- Solvent Addition (optional): Add solvent if needed to facilitate release of analytes from the matrix
- Sealing: Crimp vial immediately to prevent contamination or loss of volatiles
Quality Control Measures:
- Analyze samples in triplicate to ensure methodological precision
- Include method blanks (empty vials or vials with solvent only) to monitor contamination
- Use internal standards when appropriate, though this is less common in MHE than traditional headspace
Instrumentation and Equipment Configuration
Modern MHE analysis requires specialized instrumentation configured for automated, sequential headspace extraction.
Headspace Sampler Configuration (based on TurboMatrix HS-40) [22]:
- Oven Temperature: 180°C (optimized for polymer analysis)
- Needle Temperature: 185°C (5°C above oven temperature to prevent condensation)
- Transfer Line Temperature: 190°C (maintained above oven temperature)
- Thermostat Time: 30 minutes (equilibration time)
- Vial Pressurization: 160 kPa for 2 minutes
- Injection Parameters: 0.2 min withdraw time, 0.03 min injection time
- Vial Venting: Enabled between cycles to release pressure and remove a portion of headspace
Gas Chromatography Conditions (for monomer analysis) [22]:
- Column: Elite-5MS (30 m × 0.25 mm × 0.25 μm) or equivalent mid-polarity stationary phase
- Injection Port: 200°C, split mode (split ratio typically 10:1 to 20:1)
- Carrier Gas: Helium, constant pressure (80 kPa) or flow (1.0-1.5 mL/min)
- Oven Program: 40°C (hold 4 min), ramp at 5°C/min to 160°C (hold 5 min), then 20°C/min to 260°C (hold 2 min)
Detection System:
- Mass Spectrometer: Full scan mode (m/z 45-350) for qualitative confirmation [22]
- Alternative Detectors: Flame ionization detector (FID) for routine quantitation of hydrocarbons
- Tune Parameters: Ion source temperature 200°C, transfer line 180°C [22]
Step-by-Step MHE Analytical Procedure
MHE Step-by-Step Analytical Procedure
Data Processing and Mathematical Extrapolation
The quantitative power of MHE resides in the mathematical treatment of the sequential extraction data. The step-by-step calculation process proceeds as follows.
Data Collection:
- Record peak areas for each extraction (A~1~, A~2~, A~3~...A~n~)
- Ensure peak identification is consistent across all extractions
- Verify that the peak area decrease follows an approximately exponential pattern
Linear Regression Analysis:
- Transform Data: Calculate natural logarithm of each peak area: ln(A~1~), ln(A~2~), ln(A~3~)...ln(A~n~)
- Plot Data: Graph ln(A~i~) versus extraction number (i-1)
- Calculate Regression: Determine the slope (-k) and y-intercept (lnA~1~) of the best-fit line
- Validate Linearity: Confirm correlation coefficient (R²) > 0.99 to ensure method validity [26]
Total Area Calculation:
- Apply the formula: A~∞~ = A~1~ / (1 - e^(-k))
- Where A~∞~ represents the total peak area corresponding to complete extraction of the analyte
Concentration Determination:
- Compare A~∞~ (sample) to A~∞~ (vaporized external standard)
- Calculate sample concentration using: Concentration~sample~ = (A~∞,sample~ / A~∞,standard~) × (Amount~standard~ / Weight~sample~)
Practical Calculation Example (MMA in PMMA) [22]: A~1~ = 150,000, A~2~ = 75,000, A~3~ = 37,500 (demonstrating perfect halving with each extraction) Decay constant k = ln(150,000/75,000) = 0.693 A~∞~ = 150,000 / (1 - e^(-0.693)) = 150,000 / (1 - 0.5) = 300,000
Essential Research Reagents and Materials
The Scientist's Toolkit for MHE Analysis
Successful implementation of MHE methodology requires specific reagents, materials, and instrumentation. The following table details the essential components of a complete MHE research system.
| Category | Specific Items | Function/Purpose | Selection Criteria |
|---|---|---|---|
| Sample Containment | 10-20 mL headspace vials [28] | Contain sample during incubation/injection | Certified volatile-free; appropriate volume for sample size |
| PTFE/silicone septa caps [28] | Maintain seal during heating/pressurization | Low background; minimal adsorption properties | |
| Crimping tool | Secure septum to vial | Proper seal formation without damaging vial | |
| Calibration Standards | High-purity analyte standards [22] | Preparation of vaporized external standards | Certified purity; appropriate solvent compatibility |
| High-boiling solvents (DMSO, DMF) [26] | Standard preparation and sample modification | Low volatility; high purity; effective extraction enhancement | |
| Instrumentation | Automated headspace sampler [22] | Precise temperature control and automated injections | MHE software capability; temperature stability |
| GC with detector (MS, FID) [22] | Separation and detection of volatiles | Appropriate sensitivity for target analytes | |
| Mid-polarity GC column [22] | Separation of volatile compounds | Compatible with analytes; low bleed characteristics | |
| Sample Processing | Analytical balance | Accurate sample weighing | 0.1 mg precision or better |
| Sample homogenizer | Particle size reduction for solids | Reproducible particle size; minimal heating |
Advanced Applications and Recent Developments
MHE Coupled with Novel Detection Techniques
Recent advancements in detection technologies have expanded MHE applications and improved workflow efficiency.
MHE with Selected Ion Flow Tube Mass Spectrometry (SIFT-MS): The combination of MHE with SIFT-MS technology represents a significant advancement in throughput and workflow efficiency [5]. This approach transforms MHE into a more cost-effective analytical approach because headspace analysis is substantially faster than conventional GC methods [5]. Key advantages include:
- Rapid Analysis: Direct static headspace analysis using SIFT-MS can take less than two minutes per injection compared to 20-30 minutes for GC methods [5]
- Enhanced Throughput: Efficient sample scheduling enables analysis of multiple samples in parallel, with up to 8-fold throughput enhancement compared to equivalent GC methods [5]
- Stable Calibration: MHE-SIFT-MS calibrations demonstrate remarkable stability, remaining valid for at least four weeks in formaldehyde analysis of gelucire excipient [5]
MHE with Solid-Phase Microextraction (MHS-SPME): The combination of multiple headspace extraction with solid-phase microextraction extends the application of SPME to quantitative determination of analytes in complex solid matrices [10]. This hybrid approach offers several advantages:
- Enhanced Sensitivity: SPME's concentrating effect improves detection limits for trace analysis
- Solvent-Free Operation: Eliminates organic solvent consumption
- Application Range: Successfully applied to environmental samples, polymer products, and food packaging materials [10]
Innovative Applications Beyond Traditional Boundaries
MHE methodology continues to expand into novel application areas that demonstrate its versatility.
Water Vapor Transmission Rate (WVTR) Determination: Researchers have successfully applied MHE-GC to determine the water vapor transmission rate of cellulose-based papers, providing a rapid alternative to traditional cup methods [32]. This innovative application demonstrates:
- Excellent Precision: Relative standard deviation < 3.49%
- High Efficiency: Significant time savings compared to conventional methods requiring >8 hours per sample [32]
- Batch Capability: Suitable for high-throughput analysis of multiple samples
Process Kinetics Studies: MHE has been employed to study process kinetics, leveraging its ability to monitor release rates from solid matrices over multiple extraction cycles [10]. This application provides valuable information about:
- Release Profiles: Quantitative data on how compounds migrate from matrices over time
- Temperature Effects: Kinetic parameters at different temperatures
- Formulation Optimization: Data to guide development of controlled-release systems
Method Validation and Quality Assurance
Robust method validation is essential for implementing reliable MHE analyses in regulated environments.
Precision and Accuracy:
- Repeatability: Typical relative standard deviations of 2-5% for well-optimized methods [22]
- Intermediate Precision: Consistent results across different analysts, instruments, and days
- Accuracy Validation: Comparison with exhaustive extraction methods or standard reference materials when available
Linearity and Range:
- MHE Plot Linearity: Correlation coefficient (R²) > 0.99 for ln(area) versus extraction number plot [26]
- Concentration Range: Demonstrated applicability over 1-2 orders of magnitude for aldehydes in aqueous solution [5]
Limit of Quantitation (LOQ):
- Method-Specific LOQ: Varies by analyte and matrix; typically low ng/g to μg/g range [5]
- Verification: Analysis of samples at LOQ concentration with acceptable precision and accuracy
Multiple Headspace Extraction represents a powerful solution for one of analytical chemistry's persistent challenges: accurate quantitation of volatile compounds in solid and complex matrices. By combining rigorous theoretical foundations with practical automated instrumentation, MHE eliminates the need for impossible matrix-matched standards while providing absolute quantification through mathematical extrapolation. The technique has proven particularly valuable in pharmaceutical quality control, polymer manufacturing, and materials science where traditional calibration approaches fail.
Recent advancements, particularly the integration of MHE with rapid detection technologies like SIFT-MS, have addressed traditional throughput limitations while maintaining the fundamental advantages of the technique. The continued expansion of MHE applications into areas such as water vapor transmission rate determination and process kinetics studies demonstrates the methodology's ongoing relevance and adaptability. For researchers and analysts working with difficult matrices, MHE remains an indispensable tool in the analytical arsenal, providing robust quantitative data where other techniques fall short.
Multiple Headspace Extraction (MHE) is a powerful quantitative technique for analyzing volatile impurities in complex, condensed-phase matrices where preparing matrix-matched calibration standards is challenging or impossible [5]. By performing a series of sequential headspace extractions from the same sample, MHE enables the quantification of total analyte content through mathematical extrapolation, eliminating the need for identical standard matrices [5]. However, conventional MHE can be time-consuming when coupled with chromatographic techniques, creating bottlenecks in analytical workflows.
The integration of microextraction techniques with MHE presents a transformative approach to enhance sensitivity, reduce analysis time, and expand application ranges. Solid-Phase Microextraction (SPME) and Single-Drop Microextraction (SDME) offer complementary advantages when used as the initial extraction and concentration step prior to MHE quantification. SPME utilizes a coated fiber to extract and concentrate analytes, while SDME employs a single micro-liter-sized solvent drop for the same purpose [33] [34]. This guide provides an objective comparison of these synergistic approaches, supported by experimental data and detailed protocols to inform researchers, scientists, and drug development professionals.
Fundamental Principles and Comparative Advantages
Multiple Headspace Extraction (MHE) Fundamentals
MHE operates on the principle of stepwise gas-phase extraction from a condensed sample. In each extraction cycle, a portion of the volatile analytes is removed from the headspace, causing the system to re-equilibrate. The analyte concentration in each subsequent headspace measurement decreases exponentially. By measuring this decay rate over multiple extractions, the total original analyte mass in the sample can be calculated without exhaustive extraction [5]. The relationship is expressed as:
A = A₁ / (1 - e⁻ᵏ)
Where A is the total peak area, A₁ is the peak area of the first extraction, and k is the exponential decay constant.
Traditional MHE implementation with gas chromatography (GC) has been limited by lengthy analysis times, but recent advances with direct mass spectrometry techniques like Selected Ion Flow Tube Mass Spectrometry (SIFT-MS) have significantly accelerated this process [5].
Solid-Phase Microextraction (SPME) Synergy with MHE
SPME brings several advantageous characteristics to MHE workflows. As a solvent-free technique that integrates sampling, extraction, and concentration into a single step, SPME significantly simplifies sample preparation while reducing chemical waste [33] [35]. The principle involves partitioning analytes between the sample matrix and a stationary phase coated on a fiber or other support, followed by thermal or solvent desorption into an analytical instrument [36].
Different SPME geometries offer distinct advantages. Traditional fiber-based SPME provides versatility and ease of automation, while newer formats like SPME-Arrow offer enhanced sensitivity due to larger sorbent volumes [37]. Thin-Film SPME (TF-SPME) further increases the extraction phase volume and surface area, significantly improving sensitivity and extraction efficiency for a wider range of analytes, particularly benefiting polar compounds [38]. The extracted amount in SPME is directly proportional to the surface area of the extracting phase, as described by:
dn/dt = Cₛ × D × A / δ
Where dn/dt is the extraction rate, Cₛ is the analyte concentration in the sample, D is the diffusion coefficient, A is the surface area, and δ is the boundary layer thickness [38].
Single-Drop Microextraction (SDME) Synergy with MHE
SDME represents a minimalist approach to liquid-phase microextraction, where a single micro-liter-sized drop of organic solvent suspended from a syringe needle is used to extract analytes from aqueous or headspace samples [34]. This technique provides exceptional green chemistry credentials by reducing organic solvent consumption by up to 99% compared to traditional liquid-liquid extraction [39].
SDME operates in several configurations. Direct Immersion (DI-SDME) involves suspending the solvent drop directly in the aqueous sample, while Headspace (HS-SDME) exposes the drop to the vapor phase above the sample, particularly beneficial for volatile analytes or complex matrices [39]. Three-phase SDME enables extraction through an organic phase into an aqueous acceptor phase, ideal for ionizable compounds [34]. The enrichment factor in SDME is influenced by drop volume, extraction time, and partition coefficients, with the amount extracted determined by:
n = (Kₒₐ × Vₒ × Cₐq × Vₐq) / (Kₒₐ × Vₒ + Vₐq)
Where n is the moles of analyte extracted, Kₒₐ is the distribution coefficient, Vₒ is the drop volume, Cₐq is the initial aqueous concentration, and Vₐq is the aqueous sample volume [34].
Table 1: Fundamental Characteristics of Microextraction Techniques for MHE Enhancement
| Parameter | SPME | SDME | Traditional MHE |
|---|---|---|---|
| Principle | Partitioning to solid sorbent | Partitioning to liquid solvent | Equilibrium partitioning between matrix and headspace |
| Solvent Consumption | Solvent-free (thermal desorption) | Typically 1-10 μL | Requires carrier gas, no liquid solvents |
| Extraction Phase | Polymer-coated fiber/thin film (PDMS, CAR/DVB, HLB) | Organic solvent drop (octanol, toluene, etc.) | Headspace gas |
| Primary Advantage in MHE | High concentration capacity, fiber reusability | Exceptional matrix clean-up, simple apparatus | Absolute quantification without standards |
| Limitation in MHE | Possible competitive adsorption, fiber cost | Drop instability, limited volume | Time-consuming multiple cycles required |
Performance Comparison and Experimental Data
Extraction Efficiency and Sensitivity
Comparative studies demonstrate significant performance differences between SPME geometries and SDME approaches. Research on volatile per- and polyfluoroalkyl substances (PFAS) revealed that SPME-Arrow devices provided enhanced sensitivity and broader linear dynamic ranges for fluorotelomer alcohols like 1H,1H,2H,2H-perfluoro-1-hexanol (4:2 FTOH), while traditional SPME fibers showed improved response for hydrophobic, semi-volatile analytes such as N-methylperfluorooctanesulfonamideethanol (MeFOSE) with detection limits as low as 0.005 μg L⁻¹ [37].
A comprehensive comparison of SPME formats for food odorant analysis demonstrated the superior performance of Thin-Film SPME with HLB/PDMS coating, which consistently outperformed both traditional SPME fibers and Stir Bar Sorptive Extraction (SBSE) across all 11 tested compounds [38]. TF-SPME showed particularly notable advantages for polar substances such as acetic acid, butanoic acid, and 2,3-butanedione, and was the only method capable of detecting methional in the standard mixture.
SDME has demonstrated remarkable sensitivity in pharmaceutical applications, with researchers achieving lower limits of detection for various drug compounds in biological fluids, often at nanogram per milliliter levels or lower [39]. The integration of nanoparticles and ionic liquids in SDME has further enhanced selectivity and sensitivity toward trace-level target analytes [34].
Table 2: Quantitative Performance Comparison of Microextraction Techniques
| Technique | Target Analytes | Linear Range | LOD/LOQ | Matrix | Reference |
|---|---|---|---|---|---|
| SPME-Fiber | MeFOSE | Not specified | LOD: 0.005 μg L⁻¹ | Water | [37] |
| SPME-Arrow | 4:2 FTOH | Broader dynamic range | Not specified | Water | [37] |
| TF-SPME (HLB) | 11 key food odorants | Not specified | Significantly lower than fibers/SBSE | Water/Food | [38] |
| SDME | Pharmaceutical compounds | Varies by analyte | Often ng mL⁻¹ or lower | Biological fluids | [39] |
| HS-SPME-GC-MS | VOCs from Trichosanthes anguina L. | Not specified | Suitable for plant VOC profiling | Plant material | [33] |
Analysis Time and Throughput Considerations
The combination of microextraction with MHE significantly impacts analysis throughput. Traditional MHE with GC requires lengthy cycle times, but the integration of SIFT-MS has transformed this approach, reducing headspace analysis to under two minutes per extraction [5]. This acceleration enables practical MHE implementation, with one study demonstrating an eightfold throughput enhancement compared to equivalent GC methods for polystyrene analysis [5].
SPME extraction times typically range from 15-60 minutes, depending on analyte volatility and matrix, but the technique's ability to be automated compensates for this in high-throughput environments [33]. SDME extraction times are generally shorter (5-30 minutes), though the technique is more challenging to automate and may require closer supervision to maintain drop integrity [39].
Application-Specific Performance
The choice between SPME and SDME for MHE enhancement depends strongly on the specific application and analyte properties:
Pharmaceutical Applications: SDME excels in drug isolation from complex biological matrices like serum, urine, and pharmaceutical formulations, providing exceptional matrix clean-up and concentration capabilities [39]. SPME has proven valuable for residual solvent analysis in drug products and packaging materials, with HS-SPME particularly effective for volatile impurities [5] [35].
Environmental Monitoring: SPME shows superior performance for environmental pollutants in water, air, and soil samples, with both fiber and TF-SPME formats successfully applied to pesticides, VOCs, and neutral PFAS compounds [33] [37]. The solvent-free nature of SPME aligns well with green analytical chemistry principles in environmental applications [35].
Food and Flavor Analysis: TF-SPME demonstrates clear advantages for complex odorant profiling in food matrices, efficiently extracting compounds across a wide polarity range without requiring derivatization or salting-out strategies [38]. The larger sorption area of TF-SPME significantly enhances sensitivity for both polar and non-polar aroma compounds compared to traditional fibers or SDME.
Detailed Experimental Protocols
SPME-MHE Workflow for Volatile Impurities in Pharmaceuticals
This protocol outlines the determination of volatile impurities in drug products using SPME coupled with MHE-SIFT-MS, based on validated approaches for formaldehyde in gelucire excipient and NDMA in ranitidine products [5].
Materials and Equipment:
- SPME fibers (CAR/PDMS recommended for VOCs) or TF-SPME devices
- Automated SIFT-MS instrument with MHE capability
- Headspace vials (20 mL)
- Multipurpose autosampler (e.g., Gerstel MPS Robotic Pro)
- Temperature-controlled agitation system
Procedure:
- Sample Preparation: For solid samples, use precisely weighed powder (typically 100-500 mg). For semi-solids like gelucire, use small, consistently shaped pieces.
- Equilibration: Place samples in headspace vials, seal immediately, and incubate at optimized temperature (e.g., 140°C for polystyrene) for 30-60 minutes.
- SPME Extraction: Expose the SPME fiber or thin film to the headspace for 15-45 minutes with continuous agitation (600 rpm cycloid-shaped agitator recommended [37]).
- MHE Cycling: After initial SIFT-MS analysis, purge the vial for 1-2 minutes with inert gas, then re-equilibrate for the same duration as the initial equilibration.
- Repeat Extraction: Perform subsequent SPME extractions from the same sample vial (typically 3-6 cycles total).
- Data Analysis: Plot peak areas versus extraction number and perform exponential regression to determine total analyte content.
Critical Parameters:
- Maintain consistent vial headspace volume across all samples
- Optimize desorption temperature based on SPME coating limitations
- Use stable incubation temperatures (±1°C) for reproducible partitioning
SDME-MHE Protocol for Drug Compounds in Biological Fluids
This method details the application of SDME combined with MHE principles for quantifying drugs in serum or urine, adapting approaches from recent pharmaceutical analyses [39].
Materials and Equipment:
- High-precision microsyringe (5-10 μL capacity)
- Appropriate extraction solvent (e.g., octanol, toluene, or ionic liquids for polar analytes)
- Sample vials with minimal headspace
- Temperature-controlled stirring system
- HPLC or GC-MS system for analysis
Procedure:
- Sample Pretreatment: Adjust pH of biological samples to favor neutral form of target analytes. For plasma or serum, protein precipitation may be required prior to extraction.
- SDME Setup: Draw the selected solvent into the microsyringe (typically 1-3 μL), then expose a suspended drop to the sample headspace (HS-SDME) or immerse directly (DI-SDME).
- Extraction: Maintain extraction for 10-30 minutes with continuous stirring (300-600 rpm), ensuring drop stability.
- MHE Cycling: After withdrawal and analysis of the first drop, repeat the headspace equilibration and extraction process with fresh solvent drops for subsequent cycles.
- Withdrawal and Analysis: Retract the drop into the syringe and inject directly into HPLC or GC-MS systems.
- Quantification: Apply MHE mathematical models to extrapolate total analyte content from the decay curve of sequential extractions.
Optimization Considerations:
- For HS-SDME, sample temperature should balance volatility and drop stability
- Ionic strength adjustment can improve extraction efficiency for some analytes
- Additives like ion-pair reagents may enhance extraction of polar compounds
Diagram 1: SDME-MHE Workflow for Drug Analysis
Implementation Guide: Techniques Selection and Optimization
Technique Selection Framework
Choosing between SPME and SDME for MHE enhancement depends on multiple factors related to the analytical problem, matrix characteristics, and available resources:
Select SPME when:
- Analyzing a broad range of analyte polarities (especially with TF-SPME)
- Automation and high-throughput are priorities
- Solvent-free operation is essential
- Fiber reusability provides economic advantage
- Sample matrices are particularly complex or dirty
Select SDME when:
- Maximum matrix clean-up is required for complex biological samples
- Solvent consumption must be absolutely minimized
- Capital equipment budget is limited
- Analyzing relatively simple volatile or semi-volatile compounds
- Rapid method development is prioritized
Table 3: Technique Selection Guide Based on Application Requirements
| Application Requirement | Recommended Technique | Rationale | Key Optimization Parameters |
|---|---|---|---|
| Broad-range odorant profiling | TF-SPME with HLB/PDMS | Superior for both polar and non-polar compounds | Extraction time, temperature, film thickness |
| Trace-level drug quantification in plasma | HS-SDME or 3P-SDME | Exceptional matrix clean-up, high enrichment | pH adjustment, solvent selection, ionic strength |
| High-throughput environmental VOCs | Automated SPME-Arrow | Robustness, sensitivity, automation compatibility | Agitation type, desorption conditions |
| Volatile PFAS analysis | HS-SPME with CAR/PDMS | Optimal for volatile neutral PFAS | Sample temperature, extraction mode (HS vs DI) |
| Pharmaceutical residual solvents | HS-SPME with DVB/CAR/PDMS | Established methods, reliability | Incubation temperature, time, fiber coating |
Critical Optimization Parameters
Both SPME and SDME require careful optimization of several parameters to achieve optimal performance in MHE workflows:
For SPME-MHE:
- Coating Selection: Choose based on analyte polarity (PDMS for non-polar, PA for polar, CAR for volatiles, mixed coatings for broad range) [35] [38]
- Extraction Mode: Headspace (HS) preferred for complex matrices, Direct Immersion (DI) for improved efficiency [37]
- Agitation: Cycloid-shaped agitation at 600 rpm significantly enhances extraction efficiency for diffusion-limited compounds [37]
- Time and Temperature: Balance between extraction efficiency and potential competitive adsorption at longer times (>35 minutes) [37]
For SDME-MHE:
- Solvent Selection: Based on partition coefficients, volatility, and compatibility with analytical instrumentation [39]
- Drop Volume and Stability: Typically 1-3 μL, with optimization of stirring rates to prevent dislodgement [34]
- pH Adjustment: Critical for ionizable compounds to maximize extraction efficiency [39]
- Temperature Control: Affects both volatility and partition coefficients [34]
Integration with Modern Analytical Platforms
The synergy of microextraction with MHE reaches its full potential when integrated with advanced analytical platforms:
SIFT-MS Integration: The combination of SPME or SDME with SIFT-MS transforms MHE into a practical, high-throughput approach, enabling analysis of up to 12 samples per hour with weekly or monthly calibration stability [5].
Comprehensive Chromatography: SPME coupled with comprehensive two-dimensional GC×GC-TOFMS provides exceptional separation power for complex samples, as demonstrated in untargeted analysis of wheat beer volatiles [38].
Automation Platforms: Robotic autosamplers like the PAL System enable fully automated MHE workflows, minimizing human error and improving reproducibility for routine analysis [18].
Diagram 2: Microextraction Technique Selection Guide
The Scientist's Toolkit: Essential Research Reagents and Materials
Table 4: Essential Research Reagents and Materials for Microextraction-MHE Workflows
| Item | Function/Purpose | Application Notes | Key Suppliers/References |
|---|---|---|---|
| SPME Fibers | Extraction and concentration of analytes | Select coating based on analyte polarity: PDMS (non-polar), PA (polar), CAR/DVB (volatiles) | Supelco, CTC Analytics [33] [37] |
| TF-SPME Devices | Enhanced extraction efficiency via larger surface area | HLB/PDMS for broad polarity range; CAR/PDMS for volatiles; superior to fibers for polar compounds | [38] |
| SPME-Arrow | Improved sensitivity and robustness | Larger sorbent volume than traditional fibers; better for trace analysis | CTC Analytics [37] |
| Ionic Liquids | Green extraction solvents for SDME | Low volatility, tunable polarity; enhance selectivity and enrichment | [34] [39] |
| Deep Eutectic Solvents (DES) | Biodegradable solvent alternative for SDME | Low toxicity, customizable properties; green analytical chemistry | [34] |
| Molecularly Imprinted Polymers (MIPs) | Selective sorbents for target analytes | "Smart adsorbents" with molecular recognition; enhance selectivity in SPME | [33] |
| Carbon Mesh Supports | Substrate for TF-SPME devices | Provide stability and large surface area for sorbent coatings | [38] |
| SUPRAS | Supramolecular solvents for SDME | Ordered structures with multiple binding sites; improved extraction efficiency | [34] |
| Nanoparticles | Additives to enhance SDME performance | Improve mass transfer, selectivity, and enrichment factors | [34] [39] |
| Automated MHE Systems | High-throughput multiple headspace extraction | Enable practical implementation of MHE workflows; PAL System platforms | CTC Analytics, Gerstel [5] [18] |
The strategic synergy between microextraction techniques and Multiple Headspace Extraction represents a significant advancement in analytical methodology for complex matrices. Both SPME and SDME offer distinct advantages that complement and enhance the fundamental quantification capabilities of MHE.
SPME, particularly in its advanced TF-SPME and SPME-Arrow formats, provides robust, sensitive, and automatable solutions for a wide range of applications from pharmaceutical impurities to environmental contaminants. Its ability to extract compounds across a broad polarity range, coupled with solvent-free operation, makes it particularly valuable for modern analytical laboratories pursuing green chemistry principles.
SDME excels in scenarios requiring exceptional matrix clean-up, especially for biological samples, while minimizing solvent consumption to the microliter scale. Though more challenging to automate, its simplicity and effectiveness for targeted analyses make it a powerful tool for drug development and clinical applications.
The integration of these microextraction techniques with advanced detection platforms like SIFT-MS and comprehensive chromatography systems enables researchers to address increasingly complex analytical challenges. By understanding the comparative strengths and optimal application domains of each approach, scientists can develop more efficient, sensitive, and reliable methods for quantifying volatile and semi-volatile compounds in even the most challenging matrices.
Multiple Headspace Extraction (MHE) is a powerful quantitative analytical technique designed for complex solid and liquid matrices where preparing matrix-matched calibration standards is difficult or impossible. Originally developed for gas chromatography (GC), MHE theoretically calculates the total amount of analyte in a sample through a series of successive headspace extractions, effectively removing matrix effects that plague traditional headspace analysis [10]. Despite its quantitative strengths, conventional MHE has faced significant adoption barriers in routine analysis due to substantial time requirements. Each MHE analysis requires multiple extractions from the same sample vial—typically six to ten cycles of headspace purge and regeneration—making it prohibitively expensive and time-consuming for chromatographic techniques where run times are long [5].
Selected Ion Flow Tube Mass Spectrometry (SIFT-MS) is emerging as a transformative technology that addresses these throughput limitations. As a direct-injection mass spectrometry technique, SIFT-MS eliminates the chromatographic separation step that constrains traditional GC-based methods [40]. This fundamental difference in analytical approach enables SIFT-MS to overcome the critical throughput bottleneck in MHE workflows, potentially transforming it from a specialized method to a practical, routine analytical approach for challenging matrices in pharmaceutical, environmental, and consumer product analysis.
Fundamental Technology Comparison: SIFT-MS vs. Chromatographic Approaches
Operational Principles
Gas Chromatography-Based MHE: Traditional MHE relies on gas chromatography with various detectors (FID, MS) for separation and quantification. The technique involves placing a solid or complex liquid sample in a sealed headspace vial, allowing it to reach equilibrium, injecting a portion of the headspace into the GC system, then repeating this process multiple times after purging and re-equilibrating the vial [10]. The logarithmic decrease in analyte response across successive extractions is extrapolated to determine the total analyte content in the original sample.
SIFT-MS MHE: SIFT-MS operates on fundamentally different principles. It utilizes soft chemical ionization with rapidly switchable reagent ions (H₃O⁺, NO⁺, and O₂⁺• in standard configurations) to ionize volatile organic compounds directly in the gas phase [40]. This chromatography-free approach enables real-time, continuous analysis of headspace samples without separation. For MHE applications, the same sequential extraction process occurs, but each analysis takes minutes rather than tens of minutes because no chromatographic separation is required [5].
Key Differentiating Factors
The core distinction between these approaches lies in their analytical mechanisms. GC-based methods separate compounds temporally through column interactions before detection, while SIFT-MS separates compounds chemically through selective ion-molecule reactions and mass spectrometrically using mass-to-charge ratios [40]. This fundamental difference drives the significant throughput advantages observed in SIFT-MS implementations.
Throughput Performance: Comparative Experimental Data
Direct Analysis Time Comparisons
Experimental data from multiple studies demonstrates substantial throughput improvements when implementing MHE with SIFT-MS compared to conventional GC-based methods.
Table 1: Direct Analysis Time Comparison Between GC and SIFT-MS MHE Methods
| Analysis Parameter | GC-Based MHE | SIFT-MS MHE | Improvement Factor |
|---|---|---|---|
| Single MHE injection runtime | 20-45 minutes [5] [41] | 1.5-5 minutes [5] [42] | 4-11x faster |
| Full MHE analysis (6 extractions) | 3-4.5 hours | 30-60 minutes | 3-6x faster |
| Time to first result | 3+ hours | ~30 minutes | >6x faster |
| Daily sample throughput (full MHE) | ~5-7 samples | ~25-35 samples [5] | ~5x increase |
Enhanced Workflow Efficiency Through "MHE Calibration"
A particularly transformative advantage of SIFT-MS for MHE workflows is the stability of what has been termed "MHE calibration" [5]. Research has demonstrated that for consistent matrices, the correlation between the first headspace injection and the full MHE result remains stable for extended periods.
In one study focusing on formaldehyde analysis in Gelucire 44/14 excipient, this MHE calibration remained stable for at least four weeks, enabling quantitative analysis to proceed from a single headspace injection on any day within that period without requiring full MHE analysis [5]. This calibration stability, combined with faster analysis times, creates compounding throughput benefits.
Table 2: Workflow Efficiency Gains with SIFT-MS MHE Calibration
| Workflow Stage | Traditional GC-MHE | SIFT-MS with MHE Calibration | Throughput Impact |
|---|---|---|---|
| Method development | Full MHE for each new matrix | Full MHE to establish initial correlation | Equivalent time investment |
| Routine analysis | Full MHE for every sample (6-10 injections) | Single static headspace injection per sample | 6-10x fewer injections per sample |
| Calibration maintenance | Frequent recalibration required | Weekly or monthly verification [5] | Significant time savings |
| Daily throughput (routine phase) | ~5-7 samples | ~45-60 samples [5] | ~8x improvement |
Experimental Protocols and Methodologies
SIFT-MS MHE Protocol for Pharmaceutical Applications
A representative MHE-SIFT-MS protocol for analyzing N-nitrosodimethylamine (NDMA) in drug products demonstrates the practical implementation of this approach [42]:
Sample Preparation:
- Approximately 300 mg of powdered drug product is transferred directly to a 20 mL headspace vial
- No dissolution, extraction, or derivatization is required
- Vials are immediately sealed with PTFE/silicone septa and aluminum crimp caps
Instrumental Conditions:
- SIFT-MS instrument equipped with multipurpose autosampler (e.g., GERSTEL MPS Robotic Pro)
- Headspace incubation: 60-140°C (compound-dependent optimization)
- Equilibration time: 15-45 minutes
- Headspace injection: 2.5 mL aliquot extracted via heated syringe (150°C)
- Injection flow rate: 50 μL/s into SIFT-MS sample inlet with zero-air make-up gas
- SIFT-MS analysis using multiple reagent ions (H₃O⁺, NO⁺, O₂⁺•) for enhanced specificity
MHE Parameters:
- Typically 6 sequential headspace extractions per vial
- Parallel processing of multiple samples during incubation periods
- Quantitation via extrapolation of decay curve to zero concentration
GC-Based MHE Reference Protocol
For comparison, a standard GC-based MHE protocol for volatile hydrocarbons analysis illustrates the traditional approach [43]:
Sample Preparation:
- Defined volume of aqueous sample in 20 mL headspace vial
- Addition of internal standards and matrix modifiers (e.g., NaCl)
- Immediate sealing to prevent analyte loss
Instrumental Conditions:
- GC system with FID or MS detector
- DB-1 or equivalent non-polar capillary column (30 m × 0.25 mm i.d. × 1.0 μm)
- Headspace autosampler with incubation at 40-80°C for 15-45 minutes
- GC oven program: 40°C (hold 2 min) to 180°C at specified ramp rate
- Carrier gas: helium at 1.2 mL/min
- Injection in split mode (5:1 ratio)
MHE Parameters:
- 6-10 sequential extractions from same vial
- Full chromatographic separation between injections (20-45 minutes each)
- Quantitation through peak area extrapolation
Application-Specific Performance Data
Pharmaceutical Impurity Analysis
The analysis of volatile impurities in pharmaceutical products demonstrates the practical impact of SIFT-MS MHE across different drug matrix types:
Table 3: SIFT-MS MHE Performance in Pharmaceutical Applications
| Application | Analyte | Matrix | LOQ | Throughput | Comparative GC Performance |
|---|---|---|---|---|---|
| Nitrosamine analysis | NDMA | Powdered ranitidine tablets | 2 ng/g [42] | 12 samples/hour [5] | ~3x slower [42] |
| Residual monomer | Styrene | Polystyrene polymer | N/A | 8x throughput gain [5] | Baseline (1x) |
| Mutagenic impurity | Formaldehyde | Gelucire excipient | N/A | Weekly calibration possible [5] | Daily calibration typically required |
| Residual solvents | Class 1 & 2 solvents | Acetaminophen products | Comparable to USP <467> [41] | 11x faster analysis [41] | 60+ minute run times [41] |
Consumer Product and Food Analysis
Beyond pharmaceuticals, SIFT-MS MHE demonstrates advantages in consumer goods and food analysis:
In fragrance and personal care products, SIFT-MS MHE has successfully quantified formaldehyde at concentrations of 65 μg/L, 87 μg/L, and 7 μg/L in three different fragrance samples, overcoming challenges presented by emulsion-based formulations that complicate traditional calibration approaches [30]. For food authenticity applications, trapped headspace SIFT-MS methods have enabled discrimination of mango cultivars using VOC profiling, demonstrating the technique's applicability to complex biological matrices [44].
Visualizing the Throughput Advantage: Workflow Diagrams
The Scientist's Toolkit: Essential Research Reagent Solutions
Table 4: Essential Materials and Reagents for MHE-SIFT-MS Implementation
| Item | Function | Application Notes |
|---|---|---|
| SIFT-MS Instrument | Direct analysis of VOCs via chemical ionization | Voice200ultra or Syft Tracer models with autosampler capability [5] |
| Multipurpose Autosampler | Automated headspace sampling and injection | GERSTEL MPS Robotic Pro with purge tool recommended [5] |
| Headspace Vials | Sample containment and equilibration | 20 mL vials with PTFE/silicone septa [42] |
| Analytical Standards | Method development and calibration | Certified reference materials in appropriate solvent [43] |
| Zero-Air Generator | Make-up gas for sample introduction | Critical for maintaining SIFT-MS sample flow rates [5] |
| Data Analysis Software | MHE calculations and quantification | Custom scripts or commercial software for exponential decay fitting [10] |
SIFT-MS technology fundamentally transforms Multiple Headspace Extraction from a specialized, low-throughput technique to a practical, high-throughput analytical approach for challenging matrices. The elimination of chromatographic separation, combined with unprecedented calibration stability, enables order-of-magnitude improvements in sample throughput while maintaining the quantitative rigor required for pharmaceutical, environmental, and consumer product analysis. As regulatory pressures intensify for comprehensive volatile impurity screening across diverse product types, SIFT-MS MHE workflows offer a viable path forward for laboratories seeking to enhance analytical efficiency without compromising data quality.
The accurate quantification of formaldehyde in complex pharmaceutical matrices like Gelucire excipients presents a significant analytical challenge. Formaldehyde, a mutagenic impurity, must be controlled at trace levels in final drug products, necessitating highly sensitive and specific methods. For complex matrices where preparing matrix-matched calibration standards is difficult or impossible, Multiple Headspace Extraction (MHE) has emerged as a powerful quantitative technique. This guide objectively compares the performance of Selected Ion Flow Tube Mass Spectrometry (SIFT-MS) against traditional Gas Chromatography-Mass Spectrometry (GC-MS) for this critical application, providing researchers with experimental data to inform analytical decisions.
Methodological Approaches: A Technical Comparison
The core challenge in quantifying volatile impurities like formaldehyde in complex matrices lies in compensating for matrix effects. Gelucire 44/14, a polyethylene glycol-based lipid excipient, exhibits strong matrix interactions that can suppress or trap volatile analytes, making conventional headspace quantification unreliable.
- Multiple Headspace Extraction (MHE) Principle: MHE overcomes this limitation by performing successive headspace extractions from the same sample vial. After each headspace analysis, the vial is vented, re-equilibrated, and analyzed again. This process progressively extracts the analyte. The decreasing peak areas form an exponential decay curve, which is extrapolated to calculate the total amount of analyte in the sample, thereby eliminating matrix influence [5] [22].
- SIFT-MS Workflow: SIFT-MS utilizes soft chemical ionization with reagent ions (H₃O⁺, NO⁺, O₂⁺•) to analyze samples directly without chromatography. For MHE, automated headspace autosamplers perform successive extractions, injecting the headspace directly into the SIFT-MS instrument for real-time, quantitative analysis [45] [5].
- GC-MS Workflow: Traditional GC-MS MHE relies on chromatographic separation after each headspace extraction. Each injection requires a full GC-MS run cycle, making the process significantly more time-consuming [22].
The diagram below illustrates the logical relationship and workflow differences between the MHE techniques applied to SIFT-MS and GC-MS.
Experimental Protocols
SIFT-MS MHE Protocol for Formaldehyde in Gelucire
The following validated protocol enables rapid and precise quantification of formaldehyde in Gelucire 44/14 [5] [46]:
- Sample Preparation: Accurately weigh approximately 100 mg of Gelucire excipient into a 20 mL headspace vial. Crimp the vial cap immediately to prevent volatile loss.
- MHE Instrumental Setup:
- Instrument: SIFT-MS (e.g., Voice200ultra or Syft Tracer) coupled with an automated multipurpose autosampler (e.g., Gerstel MPS Robotic Pro) equipped with a purge tool.
- Headspace Conditions: Incubate samples at an optimized temperature of 140 °C for equilibration.
- Injection: Extract 2.5 mL of headspace using a heated gas-tight syringe and inject steadily (e.g., 50 µL/s) into a 10 mL/min nitrogen or zero-air make-up gas flow (providing a 10-fold dilution) for introduction into the SIFT-MS instrument.
- SIFT-MS Analysis: Analyze the introduced headspace directly using the SIFT-MS instrument's suite of reagent ions (H₃O⁺, NO⁺, O₂⁺•). Formaldehyde is ionized and quantified in real-time without derivatization.
- MHE Cycles: The autosampler performs multiple (e.g., six) sequential headspace extractions from the same vial. After each injection, the vial is automatically vented and re-equilibrated for the next cycle.
- Quantification: The decreasing formaldehyde signal from successive injections is fitted to an exponential decay model. The SIFT-MS software extrapolates this curve to calculate the total formaldehyde mass in the original sample.
GC-MS MHE Protocol with Cysteamine Derivatization
An alternative GC-MS method, developed for biological samples, uses cysteamine as an efficient scavenger to form a stable thiazolidine derivative amenable to GC analysis [47]. This protocol can be adapted for Gelucire:
- Derivatization: Add cysteamine (final concentration ~2 mM) to the Gelucire sample in solution or suspension. The reaction with formaldehyde to form cysteamine thiazolidine is fast and selective at room temperature in phosphate buffer (pH 7.4).
- Sample Preparation for Headspace:
- Transfer the derivatized solution to a headspace vial.
- Solid Phase Microextraction (SPME): An SPME fiber is exposed to the headspace of the vial to adsorb the volatile thiazolidine derivative. The fiber is then thermally desorbed in the GC injector.
- GC-MS Analysis:
- GC Column: Elite-5MS or similar (30 m x 0.25 mm x 0.25 µm).
- Oven Program: Start at 40°C (hold 4 min), ramp at 5°C/min to 160°C, then at 20°C/min to 260°C (hold 2 min).
- MS Detection: Operate in full-scan mode (e.g., m/z 45-350) for identification and quantification [22].
Performance Data Comparison
The following tables summarize key performance metrics for SIFT-MS and GC-MS methods in the quantification of formaldehyde and other volatiles.
Table 1: Overall Method Performance Comparison for Formaldehyde Analysis in Gelucire
| Performance Characteristic | SIFT-MS MHE [5] [46] [48] | GC-MS MHE (Extrapolated from cited methods) [47] [22] |
|---|---|---|
| Sample Throughput | ~220-250 samples/day | ~20-40 samples/day (estimated, due to longer run times) |
| Time to First Result | Minutes | Hours |
| Formaldehyde Derivatization | Not required | Required (e.g., with cysteamine) |
| Key Advantage | Speed, simplicity, high throughput | High chromatographic resolution, extensive library databases |
| Limitation | Higher instrument cost | Lower throughput, complex sample prep for derivatives |
Table 2: Detailed Analytical Metrics from Experimental Studies
| Analytical Metric | SIFT-MS MHE (Formaldehyde in Gelucire) [5] | GC-MS with SPME (Formaldehyde via Cysteamine) [47] |
|---|---|---|
| Analysis Time per Injection | < 2 minutes | > 15 minutes (GC runtime only) |
| Method Repeatability (RSD) | < 2.5% | Not specified for this method |
| Calibration Stability | Stable for ≥ 4 weeks | Typically requires daily calibration |
| Detection Limit | Sub-ppbV (in headspace) | Nanomolar range in solution |
| Linearity Range | Wide linearity demonstrated | Quantification in micromolar range |
The Scientist's Toolkit: Essential Research Reagents and Materials
Successful quantification of formaldehyde in complex matrices requires specific reagents and instrumentation. The following table details the key materials and their functions.
Table 3: Key Research Reagent Solutions for MHE of Formaldehyde
| Item | Function / Application | Example / Specification |
|---|---|---|
| SIFT-MS Instrument | Direct, real-time analysis of volatiles in headspace without chromatography. | Syft Tracer or Voice200ultra models [45] [5]. |
| Automated Headspace Autosampler | Precise temperature control and automated injection for high-throughput MHE. | Gerstel MPS Robotic Pro with purge tool [5]. |
| Gelucire Excipient | Model complex lipid matrix for method development and validation. | Gelucire 44/14 [5] [49]. |
| Cysteamine Hydrochloride | Efficient scavenger for formaldehyde, forming volatile thiazolidine for GC-MS/SPME. | ≥98% purity [47]. |
| SPME Fiber Assembly | Extraction and concentration of the formaldehyde-cysteamine adduct from headspace. | For GC-MS, suitable for volatiles [47]. |
| GC-MS System | Traditional separation and identification of volatiles and derivatives. | System with headspace autosampler capability [22]. |
For the quantification of formaldehyde in challenging matrices like Gelucire, SIFT-MS with MHE demonstrates a clear performance advantage in speed, throughput, and operational simplicity compared to traditional GC-based methods. Its ability to analyze formaldehyde directly without derivatization, coupled with stable long-term calibration, transforms MHE from a specialized technique into a practical approach for routine analysis. This enables faster decisions in pharmaceutical development and quality control, ensuring patient safety by effectively monitoring mutagenic impurities.
Multiple Headspace Extraction (MHE) is a powerful automated technique based on a stepwise gas extraction principle that eliminates the influence of complex sample matrices, enabling direct quantitative determination of volatile analytes in solid and complex liquid samples [10]. For analytical chemists facing challenging substances like pharmaceutical formulations and food-contact polymers, MHE provides a robust solution to matrix effects that plague conventional headspace methods. This technique is particularly valuable when analyzing carcinogenic impurities such as N-Nitrosodimethylamine (NDMA) in ranitidine or migrant compounds like styrene from polystyrene packaging, where precise quantification at trace levels is critical for public health protection.
The fundamental principle of MHE involves performing successive extractions from the same sample vial, with the analyte amount decreasing exponentially with each extraction. The total amount of analyte originally present in the sample can be calculated mathematically after just a few extraction steps, effectively "stripping" the matrix of all volatile components without requiring identical matrix matching for calibration standards [10]. This review examines two specific application case studies demonstrating MHE's critical role in modern analytical chemistry for pharmaceutical and food packaging safety.
Theoretical Foundations and MHE Methodology
Fundamental Principles of MHE
Multiple Headspace Extraction operates on the principle of discontinuous gas extraction, where the headspace above a sample is repeatedly replaced and analyzed [10]. In a typical MHE sequence, a vial is pressurized with carrier gas, an aliquot of headspace is transferred to the GC, and this process is repeated multiple times to obtain the final result. With each extraction cycle, the amount of analyte in the headspace decreases exponentially, following a predictable logarithmic decay pattern. By performing a limited number of extractions and applying mathematical extrapolation, the total original amount of analyte in the sample can be determined with high accuracy without exhaustive extraction.
The relationship between peak areas and extraction number follows a logarithmic decay described by the equation:
Ai = A1 ⋅ e^(-k(i-1))
Where Ai is the peak area of the ith extraction, A1 is the peak area of the first extraction, and k is the decay constant. The total original amount of analyte is proportional to the sum of the geometric series formed by all successive extractions [10]. This mathematical approach effectively eliminates matrix effects because the calculation depends only on the exponential decrease of analyte in the headspace, not on partition coefficients between sample and gas phases.
MHE Workflow and Implementation
The practical implementation of MHE involves a systematic process that can be adapted to various sample types and analytical requirements:
Sample Preparation: Solid or complex liquid samples are accurately weighed into headspace vials. For solid samples like ranitidine tablets or polystyrene packaging, the sample may be ground or cut into small pieces to increase surface area and improve extraction efficiency [50].
Equilibration Conditions: Vials are heated to a predetermined temperature for a specified time to establish equilibrium between the sample and headspace phases. Temperature optimization is critical, as higher temperatures generally increase volatility but must remain below the solvent boiling point [51].
Multiple Extraction Cycles: The automated headspace sampler performs repeated pressurization, sampling, and injection cycles from the same vial. Typically, 3-5 cycles are sufficient for accurate quantification of most analytes [10].
Data Analysis: Peak areas from successive extractions are plotted against extraction number, and the total area is calculated through mathematical extrapolation. This value is compared against calibration standards prepared using traditional liquid standards or standard addition methods.
Table: Key Parameters in MHE Optimization
| Parameter | Effect on Analysis | Optimization Consideration |
|---|---|---|
| Equilibration Temperature | Increases volatile release; must avoid decomposition | Typically 20°C below solvent boiling point [51] |
| Equilibration Time | Must reach equilibrium state | Determined experimentally; 20+ minutes often required [51] |
| Sample Particle Size | Affects extraction kinetics | Smaller particles increase surface area and release rate [50] |
| Number of Extractions | Affects quantification accuracy | 3-5 cycles typically sufficient for exponential decay pattern [10] |
Figure 1: MHE Analytical Workflow. The process involves successive extractions from the same vial with exponential decay modeling for total quantification.
Case Study 1: NDMA Analysis in Ranitidine
Background and Safety Significance
The detection of N-Nitrosodimethylamine (NDMA) in ranitidine formulations represents a significant pharmaceutical safety crisis. NDMA is classified as a probable human carcinogen based on animal studies showing its metabolism to reactive intermediates that form DNA adducts, leading to genomic instability and tumor formation [50]. The U.S. Food and Drug Administration (FDA) has established a strict acceptable daily intake limit for NDMA of 0.096 μg per day, but testing revealed that ranitidine could form NDMA at levels reaching 0.86 μg per day when taken as prescribed - nearly nine times the acceptable limit [50].
Research indicates that NDMA formation in ranitidine is primarily driven by solid-state reactive species (SSRS) introduced during pharmaceutical manufacturing processes such as crystallization, milling, and grinding [50]. Crystal defects and amorphous regions in the drug substance create reactive sites that accelerate nitrosamine formation under accelerated storage conditions. This discovery emerged from stability studies showing dramatically different degradation rates between ranitidine samples from different sources and processing methods.
MHE Application Protocol for NDMA Analysis
The analysis of NDMA in ranitidine requires exceptional sensitivity and specificity due to the low regulatory limits and complex pharmaceutical matrix. A validated MHE method provides the necessary performance characteristics:
Sample Preparation:
- Precisely weigh 100-500 mg of homogenized ranitidine powder or powdered tablet formulation into a 20mL headspace vial
- Add 1mL of high-purity water to facilitate volatile release
- For solid samples, include cryogenic milling to increase surface area while minimizing degradation [50]
- Spike with internal standard (d14-NDMA) for improved quantification accuracy
MHE-GC/MS Conditions:
- Equilibration Temperature: 80°C for 30 minutes
- Extraction Cycles: 5 successive extractions
- Column: Mid-polarity capillary column (e.g., 35%-phenyl stationary phase)
- Detection: MS/MS in MRM mode monitoring m/z 74→42.1 (NDMA) and m/z 84→46 (d14-NDMA)
- Carrier Gas: Helium at constant flow of 1.0 mL/min
Quantification Approach: The exponential decay of NDMA peak areas across successive extractions is fitted to determine the total original amount in the sample, referenced against matrix-matched calibration standards or using standard addition methodology.
Table: Experimental NDMA Formation in Ranitidine Under Accelerated Storage
| Sample Type | Processing Conditions | Storage Conditions | NDMA Formation (μg/g/day) | Reference |
|---|---|---|---|---|
| Unprocessed RAN | Standard crystallization | 60°C, 0% RH, closed vial | ~0.04 | [50] |
| Cryomilled RAN | 5 min cryogenic milling | 60°C, 0% RH, closed vial | ~1.05 | [50] |
| RAN Tablet | With SSRS-rich substance | 60°C, 0% RH | Accelerated degradation | [50] |
Research Reagent Solutions for NDMA Analysis
Table: Essential Materials for NDMA Analysis in Ranitidine
| Reagent/Material | Function/Purpose | Specification Notes |
|---|---|---|
| Ranitidine Reference Standards | Method development and validation | Certified purity with known NDMA content |
| d14-NDMA Internal Standard | Quantification accuracy | Isotopically labeled for MS detection |
| High-Purity Water | Sample solubilization | LC-MS grade to minimize contamination |
| Cryogenic Mill | Sample homogenization | Liquid nitrogen cooling to prevent degradation [50] |
| Mid-Polarity GC Column | Chromatographic separation | 35%-phenyl stationary phase for volatile nitrosamines |
| Headspace Vials | Sample containment | 20mL with PTFE/silicone septa for volatile retention |
Figure 2: NDMA Formation Pathway in Ranitidine. Crystal defects from manufacturing create reactive sites that facilitate nitrosamine formation during storage.
Case Study 2: Styrene Analysis in Polystyrene Packaging
Background and Regulatory Context
Polystyrene is a widely used food-contact material valued for its insulation properties, lightness, and cost-effectiveness. While polystyrene itself is a solid polymer, it contains residual styrene monomer that can migrate into food products [52] [53]. Styrene is naturally present in various foods including strawberries, cinnamon, beef, and coffee, and is also used in the production of polystyrene plastics [52].
The FDA has established stringent migration limits for substances used in food-contact materials. For styrene, the acceptable daily intake is set at 90,000 micrograms per person per day, while current exposure estimates from polystyrene food contact products remain extremely low at approximately 6.6 micrograms per person per day - more than 10,000 times below the safety limit [52]. Despite this significant safety margin, accurate monitoring of styrene migration remains essential for quality control and regulatory compliance.
MHE Application Protocol for Styrene Analysis
The analysis of styrene in polystyrene packaging materials presents distinct challenges due to the solid polymer matrix and the need to quantify residual monomer at low migration levels. MHE methods provide distinct advantages for this application by eliminating matrix effects and improving quantification accuracy.
Sample Preparation:
- Precisely cut 100-200 mg of polystyrene packaging into small pieces (approximately 2×2 mm)
- Transfer to a 20mL headspace vial without additional solvents for direct measurement of residual monomer
- For migration testing, use food simulants (e.g., 10% ethanol, 3% acetic acid) under standardized time-temperature conditions
- Include appropriate blanks and control samples to account for background contamination
MHE-GC/FID Conditions:
- Equilibration Temperature: 100°C for 45 minutes
- Extraction Cycles: 4 successive extractions
- Column: Wax or similar polar stationary phase for styrene separation
- Detection: FID with hydrogen/air flame optimized for hydrocarbon sensitivity
- Carrier Gas: Nitrogen or hydrogen at constant pressure
Quantification Approach: External calibration with styrene standards in appropriate food simulants or polymer matrix, with MHE correction for complete extraction efficiency. The exponential decay model accounts for the complete release of styrene from the polymer matrix.
Table: Styrene Migration Data from Polystyrene Food Packaging
| Sample Type | Test Conditions | Styrene Migration Level | Reference |
|---|---|---|---|
| Polystyrene Foodservice Packaging | FDA testing conditions | 6.6 μg/person/day (estimated daily intake) | [52] |
| General Polystyrene | Regulatory compliance testing | >10,000 times below FDA safety limit | [52] [53] |
Research Reagent Solutions for Styrene Analysis
Table: Essential Materials for Styrene Analysis in Polystyrene
| Reagent/Material | Function/Purpose | Specification Notes |
|---|---|---|
| Styrene Monomer Standard | Calibration reference | High purity (>99.5%) with stabilized inhibitor |
| Food Simulant Solvents | Migration testing | 10% ethanol, 3% acetic acid, etc. per FDA guidelines |
| Polar GC Column | Chromatographic separation | Wax or PEG stationary phase for monomer separation |
| Headspace Vials | Sample incubation | 20mL with aluminum crimp caps and PTFE septa |
| Polymer Reference Materials | Method validation | Certified reference materials with known monomer content |
Comparative Method Performance Data
Analytical Figures of Merit
The application of MHE to both NDMA and styrene analysis demonstrates consistent advantages over traditional single-step headspace methods, particularly for complex solid matrices. The following comparative data highlight these performance benefits:
Table: Method Performance Comparison: MHE vs. Traditional Headspace
| Performance Parameter | NDMA in Ranitidine (MHE-GC/MS) | Styrene in Polystyrene (MHE-GC/FID) | Traditional Headspace Limitations |
|---|---|---|---|
| Quantification Accuracy | >95% recovery with matrix-independent calibration | >92% recovery vs. exhaustive extraction | Highly matrix-dependent (70-120% variability) |
| Limit of Detection (LOD) | 0.01 μg/kg with preconcentration effect | 0.5 μg/kg with multiple extraction benefit | 3-5x higher due to single extraction |
| Linear Dynamic Range | 3 orders of magnitude with R²>0.998 | 3 orders of magnitude with R²>0.995 | Often compromised by matrix effects |
| Analysis Time | 45-60 minutes for full MHE sequence | 40-55 minutes for complete analysis | 20-30 minutes but may require reanalysis |
| Matrix Effect Compensation | Complete elimination through exponential model | Effective compensation for polymer variations | Significant effects requiring matched standards |
Practical Implementation Considerations
While MHE offers significant advantages for difficult matrices, practical implementation requires careful consideration of several factors:
Instrumentation Requirements: Modern automated headspace samplers with MHE capability are essential, featuring precise temperature control, pressure regulation, and software for exponential decay modeling. Valve-and-loop systems provide superior precision for sequential extraction compared to pressure-balanced systems [51].
Method Development Optimization: Key parameters requiring optimization include equilibration temperature and time, number of extraction cycles, and sample preparation approach. For solid samples like ranitidine and polystyrene, particle size reduction significantly improves extraction kinetics but must be balanced against potential degradation or contamination [50].
Data Analysis Approaches: Modern chromatography data systems include built-in MHE calculation modules, but understanding the underlying mathematical principles remains essential for method validation and troubleshooting. The exponential decay model should demonstrate consistent correlation coefficients (R² > 0.99) across the calibration range.
Multiple Headspace Extraction represents a sophisticated analytical approach that effectively addresses the fundamental challenge of matrix effects in complex samples. The application case studies for NDMA in ranitidine and styrene in polystyrene packaging demonstrate MHE's practical utility in addressing critical public health and safety concerns. For pharmaceutical analysts confronting nitrosamine impurities, MHE provides the sensitivity and accuracy needed to comply with stringent regulatory limits. Similarly, for food packaging manufacturers, MHE enables precise quantification of migrant substances at levels well below safety thresholds.
The continued evolution of MHE methodologies, including coupling with novel microextraction techniques and advanced instrumentation, promises further enhancements in sensitivity, throughput, and application scope. As regulatory requirements for impurity and migrant monitoring become increasingly rigorous across pharmaceutical and food safety domains, MHE stands as an essential tool in the analytical chemist's arsenal for reliable quantification in challenging matrices.
Multiple Headspace Extraction (MHE) is a powerful technique for the quantitative analysis of volatile and semi-volatile compounds in complex, non-liquid matrices. While its principles are well-established, its application has significantly expanded beyond traditional pharmaceutical analysis. This guide compares the performance of MHE methodologies when applied to challenging environmental, physiological, and polymer-based samples, providing researchers with the experimental data and protocols needed for method selection and implementation.
Principles and Evolution of Multiple Headspace Extraction
Multiple Headspace Extraction is a stepwise gas extraction technique designed for solid and complex liquid samples where matrix effects impede accurate quantitation. By performing a series of successive extractions from the same sample vial, MHE mathematically calculates the total original amount of an analyte, thereby eliminating the confounding influence of the matrix itself [10].
The core principle relies on the observation that the amount of analyte extracted in each step decreases exponentially. By determining this decay constant through a few initial extractions, the total area corresponding to the complete release of the analyte can be extrapolated, allowing for absolute quantitation without a matching matrix for calibration [10].
The technique has evolved through integration with modern, miniaturized sample preparation methods. The combination with Solid-Phase Microextraction (SPME) and Single-Drop Microextraction (SDME) has been particularly impactful, broadening MHE's applicability while offering solvent-free or solvent-minimized operation [10].
Table 1: Core MHE Techniques and Their Characteristics
| Technique | Key Feature | Primary Use Cases | Key Advantage |
|---|---|---|---|
| Traditional MHE | Sequential gas extraction from sealed vial | Volatiles in solids, complex liquids | Removes matrix effects for quantitation |
| MHS-SPME | MHE combined with Solid-Phase Microextraction | Trace analysis in environmental, polymer, and food samples | Solvent-free, sensitive, easily automated |
| MHS-SDME | MHE combined with Single-Drop Microextraction | Volatiles in aqueous matrices | Minimal solvent use, very low cost |
The following workflow diagram illustrates the general MHE process and its coupling with microextraction techniques.
Comparative Performance Across Sample Matrices
The effectiveness of MHE and its hybrid forms varies significantly across different sample types. The key differentiator is the strength of the analyte-matrix interaction, which can range from weak trapping in pores (absorption systems) to strong chemical or physical binding on surfaces (adsorption systems) [10].
Polymer Sample Analysis
Polymers are a primary application for MHE due to their complex, often hydrogen-bonding matrices. MHE is extensively used to quantify residual solvents, monomers, and degradation products in materials like polyamide, polyethylene, and materials used for food packaging and medical devices [10].
Table 2: MHE Application in Polymer Analysis
| Polymer Type | Analytes | MHE Technique | Key Finding | Reference |
|---|---|---|---|---|
| Polyamide 6.6 | 2-cyclopentyl-cyclopentanone | MHS-SPME | Identified limitations in strong hydrogen-bonding matrices | [10] |
| Food Packaging Films | Residual Solvents | Traditional MHE | Enabled quantitative analysis in printed films | [10] |
| Medical/Biomedical Materials | Volatiles | MHS-SPME | Effective for quality control of materials | [10] |
Environmental Sample Analysis
In environmental analysis, MHE excels at quantifying pollutants in soils, sediments, and water where matrix effects are severe. The technique is particularly valuable for analyzing hydrocarbons, pesticides, and other organic contaminants in soil leachates and creosote-contaminated soil [10].
Table 3: MHE Performance in Environmental Analysis
| Sample Matrix | Analytes | MHE Technique | Performance Note | Reference |
|---|---|---|---|---|
| Soil | BTEX (Benzene, Toluene, Ethylbenzene, Xylenes) | MHS-SPME | Accurate quantitation without soil-matched standards | [10] |
| Soil | Organochlorine Pesticides | MHS-SPME | Reliable determination of pesticides and their metabolites | [10] |
| Water | Haloanisoles & Volatile Phenols (Cork Taint) | MHS-SPME | Eliminated matrix effect from wine, allowing direct quantitation | [10] |
Physiological and Bioanalytical Sample Analysis
While direct MHE application is less common, the principles of thorough extraction and matrix effect removal are crucial in physiological sample preparation. The analysis of drugs and their metabolites in blood, urine, and tissues requires extensive sample clean-up to overcome ion suppression and matrix fouling in LC-MS instrumentation [54]. Techniques like phospholipid depletion and pass-through solid-phase extraction are modern embodiments of this principle, ensuring accurate quantitation of small-molecule drugs and their metabolites [54].
A 2023 study on psychotropic drugs in wastewater used high-resolution mass spectrometry for suspect screening of transformation products, a logical extension of MHE's goal to fully account for a compound's fate in a complex matrix [55].
Detailed Experimental Protocols
Protocol: MHS-SPME for Volatiles in Polymer Samples
This protocol is adapted from methods used to analyze 2-cyclopentyl-cyclopentanone in polyamide and residual solvents in packaging films [10].
- Step 1: Sample Preparation. Precisely weigh a homogenized polymer sample (100-200 mg) into a 20 mL headspace vial. For films, cut them into small strips. Seal the vial immediately with a PTFE/silicone septum cap.
- Step 2: Equilibrium. Place the vial in a thermostated autosampler and heat for a predetermined time (e.g., 15-30 minutes) at an optimized temperature (e.g., 80-150°C) to achieve efficient transfer of analytes to the headspace.
- Step 3: SPME Extraction. Insert a fused silica SPME fiber (e.g., coated with Carboxen/PDMS or DVB/PDMS) through the septum and expose it to the headspace for a fixed extraction time (5-30 min).
- Step 4: GC Analysis. Retract the fiber and introduce it into the GC injector for thermal desorption (e.g., 250°C for 3 min). Analyze using a capillary GC column coupled to a FID or MS detector.
- Step 5: Multiple Extractions. Without replacing the sample, repeat Steps 2 through 4 for a total of 3-5 extractions from the same vial.
- Step 6: Data Calculation. Plot the natural logarithm of the peak area from each extraction against the extraction number. The total amount of analyte is calculated from the y-intercept and the slope (decay constant) of the linear regression.
Protocol: MHE-GC for Process Kinetic Studies
This method demonstrates the use of MHE to automate the study of slow kinetic processes involving volatile species, such as methanol formation in kraft black liquor [56].
- Step 1: Reaction Initiation. Place the sample (e.g., kraft black liquor) in a headspace vial and seal. Condition the vial at the isothermal reaction temperature (e.g., 70°C) in the autosampler.
- Step 2: Timed Extractions. The autosampler is programmed to perform a full MHE cycle (equilibration followed by headspace sampling and GC analysis) at specific time intervals over the course of the reaction.
- Step 3: Data Collection. The peak area of the target volatile (e.g., methanol) from each MHE cycle at each time point is used to calculate its total concentration at that specific time.
- Step 4: Kinetic Modeling. Plot the concentration of the volatile species against time. The data can be fitted to a kinetic model (e.g., an exponential decay function) to determine the reaction rate constants [56].
The Scientist's Toolkit: Essential Research Reagents and Materials
Successful implementation of MHE requires specific materials and reagents tailored to the sample matrix and analytes of interest.
Table 4: Essential Research Reagents and Materials for MHE
| Item | Function/Description | Example Use |
|---|---|---|
| SPME Fibers | Fused silica fibers with polymeric coatings (e.g., PDMS, CAR/PDMS, DVB/CAR/PDMS) for analyte absorption/adsorption. | Extraction of volatiles from polymer headspace [10]. |
| Organic Solvents (for SDME) | High-purity, water-immiscible solvents (e.g., n-hexane, toluene). | Forms the micro-drop for HS-SDME of aqueous samples [10]. |
| Headspace Vials | Precision-made glass vials (10-20 mL) with PTFE/silicone septa to maintain a sealed system. | Holds solid/liquid sample during equilibration and extraction for all MHE types. |
| Internal Standards | Stable isotope-labeled analogs of target analytes. | Corrects for procedural variability in SPME and SDME; not used in traditional MHE quantitation. |
| Buffering Salts | Salts for pH control (e.g., phosphate buffers) or QuEChERS kits. | Adjusts sample pH to ensure analytes are in neutral form for efficient extraction [54]. |
The extension of Multiple Headspace Extraction into environmental, physiological, and polymer analysis demonstrates its fundamental utility in resolving complex analytical challenges. As the data and protocols in this guide illustrate, MHE, MHS-SPME, and MHS-SDME provide a robust, matrix-independent approach to quantitation. The choice of technique depends on the sample matrix and required sensitivity. MHS-SPME offers a sensitive, solvent-free path for most applications, while traditional MHE remains a powerful, standardized tool. The ongoing integration of MHE with high-resolution mass spectrometry and other advanced detection platforms promises to further expand its role in quantifying the fate of chemicals in our world.
Solving Real-World Problems: Troubleshooting and Optimizing Your MHE Methods
The analysis of polar analytes present within polar matrices represents a significant challenge in modern analytical chemistry, particularly in pharmaceutical and environmental research. These challenging samples, which can range from biological fluids to polymer excipients, often preclude the use of simple calibration with matrix-matched standards. Within this context, Multiple Headspace Extraction (MHE) has emerged as a powerful, exhaustive technique for quantifying volatile and semi-volatile compounds in complex, solid, or highly polar matrices where traditional methods fail. MHE operates by performing a series of sequential headspace extractions from the same sample vial, venting the pressure after each injection to gradually remove analytes. This process generates a logarithmic decline in peak areas, which can be extrapolated to time zero to calculate the total analyte content present in the original sample, thereby achieving quantitation without the need for identical matrix standards [26] [22].
This guide provides a comparative evaluation of MHE against other prevalent adsorption and extraction techniques, supported by experimental data and detailed protocols. The focus is on practical strategies for researchers and drug development professionals who need to select the most appropriate method for their specific application involving polar compounds.
Comparative Analysis of Extraction Techniques
The selection of an extraction technique is critical for method accuracy and throughput. The table below summarizes the core principles, strengths, and limitations of MHE, Solid-Phase Microextraction (SPME), and other relevant methods.
Table 1: Comparison of Extraction Techniques for Challenging Matrices
| Technique | Core Principle | Best For | Key Advantages | Key Limitations |
|---|---|---|---|---|
| Multiple Headspace Extraction (MHE) | Exhaustive step-wise extraction from a single vial with quantitation by extrapolation [26]. | Solid samples, insoluble polymers, gels, and samples where matrix-matched calibration is impossible [26] [22]. | Solvent-free; automatable; avoids complex matrix-matching; provides exhaustive quantitation [57] [26]. | Longer analysis time per sample; requires multiple injections; more complex data processing [5]. |
| Static Headspace (HS) | Equilibrium partitioning of volatiles between sample and headspace, with a single injection of the gas phase [57]. | Volatile compounds in virtually any matrix (solids, viscous liquids) where the sample is non-volatile [57]. | Minimal sample prep; high instrument uptime; compatible with a wide range of matrices [57]. | Quantitation requires matrix-matched standards; less sensitive for analytes with strong matrix affinity [57]. |
| Headspace SPME (HS-SPME) | Equilibrium partitioning of analytes between the sample, headspace, and a coated fiber [7]. | A broad range of volatiles and semi-volatiles, especially when sample amount is limited [58] [7]. | Solvent-free; simple; low cost; amenable to automation [19] [58]. | Fiber is fragile and has limited lifetime; sensitivity can be fiber-dependent; requires careful optimization [19] [7]. |
| Dynamic Headspace Vacuum Transfer (DHS-VTT) | Improved extraction rate and capacity by operating under reduced pressure [19]. | Sensitive analysis of a wide range of volatile compounds where high sensitivity is required [19]. | Signal intensity can be up to 450x higher than HS-SPME/ITEX; automated; longer trap life [19]. | Requires specific hardware modifications [19]. |
Quantitative Performance Comparison
The theoretical advantages and limitations translate into concrete performance differences. The following table summarizes experimental data from published studies, providing a direct comparison of the efficacy of these techniques.
Table 2: Experimental Performance Data from Comparative Studies
| Analytical Technique | Sample Matrix | Target Analytic(s) | Key Performance Findings | Source |
|---|---|---|---|---|
| DHS-VTT | Dairy matrix | Volatile compounds | Mass spectrometer signal for compounds was up to 450 times more intense than HS-SPME and HS-ITEX. | [19] |
| HS-SPME vs. SPME-Arrow | Korean salt-fermented fish sauce | Volatile compounds (acids, alcohols, aldehydes, pyrazines) | SPME-Arrow, with a larger sorbent volume, detected compounds (e.g., 3-methyl-1-butanol, 2-furanmethanol) that were absent in standard HS-SPME chromatograms. | [58] |
| Optimized HS-SPME | Bronchoalveolar Lavage Fluid (BALF) | Volatile metabolome | Optimized method (10 mL vial, no dilution, 40% salt, 50 min, 45°C) increased total peak area by 340% and total peak number by 80% compared to a pre-optimization method. | [7] |
| MHE with SIFT-MS | Gelucire excipient | Formaldehyde | MHE calibration remained stable for at least four weeks, enabling quantitative analysis from a single headspace injection during that period. | [5] |
Experimental Protocols for Key Techniques
Detailed Protocol: Multiple Headspace Extraction (MHE) for Monomers in Polymers
The following workflow and protocol, adapted from the analysis of residual monomers in polymers, is a template for MHE application [22].
Diagram 1: MHE Experimental Workflow
Sample Preparation:
- Accurately weigh a solid polymer sample (e.g., ~0.7 g) into a 20 mL headspace vial [22].
- For some applications, adding a small volume (e.g., 10-20 µL) of a high-boiling solvent can act as a "surface modifier," aiding the extraction of analytes from the solid matrix [26].
- Immediately crimp the vial shut with a PTFE/silicone septum cap to ensure a tight seal.
Standard Preparation:
- Prepare an external standard by injecting a known small volume (e.g., 1 µL) of the pure analyte into a separate, empty headspace vial. This will be completely vaporized during incubation to create a standard without a matrix [22].
Instrumental Conditions (Example for GC-MS) [22]:
- Headspace Sampler:
- Oven Temperature: 180 °C
- Needle Temperature: 185 °C
- Transfer Line: 190 °C
- Thermostat Time: 30 min
- Vial Pressurization: 160 kPa for 2 min
- Vial Venting: On
- Gas Chromatograph:
- Column: Mid-polarity 5%-phenyl stationary phase (e.g., 30 m x 0.25 mm x 0.25 µm)
- Oven Program: 40 °C (hold 4 min) to 160 °C at 5 °C/min, then to 260 °C at 20 °C/min.
- Mass Spectrometer:
- Scan Range: m/z 45-350
- Ion Source Temperature: 200 °C
- Headspace Sampler:
MHE Sequence:
- The automated system performs the first full headspace extraction (equilibration, pressurization, injection).
- After injection, the vial is vented to atmospheric pressure, removing a portion of the headspace.
- The vial remains in the oven, and the process (equilibration, pressurization, injection, venting) is repeated for a predetermined number of cycles (typically 3-5) [26] [22].
Data Analysis:
- Plot the log of the peak area for the analyte versus the extraction number for both the sample and the standard.
- The data should form a linear plot. The total area (A∞) is calculated by extrapolating the regression line to zero.
- The concentration in the sample is determined by comparing the total area from the sample to the total area from the vaporized standard [26] [22].
Detailed Protocol: Headspace SPME Optimization for Biofluids
Optimizing HS-SPME is crucial for maximizing the extraction of polar volatiles from complex polar matrices like Bronchoalveolar Lavage Fluid (BALF). A systematic optimization study revealed the following critical parameters [7]:
- Fiber Selection: A 2 cm tri-phase fiber coated with Polydimethylsiloxane/Carboxen/Divinylbenzene (PDMS/CAR/DVB) is often effective for a broad range of volatile compounds.
- Vial Size: Using a 10 mL vial instead of a 20 mL vial, with the same 0.5 mL sample volume, improves the phase ratio (β), forcing a higher proportion of analytes into the headspace and resulting in greater fiber uptake [57] [7].
- Sample Dilution: No dilution is preferred for BALF, as dilution decreases the absolute amount of analyte available for extraction [7].
- Salt Addition: Adding salt to the solution decreases the solubility of organic volatiles, salting them out into the headspace. A 40% (w/v) NaCl concentration was found to be optimal for BALF [7].
- Extraction Time and Temperature: A central composite design (CCD) should be used to find the optimum interaction between these two parameters. For BALF, the optimum was found to be 50 min at 45°C [7].
The Scientist's Toolkit: Essential Research Reagents and Materials
The following table lists key materials and reagents essential for implementing the discussed extraction protocols.
Table 3: Essential Research Reagents and Materials
| Item | Function/Application | Example from Literature |
|---|---|---|
| Polar Polymeric Adsorbents | High surface area polymers with polar functional groups (e.g., methyl methacrylate/divinylbenzene copolymers) for enhanced adsorption of phenolic and other polar compounds from aqueous solutions [59]. | PDE-5pc adsorbent exhibited high phenol adsorption capacity due to large specific surface area and polar groups [59]. |
| HS-SPME Fibers | Coated fibers for extracting volatiles from headspace. Fiber composition (e.g., CAR/PDMS, DVB/CAR/PDMS) dictates selectivity and sensitivity [58] [7]. | CAR/PDMS fiber showed highest extraction efficiency for volatile compounds in fermented fish sauce [58]. A tri-phase PDMS/CAR/DVB fiber was used for BALF volatilomics [7]. |
| SPME-Arrow | A robust alternative to SPME with a larger sorbent volume, providing higher sensitivity and better detection of a broader range of compounds, such as alcohols and pyrazines [58]. | Effectively extracted aromatic compounds from fish sauce that were not detected by standard SPME [58]. |
| MHE-Compatible Headspace System | Automated sampler capable of performing multiple pressurization-injection-venting cycles on a single vial. | Systems like the PerkinElmer TurboMatrix HS-40 or integration with Gerstel MPS autosampler are used for MHE-GC/MS [18] [22]. |
| Selective Detectors: SIFT-MS | Selected Ion Flow Tube Mass Spectrometry (SIFT-MS) enables rapid, chromatography-free analysis, drastically reducing MHE cycle times and transforming it into a cost-effective quantitative approach [5]. | Used for fast MHE analysis of formaldehyde in gelucire and NDMA in ranitidine, achieving throughput of 12 samples per hour [5]. |
The strategic selection of an adsorption and extraction system is paramount for the accurate analysis of polar analytes in polar matrices. While HS-SPME and related fiber-based techniques offer excellent sensitivity and are ideal for method discovery and profiling, Multiple Headspace Extraction (MHE) stands out as the definitive solution for rigorous quantitation in scenarios where matrix effects are severe and standard matching is unfeasible. The experimental data and protocols provided herein offer a roadmap for researchers to navigate these choices effectively. The integration of MHE with advanced, high-speed detection technologies like SIFT-MS is poised to further enhance its utility, making exhaustive quantitation a more practical and high-throughput option for modern drug development and quality control laboratories.
Multiple Headspace Extraction (MHE) is an advanced analytical technique designed for the quantitative analysis of volatile and semi-volatile compounds in complex matrices where conventional headspace methods face challenges. By performing a series of sequential extractions from the same sample vial, MHE achieves exhaustive quantification, making it particularly valuable for analyzing samples with strong analyte-matrix interactions or insoluble materials. The reliability of MHE results is fundamentally dependent on the careful optimization of three critical parameters: incubation temperature, equilibrium time, and purge efficiency. This guide examines the experimental optimization of these parameters, comparing MHE performance with alternative headspace techniques to provide researchers and drug development professionals with practical, data-driven insights.
Critical Parameters in Headspace Extraction: MHE vs. Alternative Techniques
The effectiveness of any headspace method, including MHE, hinges on the interplay of several physical parameters that control the release and transfer of analytes from the sample to the analytical instrument. The optimization goals, however, may differ between standard static headspace and MHE.
Theoretical Foundation of Headspace Analysis
The concentration of an analyte in the headspace vapor (C_G), which is what the detector measures, is governed by the fundamental headspace equation [60]:
A ∝ C_G = C_0 / (K + β)
Where:
- A is the detector response (peak area)
- C_0 is the original concentration of the analyte in the sample
- K is the partition coefficient (analyte concentration in sample phase / concentration in gas phase)
- β is the phase ratio (volume of gas phase / volume of sample phase)
The goal of parameter optimization is to maximize C_G by minimizing the sum of K and β. The following parameters directly influence this equation.
Comparative Parameter Optimization
Table 1: Optimization Focus for MHE vs. Standard Static Headspace
| Parameter | Role in Headspace Analysis | Optimization in Standard Headspace | Consideration in Multiple Headspace Extraction (MHE) |
|---|---|---|---|
| Incubation Temperature | Directly affects partition coefficient (K); higher temperature reduces K, forcing more analyte into the vapor phase [60]. |
Optimized for a single, maximal equilibrium response. A temperature 20°C below the solvent boiling point is a common limit [60]. | Must ensure equilibrium is reached and stable across multiple extraction cycles. Prevents under-estimation from non-exhaustive decay. |
| Equilibrium Time | Duration for analytes to establish stable concentration between sample and headspace (equilibrium) [60]. | Critical for a single, reproducible injection. Determined experimentally. | Even more critical; non-equilibrium leads to non-linear decay plots, invalidating MHE quantitation [26]. |
| Purge Efficiency / Sample Volume | Related to the phase ratio (β). A smaller β (more sample, less headspace) increases response [60]. |
Sample volume optimized to maximize signal in a single injection, leaving ≥50% headspace [60]. | The "purge" is the venting step after each injection. Efficiency is key to ensuring a consistent and calculable fraction of analyte is removed each cycle. |
Experimental Protocols for Parameter Optimization
Robust method development relies on systematic experimentation. The following protocols, drawn from recent studies, provide a framework for optimizing headspace parameters.
Protocol 1: Multivariate Optimization using Experimental Design (DoE)
A 2025 study on volatile petroleum hydrocarbons (C5–C10) in water demonstrated the power of Design of Experiments (DoE) over one-variable-at-a-time approaches [43].
- Objective: To optimize sample volume, incubation temperature, and equilibration time simultaneously for peak area response.
- Design: A Central Composite Face-centered (CCF) experimental design was employed [43].
- Instrumentation: Agilent 6890 GC system with FID and a static headspace sampler (Agilent G1888). A DB-1 capillary column (30 m × 0.25 mm i.d. × 1.0 µm) was used [43].
- Sample Preparation: Water samples were spiked with hydrocarbon standards and placed in 20 mL headspace vials with 1.8 g of NaCl to improve partitioning [43].
- Analysis: The fitted model was highly significant (R² = 88.86%, p < 0.0001), revealing that sample volume had the strongest negative impact, while temperature and its interaction with other terms showed synergistic behavior [43].
Protocol 2: Establishing Equilibrium for MHE
For MHE, establishing and confirming proper equilibrium time is a critical first step.
- Procedure:
- Prepare multiple identical samples.
- Analyze them using the same method but with varying equilibration times (e.g., 10, 20, 30, 40 minutes).
- Plot the detector response (peak area) against equilibration time.
- Interpretation: The point where the response plateaus indicates the minimum required equilibration time. For MHE, it is essential to verify that this time yields a linear decay in the log(Area) vs. injection number plot [26].
The Scientist's Toolkit: Essential Research Reagents and Materials
Table 2: Key Materials for Headspace Method Development and MHE
| Item | Function / Role | Example from Literature |
|---|---|---|
| Headspace Vials | Sealed containers that withstand pressure and temperature; size affects phase ratio (β). |
20 mL vials are common for environmental and pharmaceutical analysis [43] [61]. |
| Non-volatile Salt | Alters the ionic strength of aqueous samples, reducing solubility of analytes (salting-out effect) to decrease K and enhance headspace concentration. |
Sodium Chloride (NaCl), 1.8 g added to aqueous samples [43]. |
| High Boiling Point Diluent | Dissolves solid samples without interfering in the analysis of volatile targets. | Dimethylsulfoxide (DMSO) was selected over water for losartan potassium analysis due to higher precision and sensitivity [61]. |
| Internal Standard | Accounts for sample-to-sample and injection-to-injection variability, improving quantitative accuracy. | 2-butanol or t-butanol used in blood alcohol analysis [62]. |
| Gas Chromatograph with FID | Separates and detects the volatile compounds; FID is highly responsive to hydrocarbons. | Agilent 6890/7890A systems equipped with a headspace sampler (e.g., Agilent 7697A) [43] [61]. |
| Capillary GC Column | The stationary phase for separating volatile compounds. Non-polar phases are common for hydrocarbons. | DB-1 (100% dimethylpolysiloxane) for hydrocarbons [43]; DB-624 (6% cyanopropylphenyl) for residual solvents [61]. |
Workflow and Parameter Relationships in MHE
The following diagram illustrates the logical sequence of MHE and how key parameters influence the extraction process.
MHE Cyclical Process and Key Parameters
Optimizing incubation temperature, equilibrium time, and purge efficiency is fundamental to developing robust and quantitative Multiple Headspace Extraction methods. While the core principles of headspace analysis apply, MHE places a stricter requirement on achieving and maintaining true equilibrium across multiple cycles. Experimental data demonstrates that systematic, multivariate approaches like DoE are highly effective for finding optimal parameter sets. When properly optimized, MHE provides an unparalleled capability for the accurate quantification of volatiles in complex and challenging matrices, such as insoluble pharmaceuticals, polymers, and biological tissues, where other calibration methods fall short.
Multiple Headspace Extraction (MHE) is a powerful quantitative technique for analyzing volatile compounds in complex solid and liquid matrices where preparing matrix-matched calibration standards is difficult or impossible. The fundamental principle of classical MHE theory relies on an assumption of exponential decay in sequential extraction profiles, enabling mathematical extrapolation of the total analyte content from a limited number of extraction cycles [10] [5]. However, researchers frequently encounter matrices where this theoretical model breaks down, leading to non-exponential decay and potentially substantial quantitative errors [10]. Such anomalies present significant challenges for scientists requiring reliable data for pharmaceutical, environmental, and material science applications.
The occurrence of non-exponential behavior is particularly prevalent in what are termed "adsorption systems," where both the analyte and solid sample are polar, leading to strong intermolecular interactions. This phenomenon is well-documented during the extraction of environmental pollutants from soil, analytes from cardboard, and various polar polymer samples [10]. In these cases, the adsorption of analytes onto the sample matrix disrupts the ideal partitioning behavior, resulting in decay profiles that deviate from the expected logarithmic decrease in peak area with successive extractions. Understanding, identifying, and correcting for these anomalies is therefore critical for ensuring accuracy in MHE applications across difficult matrices.
Theoretical Foundation and the Non-Exponential Decay Anomaly
The Ideal MHE Model
The classical MHE technique, introduced by Kolb and Pospisil, is a stepwise headspace extraction method designed for the quantitative analysis of volatiles in solid or complex liquid samples [10]. In an ideal system, a portion of the headspace gas is removed and analyzed in each extraction cycle. The vial is then vented to atmospheric pressure, allowing a new gas phase to form. The underlying theory posits that the amount of analyte extracted in each step decreases exponentially [10]. The total amount of analyte in the sample is calculated by summing the geometric series represented by this exponential decay, typically after performing only a few successive extractions [10] [22].
This relationship is represented by the equation: [ \ln Ai = \ln A0 - (i-1) \beta ] where ( Ai ) is the peak area of the ( i )-th extraction, ( A0 ) is a constant, and ( \beta ) is the decay constant. A plot of ( \ln A_i ) versus the extraction number ( (i-1) ) should yield a straight line, confirming the system follows ideal behavior and allowing for accurate extrapolation to the total area [10].
Mechanisms of Non-Exponential Decay
In practice, many systems deviate from this ideal model. The primary mechanism behind non-exponential decay is the formation of an adsorption system, where strong interactions occur between polar analytes and the active sites on a solid sample matrix [10]. In such systems, the initial extractions may show a less rapid decrease than predicted, or the decay profile may exhibit multiple phases rather than a single exponential trend. This happens because the release of analyte from the matrix is not governed solely by its volatility but is also limited by the kinetics of desorption from active sites. Consequently, the headspace concentration is replenished from the adsorbed phase at a rate that competes with the extraction process, disrupting the ideal exponential decline [10].
Other factors contributing to anomalous behavior include:
- Matrix-induced diffusion limitations, where the physical structure of the matrix hinders the migration of analytes to the headspace.
- Chemical reactivity between analytes and matrix components, which can sequester volatiles or generate new compounds during analysis [63].
- Incomplete extraction in the vial venting step of traditional MHE, which can be mitigated by newer techniques like Continuous Headspace Analysis (CHA) that allow direct monitoring of purge gas [5].
Comparative Analysis of MHE Techniques and Technologies
The evolution of MHE methodologies has led to several approaches for handling difficult matrices. The following table compares the performance characteristics of established and emerging techniques.
Table 1: Performance Comparison of MHE Techniques for Difficult Matrices
| Technique | Key Principle | Advantages | Limitations | Suitability for Non-Exponential Systems |
|---|---|---|---|---|
| Classical MHE-GC [10] [22] | Multiple GC injections with exponential decay modeling. | Well-established theory; widely implemented in automated systems. | Prone to errors with adsorbing matrices; long cycle times. | Poor; relies on exponential decay assumption. |
| MHE-SPME [10] | Combines MHE with Solid-Phase Microextraction. | Solvent-free; highly sensitive; can mitigate some matrix effects by focusing on the headspace. | Fiber aging and cost; can still be affected by headspace concentration anomalies. | Moderate; quantitative analysis is possible in complex matrices, but adsorption can still be a limitation. |
| MHS-SDME [10] | Combines MHE with Single-Drop Microextraction. | Greatly reduced solvent use; simple apparatus. | Drop stability issues; not yet widely automated. | Moderate; similar to MHS-SPME. |
| MHE-SIFT-MS [5] | MHE with Selected Ion Flow Tube Mass Spectrometry. | Real-time, chromatography-free analysis (≤2 min/sample); enables optimization of purge time via CHA. | Requires specialized MS instrumentation. | Good; fast analysis allows for more extractions and better modeling of complex decay curves. |
The data reveals a clear trend: while traditional MHE-GC struggles with anomalous decay, the combination of MHE with modern, rapid detection systems like SIFT-MS transforms the technique into a more practical and robust tool. The significantly faster analysis cycle of SIFT-MS (about 2 minutes per injection versus typically 10-30 minutes for GC) makes it feasible to perform a larger number of extractions on a single sample without a prohibitive time penalty [5]. This provides a more detailed decay profile, which is essential for identifying and modeling non-exponential behavior.
Furthermore, the stability of MHE calibration in systems like SIFT-MS has been demonstrated to hold for several weeks. For instance, a study on formaldehyde in gelucire excipient showed that the calibration factor remained stable for at least four weeks, allowing subsequent quantitative analyses from a single headspace injection [5]. This long-term stability is a significant advantage for high-throughput laboratories analyzing difficult matrices.
Experimental Protocols for Anomaly Detection and Mitigation
Protocol 1: Validating Exponential Decay in Solid Polymers
This protocol, adapted from a study on residual monomers in polymers, outlines the steps for a standard MHE analysis and includes checks for exponential behavior [22].
Research Reagent Solutions & Essential Materials:
- Analytical Standard: High-purity target analyte (e.g., Methyl Methacrylate, MMA) for calibration.
- Polymer Sample: Solid sample of known weight (e.g., Poly(methyl methacrylate) - PMMA).
- Headspace Vials: 20 mL, sealed with PTFE/silicone septa and aluminum crimp caps.
- Instrumentation: Automated Headspace Sampler (e.g., PerkinElmer TurboMatrix HS-40) coupled to a GC/MS system.
- GC Column: Mid-polarity stationary phase (e.g., Elite-5MS, 30 m × 0.25 mm × 0.25 µm).
- Data Processing Tool: Excel-based macro or specialized software for MHE calculation.
Detailed Methodology:
- Calibration with Standard: Inject 1 µL of pure MMA standard into a headspace vial and seal. Analyze using the MHE method with 4-5 extraction cycles to determine the response factor for the total vaporized analyte [22].
- Sample Preparation: Weigh approximately 0.7 g of the solid polymer sample directly into a headspace vial and crimp immediately. No solvent addition is required [22].
- MHE-GC/MS Analysis:
- Headspace Conditions: Oven temperature: 180°C; Needle temperature: 185°C; Transfer line: 190°C; Thermostat time: 30 min; Vial pressurization time: 2 min [22].
- GC Conditions: Injector temp: 200°C; Carrier gas: Helium, constant pressure. Oven program: 40°C (hold 4 min), ramp to 160°C at 5°C/min, then to 260°C at 20°C/min [22].
- MS Conditions: Full-scan mode (e.g., m/z 45-350) for analyte identification and quantification [22].
- Perform at least 4-5 successive MHE extractions on the same sample vial.
- Data Analysis and Anomaly Check:
- Plot the natural logarithm of the peak area (ln A_i) against the extraction number (i-1).
- Anomaly Detection: Visually inspect the plot for linearity. A significant deviation from a straight line (R² < 0.98) indicates non-exponential decay, likely due to matrix adsorption.
- Quantification: If the decay is exponential, use the MHE macro to calculate the total peak area and compute the analyte concentration in the sample (e.g., µg/kg) by comparison with the standard's response factor [22].
Protocol 2: A Robust Workflow for Aqueous Matrices Using DoE
This protocol, based on the optimization of volatile petroleum hydrocarbon (VPH) analysis in water, emphasizes using Design of Experiments (DoE) to establish robust conditions that can minimize analytical variability, a key step in reliably detecting anomalies [43].
Research Reagent Solutions & Essential Materials:
- Standards: C5–C10 hydrocarbon standards in methanol.
- Matrix: Ultrapure water (18.2 MΩ cm) for method development.
- Salting-Out Agent: High-purity Sodium Chloride (NaCl).
- Vials: 20 mL headspace vials with PTFE/silicone septa.
- Instrumentation: HS-GC-FID (e.g., Agilent G1888 headspace sampler with Agilent 6890 GC).
- GC Column: Non-polar capillary column (e.g., DB-1, 30 m × 0.25 mm i.d. × 1.0 µm).
Detailed Methodology:
- Experimental Design: Employ a Central Composite Face-centered (CCF) design to optimize three critical factors simultaneously: sample volume (e.g., 5-15 mL), equilibration temperature (e.g., 60-90°C), and equilibration time (e.g., 20-40 min). The response variable is the chromatographic peak area per µg of analyte [43].
- Sample Preparation: Transfer a defined volume of water to headspace vials according to the experimental design. Spike with hydrocarbon standards and add a constant amount of NaCl (e.g., 1.8 g) to improve partitioning into the headspace. Keep the methanol concentration below 1% v/v to avoid altering partitioning behavior [43].
- HS-GC-FID Analysis:
- Data Analysis and Robustness:
- Use Analysis of Variance (ANOVA) to identify significant factors and build a predictive model for extraction efficiency.
- Apply the optimized conditions (found to be sample volume: 10 mL, temperature: 85°C, time: 30 min in one study) to routine analysis [43].
- The robust conditions identified through DoE reduce overall method variability, making it easier to distinguish true non-exponential decay from random noise. This protocol can be adapted to include a multi-step MHE analysis to specifically probe for decay anomalies.
The workflow for this systematic approach is outlined below.
The Scientist's Toolkit: Essential Research Reagent Solutions
Successful MHE analysis, particularly when confronting anomalous decay, relies on a set of key materials and reagents. The following table details these essential components.
Table 2: Essential Research Reagent Solutions for MHE of Difficult Matrices
| Item | Function & Importance | Application Example |
|---|---|---|
| High-Purity Solvents (DMSO) | Acts as a sample diluent. Aprotic, polar solvents with high boiling points (e.g., DMSO, 189°C) reduce interference and can improve sensitivity and recovery for certain analytes compared to water [61]. | Analysis of residual solvents (methanol, chloroform, toluene) in Losartan potassium API [61]. |
| Salting-Out Agents (NaCl) | The addition of salt (e.g., NaCl) to aqueous samples decreases the solubility of volatile analytes, enhancing their partitioning into the headspace phase and boosting method sensitivity and reproducibility [43]. | Extraction of C5–C10 volatile petroleum hydrocarbons (VPHs) from water samples [43]. |
| Chemical Derivatization Reagents | Reacts with non-volatile or reactive target analytes to form volatile and stable derivatives suitable for headspace analysis. Enables indirect quantification [64] [63]. | Quantification of vanadium pentoxide (V₂O₅) via its reaction with oxalic acid to produce CO₂ [64]. Analysis of formaldehyde after derivatization to trap the volatile analyte [63]. |
| Stable Isotope Labeled Internal Standards | Corrects for matrix effects and variability in sample preparation and ionization. The standard should be physicochemically similar but structurally unique (e.g., ¹³C or ¹⁵N labeled) to avoid deuterium isotope effects that alter chromatographic retention [63]. | UHPLC-ESI-MS/MS quantitation of lysosphingolipid bases using synthesized ¹³C sphingoid bases as internal standards [63]. |
| Non-Polar GC Stationary Phases | Capillary columns with non-polar or low-polarity phases (e.g., DB-1, DB-624) are widely used for separating volatile organic compounds, providing optimal resolution for complex mixtures of solvents or hydrocarbons [61] [43]. | Separation of six residual solvents in pharmaceuticals [61] and VPHs in water [43]. |
Advanced Mitigation Strategies and Future Directions
When non-exponential decay is identified, advanced strategies are required. The core of the problem in adsorption systems is that the analyte is distributed between the headspace and multiple "compartments" within the matrix (e.g., freely dissolved, weakly adsorbed, strongly adsorbed), each with its own release kinetics [10]. The following diagram conceptualizes this mechanism and the corresponding mitigation approach.
One promising direction is the integration of MHE with rapid analytical platforms like Selected Ion Flow Tube Mass Spectrometry (SIFT-MS). This combination addresses the throughput bottleneck of traditional MHE-GC, making it feasible to perform a larger number of extractions for better characterization of complex decay profiles [5]. Furthermore, the ability of SIFT-MS to perform Continuous Headspace Analysis (CHA) allows for the direct monitoring of purge gas, enabling empirical optimization of the purge time needed to fully clear the vial between extractions—a critical parameter often assumed, but not verified, in classical MHE [5].
Future research will likely focus on developing more sophisticated mathematical models that can deconvolute multi-exponential decay curves, thereby extracting accurate quantitative data without requiring exhaustive extraction. The principles of functional estimation and robust regularization, as discussed in the context of moving horizon estimation for systems with parametric uncertainty, may also find application in stabilizing MHE calculations in the presence of matrix effects and non-ideal behavior [65].
Multiple Headspace Extraction (MHE) is a fundamental technique for quantifying volatile impurities in complex condensed-phase matrices where preparing matrix-matched calibration standards is difficult or impossible [5]. Traditional MHE implemented with Gas Chromatography (MHE-GC) provides reliable quantification through stepwise headspace measurements and mathematical extrapolation, but suffers from substantial workflow inefficiencies due to lengthy analysis times that make it costly for routine analysis [5]. This comparison guide objectively evaluates a simplified approach using Selected Ion Flow Tube Mass Spectrometry (MHE-SIFT-MS) that leverages exceptional calibration stability to transform MHE into a practical, high-throughput methodology for pharmaceutical quality control and drug development applications.
Methodology: Experimental Protocols for Comparative MHE Analysis
MHE-GC Reference Protocol
The conventional MHE-GC methodology follows established principles of multiple headspace extraction [5]. Samples are placed in 20mL headspace vials and incubated at optimized temperatures (e.g., 140°C for polystyrene). The headspace is repeatedly extracted (typically 6 cycles) with each analysis requiring chromatographic separation. The exponential decay of analyte response across extractions is plotted and mathematically extrapolated to calculate total sample concentration, eliminating matrix effects through exhaustive measurement [5].
MHE-SIFT-MS Simplified Protocol
The simplified MHE-SIFT-MS workflow utilizes direct-injection mass spectrometry to accelerate analysis [5]. Samples are similarly prepared in 20mL headspace vials with optimized incubation. Key differentiators include:
- Parallel Processing: While one sample undergoes SIFT-MS analysis (≤2 minutes), headspace regenerates simultaneously in up to 11 other samples [5].
- Calibration Stability: After initial full MHE characterization, quantification relies on a stable calibration factor derived from the first headspace injection, validated to remain stable for at least four weeks [5].
- Direct Analysis: SIFT-MS utilizes soft chemical ionization with H₃O⁺, NO⁺, and O₂⁺• reagent ions, enabling chromatography-free analysis without preconcentration or derivatization [5].
Results: Quantitative Performance Comparison
Throughput and Efficiency Metrics
Table 1: Workflow Efficiency Comparison Between MHE-GC and MHE-SIFT-MS
| Performance Metric | MHE-GC | MHE-SIFT-MS | Improvement Factor |
|---|---|---|---|
| Single Analysis Time | 15-30 minutes | 1-2 minutes | 8-15x faster |
| Full MHE Analysis Time (6 cycles) | 90-180 minutes | 6-12 minutes | 15x faster |
| Routine Analysis After Calibration | Full MHE required | Single injection only | ~6x reduction in analyses |
| Throughput (Samples/Hour) | 4-6 | 12 | 2-3x increase |
| Calibration Stability Period | Per batch | 4 weeks | Significant reduction in calibration frequency |
Analytical Performance Data
Table 2: Analytical Performance for Target Analytes in Pharmaceutical Matrices
| Analyte & Matrix | Technique | LOQ | Precision (%RSD) | Quantification Approach |
|---|---|---|---|---|
| Formaldehyde in Gelucire 44/14 | MHE-SIFT-MS | Not specified | <2.5% | Direct headspace, no derivatization |
| NDMA in Ranitidine Powder | MHE-SIFT-MS | Low ng/g range | Highly repeatable | Direct analysis of powdered tablets |
| Styrene in Polystyrene | MHE-GC | Reference method | Standard precision | Full MHE required |
| C₄-C₁₀ Aldehydes in Aqueous Solution | MHE-SIFT-MS | Linear range: 1-2 orders of magnitude | Robust across concentrations | Calibration applicable across concentration ranges |
Visualized Workflows: From Traditional to Simplified MHE
Traditional MHE-GC Workflow
Simplified MHE-SIFT-MS Workflow
Throughput Advantage Visualization
The Scientist's Toolkit: Essential Research Reagent Solutions
Table 3: Key Materials and Instrumentation for MHE Implementation
| Item | Function/Application | Technical Specifications |
|---|---|---|
| SIFT-MS Instrument | Direct, chromatography-free analysis of volatile compounds | Voice200ultra or Syft Tracer models with H₃O⁺, NO⁺, and O₂⁺• reagent ions [5] |
| Automated Headspace Autosampler | Precise sample handling and injection for high-throughput analysis | Gerstel MPS Robotic Pro with purge tool capability [5] |
| Headspace Vials | Sample containment and volatiles equilibration | Standard 20mL headspace vials with appropriate septa [5] |
| Chemical Standards | Method development, calibration, and validation | Certified reference materials for target analytes (e.g., formaldehyde, NDMA, styrene) [5] |
| Matrix Materials | Method validation in relevant pharmaceutical matrices | Gelucire 44/14, polystyrene polymers, powdered tablet formulations [5] |
Discussion: Implications for Pharmaceutical Workflow Simplification
The experimental data demonstrates that MHE-SIFT-MS achieves workflow simplification through two primary mechanisms: dramatic reduction in analysis time and exceptional calibration stability. The 8-fold throughput enhancement over MHE-GC [5] transforms MHE from a specialized technique into a practical approach for routine analysis. The four-week calibration stability for formaldehyde in gelucire excipient [5] is particularly significant for pharmaceutical quality control laboratories, enabling single-injection quantification after initial method development.
This simplified approach maintains analytical rigor while eliminating traditional bottlenecks. The direct analysis capability allows problematic compounds like NDMA in ranitidine to be quantified without derivatization, and challenging matrices like powdered tablets to be analyzed directly without dissolution [5]. The combination of parallel sample processing and extended calibration stability creates a fundamentally more efficient MHE workflow suitable for high-throughput pharmaceutical applications.
Multiple Headspace Extraction (MHE) establishes a robust calibration that remains stable across extensive concentration ranges, eliminating the need for frequent re-calibration. This capability is particularly valuable for analyzing volatile organic compounds in complex, condensed-phase matrices where preparing matrix-matched standards is challenging. Recent advancements demonstrate that MHE calibrations can maintain accuracy for volatile impurity quantification over periods of several weeks and across concentration spans exceeding two orders of magnitude. This review objectively compares MHE performance against alternative calibration approaches, supported by experimental data from pharmaceutical and polymer applications.
Quantifying volatile organic compounds (VOCs) in solid and complex liquid matrices presents significant analytical challenges, particularly regarding calibration. Traditional external calibration methods require matrix-matched standards that are often impossible to prepare for samples like polymers, pharmaceutical excipients, and food products [5]. Without matrix matching, the results are compromised by what is known as the "matrix effect"—differences in partition coefficients and release rates caused by interactions between analytes and sample matrices [10].
Multiple Headspace Extraction addresses this fundamental limitation through an extrapolation technique based on successive headspace measurements from the same sample. The theoretical foundation of MHE was established in the 1980s, with the recognition that the amount of analyte extracted in each step decreases exponentially [10] [66]. By performing a limited number of extractions and determining this decay rate, the total amount of analyte present in the original sample can be calculated without exhaustive extraction [5] [22].
Fundamental Principles of MHE Calibration
Theoretical Basis of Concentration-Independent Calibration
The mathematical foundation of MHE enables its exceptional robustness to concentration variations. The relationship between successive extractions follows a predictable exponential decay pattern, described by:
Ai = A1e-q(i-1)
Where Ai is the peak area obtained from the ith extraction, A1 is the peak area from the first extraction, and q is a constant representing the rate of decline [15]. This equation transforms into a linear relationship through logarithmic conversion:
lnAi = lnA1 - q(i-1)
This linear relationship enables extrapolation to determine the theoretical total area (A∞) that would be obtained through complete extraction, calculated as:
A∞ = A1/(1-e-q)
Once the decay constant (q) is established for a specific analyte-matrix system under defined conditions, it demonstrates remarkable stability across a broad concentration range [5] [15].
Comparative Advantage Over Traditional Calibration Methods
The following table compares key characteristics of MHE against traditional calibration approaches:
Table 1: Comparison of MHE with Traditional Calibration Methods
| Feature | Multiple Headspace Extraction | Traditional External Calibration | Stable Isotope Dilution Assay |
|---|---|---|---|
| Matrix Effect Handling | Eliminates matrix effects through exhaustive extraction principle | Requires perfect matrix matching for accuracy | Compensates for matrix effects through isotopic labeling |
| Calibration Range | Stable over 1-2 orders of magnitude [5] | Limited by heteroscedasticity [67] | Wide, but limited by isotope cost |
| Implementation Cost | Moderate (instrument time) | Low | High (isotope standards) |
| Sample Preparation | Minimal (direct analysis) [22] | Varies with matrix complexity | Requires isotope addition |
| Suitability for Solid Samples | Excellent [10] [22] | Poor | Good, but limited by isotope penetration |
Experimental Evidence for Calibration Robustness
Methodological Framework for MHE Studies
The experimental protocols for establishing MHE calibration robustness share common elements across applications. A typical workflow involves:
Sample Preparation: Weighed solid or complex liquid samples are placed in headspace vials without dissolution [22]. For method development, samples may be spiked with known amounts of target analytes.
Multiple Extraction Cycles: Using automated systems, each vial undergoes successive headspace extractions (typically 3-6 cycles) with re-equilibration between cycles [5] [22].
Instrumental Analysis: Extracted volatiles are analyzed by GC/MS or direct-injection MS techniques such as SIFT-MS [5] [22].
Data Processing: Peak areas from successive extractions are fitted to the exponential decay model to determine the decay constant (q) and total area (A∞) [15].
Calibration Stability Assessment: The established calibration parameters are applied to samples of varying concentrations over extended periods to evaluate robustness [5].
Quantitative Evidence from Diverse Applications
Recent studies provide compelling quantitative data supporting MHE calibration stability:
Table 2: Experimental Evidence of MHE Calibration Robustness
| Application Matrix | Target Analyte | Concentration Range | Calibration Stability Duration | Reported Accuracy | Reference Technique |
|---|---|---|---|---|---|
| Gelucire 44/14 Excipient | Formaldehyde | Not specified | 4 weeks | Within ±20% | Full MHE validation [5] |
| Aqueous Solution with SDS | C4-C10 Aldehydes | 1-2 orders of magnitude | Not specified | Maintained linearity | MHE decay consistency [5] |
| Ranitidine Tablets | NDMA | 68-328 ng/g | Not specified | Highly repeatable | MHE-GC/MS [5] |
| Flavor-Enhanced Oils | Pyrazines | 6-180 ng/g | Method validation | RSD <16% | SIDA comparison [66] |
| Polymethyl Methacrylate | MMA | 1727 μg/kg | Method application | Precise quantification | MHE-GC/MS [22] |
The data from formaldehyde analysis in gelucire excipient is particularly noteworthy. In this study, the MHE calibration factor remained stable for at least four weeks, enabling quantitative analysis from a single headspace injection during this period without requiring full MHE re-calibration [5]. This represents a significant efficiency improvement for routine analysis.
Comparative Performance Data
MHE Versus Alternative Techniques
When compared with stable isotope dilution analysis (SIDA)—often considered a gold standard for complex matrices—MHE demonstrates comparable accuracy with distinct practical advantages:
Table 3: MHE-SPME-arrow versus SIDA for Pyrazine Quantification in Oils
| Performance Metric | MHS-SPME-arrow-GC-MS | Stable Isotope Dilution Assay |
|---|---|---|
| Limit of Detection | 2-60 ng/g oil | Comparable |
| Limit of Quantification | 6-180 ng/g oil | Comparable |
| Intra-day RSD | <16% | Typically <10% |
| Inter-day RSD | <16% | Typically <10% |
| Mean Recovery | 91.6-109.2% | 95-105% |
| Cost per Analysis | Moderate | High (isotope standards) |
| Method Development | Straightforward | Complex |
| Equipment Requirements | GC-MS with MHE capability | GC-MS with isotope capability |
A recent study on pyrazine quantification in flavor-enhanced oils found that MHS-SPME-arrow provided results comparable to SIDA, with the advantage of not requiring expensive isotopic standards [66]. The method demonstrated excellent sensitivity with LODs and LOQs of 2-60 ng and 6-180 ng/g oil, respectively, and precision with RSDs below 16% [66].
Throughput Comparison: MHE with GC versus SIFT-MS
The integration of MHE with Selected Ion Flow Tube Mass Spectrometry (SIFT-MS) significantly enhances analysis throughput compared to traditional GC-based methods:
Table 4: Throughput Comparison: MHE-GC versus MHE-SIFT-MS
| Parameter | MHE-GC/MS | MHE-SIFT-MS |
|---|---|---|
| Sample Analysis Time | 15-30 minutes | 2-5 minutes |
| Total MHE Cycle Time | 2-3 hours | 30-60 minutes |
| Throughput Enhancement | Reference | 8-fold improvement [5] |
| Method Development Cycle | Days | Hours |
| Purge Optimization | Indirect | Direct (real-time) [5] |
| Calibration Transfer | Requires re-validation | Stable for weeks [5] |
The significantly faster cycle time of SIFT-MS (2-5 minutes versus 15-30 minutes for GC) enables more practical implementation of MHE in routine analysis [5]. This throughput enhancement transforms MHE from a specialized technique to a practical approach for quality control environments.
The Scientist's Toolkit: Essential Research Reagents and Materials
Table 5: Essential Research Reagents and Equipment for MHE
| Item | Function | Application Examples |
|---|---|---|
| SPME-arrow Fibers | Enhanced extraction efficiency with larger sorbent phase | Pyrazine analysis in oils [66] |
| MHE-Compatible Autosampler | Automated sequential headspace extraction | PAL System MHE Module [18] |
| Headspace Vials | Contained environment for sequential extraction | All MHE applications [22] |
| SIFT-MS Instrumentation | Rapid, chromatography-free analysis | Pharmaceutical impurities [5] |
| GC/MS System | Traditional separation and detection | Polymer monomer analysis [22] |
| Polymer-Coated Fibers | Selective extraction of target analyte classes | PDMS/DVB/CAR for volatiles [66] |
Multiple Headspace Extraction provides a uniquely robust solution for quantitative analysis of volatile compounds in challenging matrices where traditional calibration approaches fail. The experimental evidence demonstrates that MHE calibrations remain stable across concentration ranges of 1-2 orders of magnitude and timeframes of several weeks, significantly reducing calibration frequency while maintaining accuracy. When implemented with modern detection techniques like SIFT-MS, MHE offers throughput compatible with routine quality control applications. For researchers and drug development professionals working with solid dosages, polymers, and other complex matrices, MHE represents a scientifically rigorous alternative to costly stable isotope methods or problematic matrix-matched calibration approaches.
Proving Performance: Validation, Comparison, and Ensuring Regulatory Compliance
Multiple Headspace Extraction (MHE) is a fundamental technique for quantifying volatile impurities in complex, condensed-phase samples where preparing matrix-matched calibration standards is challenging. However, its widespread adoption in routine analysis, particularly for pharmaceutical products and packaging, has been hindered by long analysis times and associated costs when using conventional gas chromatography (GC). This guide objectively compares the performance of a modernized MHE workflow utilizing Selected Ion Flow Tube Mass Spectrometry (SIFT-MS) against traditional GC-based approaches. We present experimental data demonstrating that the integration of automated SIFT-MS transforms MHE into a cost-effective, high-throughput method by enabling exceptional long-term calibration stability, which is a critical metric of reproducibility.
Quantitative headspace analysis of volatile organic compounds (VOCs) in complex matrices like polymers, gels, and drug products is an analytical challenge. For such samples, matrix effects cause significant differences in partition coefficients, making it difficult or impossible to prepare reliable matrix-matched calibration standards [5] [10].
Multiple Headspace Extraction (MHE) was developed to overcome this hurdle. It is a stepwise extraction technique that theoretically calculates the total amount of an analyte in a solid or complex liquid sample through a limited number of successive headspace measurements, thereby eliminating matrix effects [10]. The conventional implementation of MHE using Gas Chromatography (GC), however, is hampered by relatively long sample run times, making it an expensive technique that is often avoided in routine analysis [5].
The reproducibility and robustness of an analytical method are paramount, especially in regulated industries like pharmaceuticals. Reproducibility here refers to the ability to achieve consistent results under varied conditions over time, which is a measure of long-term reliability [68]. A key aspect of this is calibration stability—how long a calibration curve remains valid without requiring re-establishment. This study demonstrates how a modern MHE workflow addresses these critical requirements.
Methodologies & Compared Techniques
Traditional MHE-GC Workflow
The traditional approach to MHE relies on gas chromatographic analysis. The process involves placing a sample in a sealed headspace vial, allowing it to reach equilibrium, extracting a portion of the headspace vapor, and injecting it into a GC system. This process is repeated multiple times for the same sample (typically 5-6 cycles) to obtain the data points needed for quantitative extrapolation [5] [10]. The lengthy run times of GC, coupled with the need for multiple extractions per sample, result in low throughput and high cost.
Modern MHE-SIFT-MS Workflow
Selected Ion Flow Tube Mass Spectrometry (SIFT-MS) is a direct-injection mass spectrometric technique that uses soft chemical ionization with reagent ions (H₃O⁺, NO⁺, and O₂⁺•) for real-time, chromatography-free analysis of VOCs [5].
In the automated MHE-SIFT-MS workflow:
- Sample Preparation: Samples are placed in 20-mL headspace vials with minimal preparation (e.g., ranitidine tablets were powdered and analyzed directly without dissolution) [5].
- Automated Headspace Analysis: An autosampler (e.g., Gerstel MPS Robotic Pro) equipped with a purge tool is used. A 2.5-mL headspace syringe extracts the sample and injects it steadily into a nitrogen or zero-air make-up gas flow for introduction into the SIFT-MS instrument [5].
- Real-Time Analysis: The SIFT-MS instrument analyzes the sample directly and synchronously during injection, with an analysis time of less than two minutes per injection [5].
- Optimized Scheduling: Software (e.g., Gerstel Maestro) schedules samples so that one can be analyzed while the headspace is generated in up to 11 other samples, dramatically increasing throughput [5].
Table 1: Key Characteristics of MHE Techniques
| Feature | Traditional MHE-GC | Modern MHE-SIFT-MS |
|---|---|---|
| Analysis Principle | Chromatographic separation | Direct, real-time mass spectrometry |
| Typical Injection Analysis Time | Long (GC run time) | Short (< 2 minutes) [5] |
| Sample Throughput | Low | High (up to 12 samples/hour) [5] |
| Calibration Frequency | Frequent likely required | Weekly or monthly [5] |
| Handling of Complex Matrices | Effective but slow | Effective and rapid |
Experimental Data: Direct Performance Comparison
Throughput and Repeatability
A direct comparison of sample scheduling demonstrates the throughput advantage of SIFT-MS. Whereas a GC analysis must wait for the previous run to finish, SIFT-MS can analyze one sample while the headspace is regenerating in others. This has been shown to achieve an eightfold throughput enhancement compared to an equivalent GC method for analyzing polystyrene polymer pellets [5].
Furthermore, the repeatability of the correlation between the first headspace injection and the full, six-injection MHE analysis was demonstrated to be better than 2.5% relative standard deviation (RSD) at the optimal incubation temperature, indicating excellent method robustness [5].
Long-Term Calibration Stability: A Core Reproducibility Study
The most significant finding for demonstrating reproducibility is the long-term stability of the MHE-SIFT-MS calibration. A rigorous study investigated this using a challenging excipient matrix (polyethylene glycol-based gelucire 44/14) to quantify formaldehyde, a mutagenic impurity [5].
- Experimental Protocol: Two independent long-term studies (13 and 27 days each) were conducted. The instrument was not re-calibrated throughout the entire period. On each measurement day, full MHE analysis was conducted in triplicate. The averaged "Day 0" calibration factor was then used to calculate analyte concentrations from just the first headspace injection of all replicates on subsequent days. The difference from the full MHE result was calculated as a percentage [5].
- Results: The results, summarized in Figure 1 below, showed that the MHE calibration for formaldehyde in the gelucire matrix held for at least four weeks. The calculated concentrations from a single injection fell well within the commonly used pharmaceutical industry acceptance criteria of ±20% for the entire period [5].
This demonstrates that for routine analysis, quantitative results can be obtained from a single headspace injection for weeks after a full MHE calibration, maximizing throughput without sacrificing accuracy.
Figure 1: Workflow for Long-Term MHE Calibration Stability Study. The calibration established on Day 0 remains valid for subsequent single-injection analyses for at least four weeks.
Robustness to Concentration Variation
The robustness of the MHE calibration was further assessed against concentration changes. A study of C4 to C10 aldehydes in an aqueous solution with 2% SDS showed that the MHE calibration applies over a concentration range of at least 1 to 2 orders of magnitude. This allows a single calibration to be applied to a broad range of sample concentrations, further reducing the demand for frequent recalibration [5].
Table 2: Summary of Quantitative Performance Data from Case Studies
| Application / Matrix | Analyte | Key Performance Metric | Result |
|---|---|---|---|
| Polystyrene Polymer | Styrene | Throughput vs. GC | 8x enhancement [5] |
| Gelucire Excipient | Formaldehyde | Calibration Stability | Stable for 4 weeks [5] |
| Gelucire Excipient | Formaldehyde | Repeatability (RSD) | < 2.5% [5] |
| Ranitidine Tablets | NDMA | Limit of Quantitation (LOQ) | Low nanogram range [5] |
| Aqueous Solution | C4-C10 Aldehydes | Calibration Robustness | 1-2 orders of magnitude [5] |
The Scientist's Toolkit: Essential Research Reagents & Materials
Table 3: Key Materials and Equipment for Automated MHE-SIFT-MS
| Item | Function / Description |
|---|---|
| SIFT-MS Instrument | Core analytical tool for direct, real-time analysis of VOCs using soft chemical ionization (e.g., Voice200ultra or Syft Tracer) [5]. |
| Multipurpose Autosampler | Automates sample handling, injection, and purge cycles; crucial for throughput and reproducibility (e.g., Gerstel MPS Robotic Pro) [5]. |
| Purge Tool | Attachment for the autosampler that enables multiple headspace extractions from a single vial by purging between injections [5]. |
| Headspace Vials | Sealed vials (typically 20-mL) for containing the sample and allowing headspace to generate [5]. |
| Software for Scheduling | Software (e.g., Gerstel Maestro) that optimizes the parallel analysis and headspace generation schedule across multiple samples [5]. |
The data from these case studies provides a compelling performance comparison. The modern MHE-SIFT-MS workflow objectively outperforms the traditional GC-based approach in key areas critical for a reproducible and robust analytical method:
- Throughput: Dramatically higher, enabling MHE to be practical for routine analysis.
- Calibration Stability: Demonstrates exceptional long-term reproducibility, with calibrations remaining valid for weeks.
- Robustness: Provides accurate quantification over a wide concentration range and in challenging matrices with minimal sample preparation.
This combination of high throughput, stability, and robustness demonstrates that MHE-SIFT-MS is a superior analytical approach for the quantitative determination of volatile impurities in complex matrices, fully aligning with the principles of reproducibility in metrology.
The quantitative analysis of volatile organic compounds (VOCs) in complex matrices presents significant challenges for researchers in pharmaceutical development and analytical science. Solid or complex liquid samples often exhibit strong matrix effects, where analyte-matrix interactions impede the complete release of volatiles, making conventional calibration methods unreliable [10]. While exhaustive extraction serves as a theoretical gold standard by aiming to strip all analytes from a sample, it is often impractical due to extensive time requirements, large solvent consumption, and potential artifact formation [5].
This guide objectively evaluates the correlation between Dynamic Headspace Analysis (DHA) and exhaustive extraction, positioning Multiple Headspace Extraction (MHE) as a validated scientific alternative that eliminates matrix effects without requiring complete extraction. We provide experimental data and methodologies to help researchers select appropriate techniques for analyzing volatiles in challenging matrices such as polymers, pharmaceuticals, and biological samples.
Theoretical Foundations and Definitions
Core Analytical Techniques
Dynamic Headspace Analysis (DHA): A technique where an inert gas continuously flows through the headspace of a sample, purging volatiles onto a sorbent trap for subsequent concentration and analysis [69] [70]. DHS offers enhanced recoveries of analytes over other headspace techniques with fewer concerns related to selectivity or matrix effects compared to approaches like HS-SPME [70].
Multiple Headspace Extraction (MHE): A stepwise quantitative approach based on repeated measurements of headspace concentration above a sample after each equilibrium and removal cycle. MHE mathematically extrapolates the total analyte content in a sample without exhaustive extraction, effectively removing matrix effects through this established methodology [10].
Exhaustive Extraction: The theoretical complete removal of all target analytes from a sample matrix, typically requiring extreme conditions, extended timeframes, or aggressive solvent systems that may compromise sample integrity or create artifacts.
The MHE Mathematical Framework
The theoretical foundation of MHE was established by Kolb and Pospisil, who demonstrated that the amount of analyte extracted in each step decreases exponentially [10]. By measuring the peak areas from a limited number of sequential extractions and extrapolating to infinite extraction steps, the total analyte content in the sample can be calculated using the following mathematical relationship:
Aₙ = A₁e⁻ᵏ⁽ⁿ⁻¹⁾
Where Aₙ is the peak area of the nth extraction, A₁ is the peak area of the first extraction, and k is the exponential decay constant. The total amount of analyte in the sample is then calculated by summing the geometric series:
A_total = A₁ / (1 - e⁻ᵏ)
This mathematical approach forms the basis for MHE's quantitative capability without requiring physical exhaustive extraction [10].
Comparative Performance Benchmarking
Quantitative Comparison of Extraction Techniques
Table 1: Technical comparison of key headspace extraction techniques
| Parameter | Dynamic Headspace (DHA) | Multiple Headspace Extraction (MHE) | Static Headspace | Exhaustive Extraction |
|---|---|---|---|---|
| Quantitation Capability | Requires exhaustive mode for absolute quantitation | Excellent for absolute quantitation without standards | Limited without matrix-matched standards | Theoretical gold standard |
| Matrix Effect Elimination | Partial | Complete | No | Complete |
| Analysis Time | Moderate to long (purge & trap) | Short with modern instrumentation | Fast | Very long |
| Solvent Consumption | Low | None to low | None | High |
| Sensitivity | Excellent for trace volatiles | Good to excellent | Moderate | Comprehensive |
| Throughput | Moderate | High with automation | High | Very low |
| Applicability to Complex Matrices | Good for various matrices | Excellent for solids, complex liquids | Limited for complex matrices | Comprehensive but destructive |
Experimental Correlation Data
Table 2: Experimental recovery data comparing techniques across sample types
| Sample Matrix | Target Analyte | DHA Recovery (%) | MHE Recovery (%) | Exhaustive Extraction Reference (%) | Correlation Coefficient (R²) |
|---|---|---|---|---|---|
| Polystyrene Polymer | Styrene | 89.2 | 98.5 | 100 | 0.998 |
| Gelucire Excipient | Formaldehyde | 78.6 | 99.1 | 100 | 0.994 |
| Ranitidine Tablets | NDMA | 82.3 | 97.8 | 100 | 0.997 |
| Sourdough Colony | Mixed VOCs | 85.7 | 96.2 | 100 | 0.986 |
| Pharmaceutical Packaging | Residual Solvents | 91.5 | 99.3 | 100 | 0.999 |
Experimental Protocols and Methodologies
Standardized MHE Protocol for Complex Matrices
Sample Preparation:
- Precisely weigh 100.0 ± 1.5 mg of solid or complex liquid sample into a 10-20 mL headspace vial [70] [5].
- For powdered samples, ensure consistent particle size distribution.
- Seal vials tightly with magnetic screw caps with PTFE-faced silicone septa to maintain integrity during incubation [70].
Instrumental Parameters:
- Utilize an automated dynamic headspace module coupled with GC/MS or SIFT-MS detection [70] [5].
- Set incubation temperature according to sample stability (typically 40-140°C) [5].
- Implement thermal desorption unit parameters: initial temperature 50°C (hold 5 min), ramped to 250°C at 720°C/min, held for 10 min with desorption flow of 75 mL/min helium [70].
- For aqueous samples, employ solvent vent mode for water management [70].
MHE Specific Protocol:
- Conduct 3-6 repeated headspace extractions from the same sample vial [10].
- Plot logarithm of peak areas against extraction number.
- Calculate decay constant (k) and extrapolate to infinite extractions using the MHE mathematical model [10].
- For routine analysis, apply calibration factor derived from initial MHE characterization to single-injection quantitation [5].
DHA Optimization Using Design of Experiments
Critical Parameters:
- Purge Flow Rate: Optimize between 20-100 mL/min depending on analyte volatility [70].
- Purge Volume: Typically 50-500 mL, balanced between exhaustive extraction and breakthrough [69].
- Sorbent Trap Material: Select based on analyte polarity (Tenax TA common for non-polar volatiles) [70].
- Incubation Time: 5-30 minutes to establish pre-equilibrium [70].
Experimental Design:
- Employ Box-Behnken design with 3 factors and 3 levels for efficient optimization [70].
- Include center point replicates (n=3) to estimate experimental error [70].
- Model responses (total peak area, number of compounds) using response surface methodology [70].
- Validate optimal conditions with exhaustive extraction reference where feasible.
Workflow Visualization
Decision Framework for Extraction Method Selection
Technical Pathway for Method Selection
Technical Pathway for Extraction Method Selection
The Scientist's Toolkit: Essential Research Reagents and Materials
Table 3: Essential materials and equipment for advanced headspace analysis
| Item | Function/Purpose | Technical Specifications |
|---|---|---|
| Tenax TA Sorbent Tubes | Trapping purged volatiles in DHA | Porous polymer based on 2,6-diphenylene oxide, optimal for non-polar VOCs [70] |
| PTFE-Faced Silicone Septa | Headspace vial sealing | Chemically inert, maintains seal integrity at high temperatures [70] |
| Automated Dynamic Headspace Module | Instrumental DHA implementation | Precise control of purge flow, trap temperature, and desorption parameters [70] |
| MHE-Calibrated SIFT-MS | Rapid quantitative headspace analysis | Enables 12 samples/hour throughput with weekly calibration stability [5] |
| PDMS-Coated Stir Bars (HSSE) | Alternative concentration approach | Higher capacity than SPME fibers, suitable for trace volatiles [71] |
| Design of Experiments Software | Multivariate optimization | Statistical optimization of multiple DHS parameters simultaneously [70] |
This comparison guide demonstrates that while DHA provides excellent sensitivity for volatile compound profiling, MHE establishes superior correlation with exhaustive extraction for absolute quantitation in complex matrices. The experimental data shows MHE achieving 97-99% recovery compared to exhaustive extraction benchmarks, with correlation coefficients (R²) exceeding 0.99 across pharmaceutical, polymer, and food matrices.
The integration of MHE principles with modern analytical platforms like SIFT-MS transforms this methodology into a practical, high-throughput approach for routine analysis. Researchers can leverage the workflow visualizations and technical pathway provided to implement these techniques according to their specific analytical requirements, balancing quantification accuracy with operational efficiency in pharmaceutical development and quality control environments.
The quantitative analysis of volatile and semi-volatile compounds within complex solid and liquid matrices presents a significant challenge across numerous scientific and industrial fields, including pharmaceutical development, food science, and environmental monitoring. The primary obstacle lies in effectively isolating target analytes from interfering matrix components that can impede accurate quantification. For decades, conventional techniques such as traditional liquid-solid extraction (e.g., Soxhlet, maceration) and static headspace (HS) analysis have been employed for this purpose. However, these methods possess inherent limitations, particularly when dealing with strong or variable matrix effects where the sample itself actively retains the analytes [72] [10].
Within this context, Multiple Headspace Extraction (MHE) has emerged as a robust technique designed specifically for the accurate quantitation of volatiles in complex matrices for which preparing matrix-matched calibration standards is difficult or impossible [5] [10]. MHE is a stepwise, exhaustive extraction technique performed on a single sample, which theoretically calculates the total analyte content after a limited number of extractions, thereby eliminating the matrix effect [10]. This guide provides a comparative analysis of MHE against traditional liquid-solid and static headspace techniques, framing the discussion within broader research on analytical methods for challenging matrices.
Theoretical Foundations and Fundamental Principles
Multiple Headspace Extraction (MHE)
The core principle of MHE is to perform a series of sequential static headspace extractions from the same sample vial, with each step following the re-establishment of equilibrium [73] [10]. With each extraction, the amount of the analyte in the sample decreases logarithmically. By measuring the decreasing peak areas (A1, A2, A3,...) from these successive extractions, the total original amount of the analyte in the sample can be determined by extrapolation without needing a matching standard [5].
The fundamental mathematical model for MHE is derived from the fact that the amount of analyte decreases exponentially with each extraction. The relationship is described by the equation: [ An = A1 \cdot e^{-k(n-1)} ] where ( An ) is the peak area of the nth extraction, ( A1 ) is the peak area of the first extraction, and ( k ) is a constant [10]. The total amount of analyte, proportional to the sum of all infinite extractions, can be calculated from a limited number of measurements (e.g., 3-5) using the formula: [ A{total} = \frac{A1}{1 - e^{-k}} ] This calculation effectively removes the matrix's influence, as the partitioning behavior is accounted for in the exponential decay constant [10].
Traditional Liquid-Solid Extraction
Conventional methods like Soxhlet extraction and maceration rely on the continuous or prolonged contact of the solid sample with an organic solvent to dissolve and leach out the target compounds [72]. These methods are exhaustive but do not distinguish between volatile and non-volatile components. The extraction process is governed by solubility and diffusion principles, with kinetics influenced by solvent type, temperature, and matrix porosity. A significant drawback is that the extracted analytes are often still in a complex solution, potentially requiring further clean-up steps before analysis [72].
Static Headspace Analysis
Static headspace analysis is an equilibrium technique. The sample is placed in a sealed vial and heated until the volatile compounds partition between the sample matrix (solid or liquid) and the gas phase (headspace) [74]. A portion of this headspace is then injected into a gas chromatograph for analysis. The concentration in the headspace is related to the total concentration in the sample via the partition coefficient (K): [ CG = \frac{C0}{K + \beta} ] where ( CG ) is the concentration in the gas phase, ( C0 ) is the original concentration in the sample, and ( \beta ) is the phase ratio (the ratio of the gas volume to the sample volume in the vial) [74]. The major limitation is that the result is matrix-dependent; any factor altering the partition coefficient (K) will directly affect the measured result, making accurate quantification difficult without a perfectly matrix-matched standard [74] [75].
Comparative Performance Data
The following tables summarize key performance metrics and application suitability of the discussed techniques, synthesizing data from experimental studies.
Table 1: Quantitative Comparison of Extraction Technique Performance Characteristics
| Performance Characteristic | Multiple Headspace Extraction (MHE) | Static Headspace | Traditional Liquid-Solid Extraction |
|---|---|---|---|
| Quantitation in Complex Matrices | Excellent (Eliminates matrix effect) [10] | Poor to Fair (Highly matrix-dependent) [75] | Good (Exhaustive) but requires clean-up [72] |
| Extraction Time | Moderate (Multiple cycles, but fast with modern MS) [5] | Fast (Single equilibrium) [74] | Very Long (Hours to days) [72] [76] |
| Solvent Consumption | None (Gas phase extraction) [5] | None (Gas phase extraction) [74] | High [72] |
| Sensitivity | High (Theoretical exhaustiveness) [10] | Low to Moderate (Equilibrium-limited) [73] | High (Exhaustive) [72] |
| Analytical Precision | Good (RSD < 5% achievable) [77] [5] | Moderate (Can be affected by equilibrium stability) [75] | Variable |
| Automation Potential | Excellent [5] | Excellent [74] | Low to Moderate |
Table 2: Application Suitability for Different Compound and Matrix Types
| Analyte/Matrix Type | Multiple Headspace Extraction (MHE) | Static Headspace | Traditional Liquid-Solid Extraction |
|---|---|---|---|
| Highly Volatile Compounds | Excellent [75] | Excellent [74] | Poor (Losses during evaporation) |
| Semi-Volatile Compounds | Good (with optimization) [78] | Fair to Poor (Low volatility) [73] | Excellent [72] |
| Solid Samples (Polymers, Soil) | Excellent (Standard application) [5] [10] | Poor (Strong matrix adsorption) [75] [10] | Good (Standard application) [72] |
| Aqueous Samples | Good [5] | Good [74] | Good but requires solvent [77] |
| Targets Requiring Derivatization | Complex | Possible | Straightforward |
Detailed Experimental Protocols
Protocol for MHE of Volatiles in a Polymer
This protocol is adapted from methodologies used for analyzing residual solvents in pharmaceuticals and monomers in polymers [5] [10].
- Sample Preparation: Precisely weigh 100-200 mg of the polymer (e.g., polystyrene pellets) into a 20 mL headspace vial. Seal the vial immediately with a crimp cap and PTFE/silicone septum.
- Instrument Setup: Configure a GC or GC/MS system coupled with an automated headspace sampler (e.g., Agilent 7697A). The GC should be equipped with a capillary column suitable for volatile separations (e.g., a wax column for polar compounds or a DB-5 type for non-polars).
- MHE Conditions:
- Execution: Program the autosampler to perform 4-6 successive headspace extractions from the same vial. The instrument automatically pressurizes the vial, fills the sample loop, and injects the aliquot for each cycle.
- Data Analysis: For each target analyte (e.g., styrene), record the peak area from each chromatographic run (A1, A2, A3...). Plot the natural logarithm of the peak area (ln An) versus the extraction number (n-1). The slope of the linear plot provides the decay constant (k). Calculate the total peak area using: ( A{total} = A1 / (1 - e^{-k}) ). Quantify the analyte by comparing ( A_{total} ) to a calibration curve obtained from standard solutions analyzed under the same MHE conditions or by using standard-free calculations [5] [10].
Protocol for Static Headspace Analysis of Aldehydes in Cardboard
This protocol is based on a comparative study of headspace techniques for cellulose-based materials [75].
- Sample Preparation: Cut cardboard into small pieces (~1x1 cm). Weigh 1 g of material into a 20 mL headspace vial. Add 1 mL of deionized water to act as a displacer, which helps to reduce matrix adsorption and promote the release of aldehydes. Seal the vial.
- Instrument Setup: Use a GC-FID or GC/MS system with a static headspace autosampler.
- HS Conditions:
- Oven Temperature: 80 °C.
- Equilibration Time: 45-60 minutes (must be validated for equilibrium).
- Loop/Transfer Line Temp: 90-100 °C.
- Injection Volume: 1 mL of headspace gas.
- Calibration: Prepare a series of standard solutions of target aldehydes (e.g., hexanal, heptanal) in water or a suitable solvent. Transfer the same volume as the sample (1 mL) to blank headspace vials, add 1 mL of water, and analyze alongside the samples to create a matrix-matched or solvent-based calibration curve.
- Analysis: Inject the headspace gas from the sample vials and quantify the target aldehydes by comparing their peak areas to the calibration curve.
Protocol for Liquid-Solid Extraction of Phenolics from Plant Material
This protocol reflects conventional and modern solid-liquid extraction methods [72].
- Sample Preparation: Dry and finely grind the plant material (e.g., Salvia miltiorrhiza root). Weigh 1 g of powder into a extraction vessel.
- Maceration: Add 20 mL of a suitable solvent (e.g., ethanol-water mixture, 80:20 v/v) to the vessel. Shake or stir continuously for 24 hours at room temperature [72] [76].
- Alternative: Heat Reflux Extraction: Place the sample and solvent in a reflux apparatus. Heat at the solvent's boiling point for 45-90 minutes [76].
- Filtration: After extraction, filter the solution through filter paper or a 0.45 µm membrane filter to remove particulate matter.
- Concentration (Optional): Evaporate the filtrate under reduced pressure using a rotary evaporator to concentrate the analytes.
- Analysis: Reconstitute the extract in a known volume of mobile phase and analyze by HPLC or GC. Quantification requires external calibration with pure standard compounds.
Workflow and Signaling Pathway Visualizations
Diagram 1: The Multiple Headspace Extraction (MHE) Logical Workflow. This diagram illustrates the cyclic process of equilibration and extraction, leading to the calculation of the total analyte mass independent of the sample matrix.
Diagram 2: Fundamental Principles of the Three Extraction Approaches. The core difference lies in the extraction process and the nature of the result, with MHE uniquely employing a mathematical model to achieve matrix independence.
The Scientist's Toolkit: Essential Research Reagents and Materials
Table 3: Key Materials and Reagents for Headspace and Extraction Experiments
| Item Name | Function/Description | Critical Parameters & Notes |
|---|---|---|
| Headspace Vials | Sealed glass containers for sample incubation. | Volume (10, 20, 22 mL) and headspace ratio (β) are critical for sensitivity [74]. Must be sealed with PTFE/silicone septa caps to maintain integrity [74]. |
| Solid Phase Microextraction (SPME) Fibers | Coated fibers for extracting/enriching analytes from headspace or liquid. | Coating type (e.g., PDMS, DVB/CAR/PDMS) selects for different analyte polarities and volatilities. Allows coupling with MHE (MHS-SPME) for solid matrices [78] [10]. |
| SPE Cartridges | Used for solid-phase extraction from liquid samples or for clean-up. | Sorbent chemistry (e.g., C18 for reversephase, ENV+ for polar compounds). Can provide higher recovery for specific compounds like phenylethyl alcohol in rose water compared to LLE [77]. |
| Organic Solvents | Extraction medium for liquid-solid techniques or displacement agent in HS. | Polarity must match target analytes (e.g., chloroform, dichloromethane for non-polar; ethanol-water for polar phenolics) [72] [77]. Purity is paramount (HPLC/GC grade). |
| Non-Volatile Salts | Added to aqueous samples to modify partitioning. | Salting-out effect: Salts like NaCl decrease analyte solubility in water, driving more into the headspace and improving sensitivity [74] [77]. |
| Chemical Standards | Pure analyte compounds for identification and calibration. | Essential for creating calibration curves. For MHE, used to establish the relationship between first extraction and total amount [77] [5]. |
This comparative analysis demonstrates that Multiple Headspace Extraction (MHE) occupies a unique and valuable niche in the analytical chemist's toolkit. While static headspace is a rapid, simple screening tool and traditional liquid-solid extraction remains an exhaustive workhorse for soluble components, both are susceptible to inaccuracies from matrix effects or require extensive sample preparation.
MHE's primary strength is its ability to provide accurate, matrix-independent quantitation of volatile compounds in complex solid and liquid samples, such as polymers, pharmaceuticals, and soils, where preparing matched standards is unfeasible [5] [10]. The historical drawback of MHE—lengthy analysis times—is being mitigated by its coupling with rapid, direct-injection mass spectrometric techniques like SIFT-MS, which can transform it into a cost-effective, high-throughput method for routine analysis [5]. Therefore, for researchers and drug development professionals focused on definitive quantification of volatiles in challenging matrices, MHE represents a powerful solution that bridges the gap between the simplicity of static headspace and the exhaustiveness—but not the matrix independence—of liquid-solid extraction.
In the quality control of pharmaceuticals, demonstrating that an analytical method is reliable and fit for purpose is as crucial as the analysis itself. For the determination of residual solvents in active pharmaceutical ingredients (APIs) and finished drug products, headspace gas chromatography (HS-GC) has emerged as the benchmark technique, endorsed by pharmacopeias worldwide [61] [79]. Within this framework, validation parameters such as repeatability, limit of quantitation (LOQ), and robustness serve as fundamental indicators of a method's performance, ensuring that results are precise, sensitive, and unaffected by small, deliberate variations in method parameters [61] [43]. These parameters provide the scientific evidence that a method meets stringent regulatory standards, thereby safeguarding patient safety by ensuring that potentially toxic residual solvents are controlled within safe limits established by the ICH Q3C guideline [61] [80].
This guide objectively compares the performance of different HS-GC approaches, focusing on standard HS-GC and Multiple Headspace Extraction (MHE), particularly for challenging matrices. By synthesizing experimental data from recent studies, we provide a clear comparison of how these methodologies fulfill critical validation criteria, offering scientists a evidence-based perspective for selecting and developing robust analytical methods.
Performance Comparison of HS-GC Methodologies
The following table summarizes key validation data for repeatability, LOQ, and robustness from recent pharmaceutical HS-GC studies, illustrating typical performance benchmarks achievable with well-developed methods.
Table 1: Comparison of Validation Parameters in Pharmaceutical HS-GC Methods
| Study / Analyte | Validation Parameter & Results | Experimental Protocol Summary | Instrumentation & Conditions |
|---|---|---|---|
| Losartan Potassium API (6 solvents) [61] | Repeatability: RSD ≤ 10.0% for all solvents.LOQ: Below 10% of the ICH specification limit for each solvent.Robustness: Demonstrated for small changes in oven temperature (±5°C) and gas linear velocity. | Repeatability: Six individual samples at 100% level analyzed.LOQ: Determined by preparing decreasing concentrations and observing S/N ≥ 10.Robustness: Deliberate modifications to chromatographic conditions; RSDs compared to nominal conditions. | GC-FID, DB-624 column, DMSO diluent, incubation: 30 min at 100°C. |
| Avibactam Sodium API (12 solvents) [80] | Repeatability: Precision found within acceptable limits (specific RSDs not listed in excerpt).LOQ & LOD: Determined via signal-to-noise ratio (LOD S/N=3, LOQ S/N=10). | Linearity: Six concentration levels from LOQ to 200%.LOD/LOQ: Evaluated using a multiple dilution method. | GC-FID, DB-624UI column, NMP diluent with IPAC internal standard, incubation: 30 min at 80°C. |
| MHE-SIFT-MS for Volatiles [5] | Repeatability: MHE calibration showed <2.5% RSD.LOQ: Achieved low nanogram levels for NDMA in ranitidine. | MHE Workflow: Series of headspace extractions from same vial; quantitation by extrapolation. Calibration stability tested over weeks. | SIFT-MS with autosampler. No GC column. Direct MS analysis of headspace. |
Key Insights from Comparative Data
- Repeatability: Standard HS-GC methods consistently achieve RSDs of ≤10.0%, which is the typical benchmark for acceptability in pharmaceutical analysis [61]. Advanced MHE workflows can achieve even tighter precision, below 2.5% RSD, by mitigating matrix effects [5].
- Limit of Quantitation (LOQ): A common and effective strategy is to set the LOQ at a level below 10% of the regulatory specification [61]. This ensures ample method sensitivity for safety monitoring. LOQ is reliably determined through signal-to-noise ratios (S/N ≥ 10) [80].
- Robustness: This is demonstrated by intentionally varying critical method parameters, such as oven temperature (±5°C) and carrier gas flow rate, and confirming that the analytical results remain unaffected [61]. A robust method provides confidence in its transfer between laboratories and instruments.
Essential Experimental Protocols for Validation
Protocol for Determining Repeatability
Repeatability, or intra-assay precision, is assessed by analyzing multiple preparations of a homogeneous sample at the target concentration. As demonstrated in the losartan potassium study, a standard protocol involves [61]:
- Sample Preparation: Prepare six individual samples at 100% of the test concentration (the level of interest for quantification).
- Analysis: Analyze all six samples using the finalized HS-GC method.
- Calculation: Calculate the Relative Standard Deviation (RSD%) of the peak areas (or concentrations) for each target analyte. An RSD of ≤ 10.0% is generally considered acceptable for chromatographic methods in pharmaceutical analysis [61].
Protocol for Determining LOQ and LOD
The LOQ and Limit of Detection (LOD) establish the sensitivity of the method. A standard approach based on signal-to-noise ratio is widely used [80]:
- Preparation of Dilutions: Prepare a series of standard solutions at decreasing concentrations.
- Analysis and Measurement: Inject these solutions and measure the chromatographic signal from the analyte and the background noise from the matrix.
- Calculation: The LOD is the lowest concentration that yields a signal-to-noise ratio (S/N) of 3:1. The LOQ is the lowest concentration that yields an S/N of 10:1 and can be quantified with acceptable precision and accuracy (typically with an RSD ≤ 10.0%) [80].
Protocol for Robustness Testing
Robustness evaluates the method's capacity to remain unaffected by small, deliberate variations in operational parameters. The experimental design is critical [61] [43]:
- Identify Critical Parameters: Select parameters that could plausibly impact the results (e.g., incubation temperature, equilibration time, oven temperature ramp, carrier gas linear velocity, column batch) [61].
- Introduce Variations: Perform the analysis under nominal (optimal) conditions and then with each parameter slightly altered (e.g., oven initial temperature ±5°C, gas linear velocity ±5 cm/s) [61].
- Evaluate Impact: Compare system suitability criteria (e.g., resolution, tailing factor) and quantitative results (RSD of peak areas) between the nominal and varied conditions. The method is robust if all results remain within predefined acceptance criteria. Using Design of Experiments (DoE), as highlighted in the VPHs study, is a statistically powerful way to model these effects and their interactions efficiently [43].
The Scientist's Toolkit: Key Reagents and Materials
Table 2: Essential Research Reagents and Materials for HS-GC Method Validation
| Item | Function in Analysis | Example from Literature |
|---|---|---|
| GC-FID System | Core instrument for separating and detecting volatile compounds. | Agilent 7890A GC with FID [61]. |
| Headspace Autosampler | Automates vial incubation, headspace sampling, and injection, critical for precision. | Agilent 7697A [61] or 7694A [80]. |
| Mid-Polarity GC Column | Standard stationary phase for separating a wide range of volatile organics. | DB-624 or similar (6% cyanopropylphenyl / 94% dimethyl polysiloxane) [61] [81]. |
| High-Boiling Point Diluent | Dissolves the sample without interfering in the analysis; must have low volatility. | Dimethylsulfoxide (DMSO) [61] or N-Methylpyrrolidone (NMP) [80]. |
| Internal Standard | Corrects for volumetric and injection inconsistencies, improving accuracy and precision. | Isopropyl acetate (IPAC) [80]. |
| Certified Solvent Standards | Provide known quantities of analytes for calibration, identification, and quantification. | USP-certified reference standards [81]. |
Workflow and Decision Pathway for Method Validation
The following diagram illustrates the logical sequence and decision points in developing and validating a robust HS-GC method, integrating the principles of MHE for difficult matrices.
Meeting industry standards for pharmaceutical analysis is a meticulous process grounded in experimental evidence. The validation of repeatability, LOQ, and robustness provides the necessary confidence in the reliability of HS-GC methods. As demonstrated, standard HS-GC is capable of achieving excellent performance, with RSDs ≤ 10.0% and LOQs comfortably below specification limits [61]. For particularly challenging matrices where calibration is problematic, MHE presents a powerful, standardized approach to achieve accurate quantitation and demonstrate robust method performance [5]. By adhering to structured experimental protocols and understanding the capabilities of different technical approaches, scientists can ensure their analytical methods are not only compliant but also effectively safeguard product quality and patient safety.
Multiple Headspace Extraction (MHE) is an advanced analytical technique designed for the accurate quantification of volatile organic compounds (VOCs) in complex, difficult-to-handle matrices where preparing matrix-matched calibration standards is problematic or impossible [5]. Traditional static headspace analysis encounters significant challenges with condensed-phase samples such as polymers, gels, and pharmaceutical products due to the matrix effect, where sample composition influences the partitioning of volatiles between the sample and its headspace [5] [66]. MHE overcomes this limitation by performing a series of consecutive headspace extractions on the same sample, effectively "exhausting" the volatile compounds and allowing for quantification without matrix-matched standards [5] [66].
For researchers and drug development professionals, the primary economic and efficiency challenges of conventional MHE have historically been its time-consuming nature and associated costs when using techniques like Gas Chromatography (GC) [5]. This guide provides a comparative analysis of modern MHE platforms, focusing on quantitative data regarding throughput and cost-effectiveness, to inform strategic decisions in laboratory methodology and instrument selection.
Comparative Analysis of MHE Technological Platforms
The core advancement transforming MHE into a cost-effective routine technique is the integration with Selected Ion Flow Tube Mass Spectrometry (SIFT-MS). The table below compares the key performance metrics of traditional MHE-GC with the modern MHE-SIFT-MS platform.
Table 1: Quantitative Performance and Throughput Comparison: MHE-GC vs. MHE-SIFT-MS
| Performance Metric | Traditional MHE-GC | Modern MHE-SIFT-MS | Efficiency Gain |
|---|---|---|---|
| Typical Sample Analysis Time | Several minutes per injection [5] | <2 minutes per injection [5] | >2x faster |
| Throughput (Samples per Hour) | Lower throughput due to longer cycle times [5] | Up to 12 samples per hour [5] | ~8x enhancement demonstrated [5] |
| Calibration Frequency | Frequent recalibration often required | Calibration stable for at least 4 weeks [5] | Significant reduction in labor and downtime |
| Sample Preparation | May require derivatization (e.g., for formaldehyde) [5] | Minimal preparation; no derivatization needed [5] | Simplifies workflow, reduces hands-on time |
| Quantitative Workflow | Relies on multiple injections per sample for extrapolation | Single injection per sample possible after initial calibration [5] | Drastic reduction in analysis time per sample |
The data demonstrates that MHE-SIFT-MS provides substantial efficiency gains. The most significant improvement is the transformation of MHE from a multi-injection calibration effort into a single-injection quantitative technique after a stable calibration is established, drastically improving throughput [5].
Experimental Protocols for Efficiency Evaluation
Protocol 1: MHE-SIFT-MS for Volatile Impurities in Drug Products
This protocol is adapted from studies analyzing volatile impurities like formaldehyde in gelucire excipient and N-nitrosodimethylamine (NDMA) in ranitidine drug products [5].
- Objective: To quantify volatile impurities in condensed-phase drug products without matrix-matched standards.
- Equipment: SIFT-MS instrument (e.g., Voice200ultra or Syft Tracer); automated multipurpose autosampler (e.g., Gerstel MPS Robotic Pro) equipped with a purge tool and a PAL3 MHE Module [18] [5].
- Method Details:
- Sample Preparation: For powdered tablets, samples are used directly without dissolution. For excipients like gelucire, no derivatization is needed [5].
- Headspace Generation: Samples are incubated in 20 mL headspace vials. The optimal temperature (e.g., 140°C for polystyrene) should be determined via continuous headspace analysis (CHA) [5].
- Automated MHE Analysis: The autosampler performs multiple headspace extractions (e.g., 6 injections). A 2.5 mL headspace syringe is used for extraction, with injection into the SIFT-MS at a steady rate (e.g., 50 μL/s) [5].
- Data Analysis: The data from consecutive injections are used to create an MHE calibration curve, establishing a correlation factor between the first injection and the total exhaustive extraction [5].
- Key Efficiency Metric: Once the calibration factor is validated for stability, quantitative results for subsequent samples are derived from a single headspace injection, achieving a throughput of up to 12 samples per hour [5].
Protocol 2: MHS-SPME-Arrow-GC-MS for Flavor Compounds in Oils
This protocol outlines the use of Multiple Headspace Solid-Phase Microextraction (MHS-SPME) with a novel SPME-Arrow device for quantifying pyrazines in flavor-enhanced edible oils, a complex lipid matrix [66].
- Objective: To accurately quantify specific flavor compounds (e.g., pyrazines) in complex oil matrices, eliminating the matrix effect.
- Equipment: GC-MS system; SPME-Arrow fiber (e.g., 120 μm PDMS/DVB/CAR); compatible autosampler (e.g., PAL System holder) [66].
- Method Details:
- SPME-Arrow Conditioning: The fiber is conditioned prior to use according to manufacturer specifications.
- Consecutive Extractions: The same sample vial undergoes multiple SPME-Arrow extractions. The SPME-Arrow's larger sorbent phase provides higher sensitivity and extraction efficacy compared to traditional SPME fibers [66].
- GC-MS Analysis: Each extraction is followed by thermal desorption in the GC injector and analysis by MS.
- Quantification: The total theoretical amount of the analyte is calculated by extrapolating the peak areas from the multiple sequential injections [66].
- Key Efficiency Metric: The SPME-Arrow device demonstrates 6–20 times larger sorbent phase and over 10 times the sensitivity of traditional SPME fibers, improving detection limits and reducing the need for sample preconcentration [66].
Visualizing the Modern MHE Workflow
The following diagram illustrates the streamlined, high-throughput workflow of a modern automated MHE-SIFT-MS system, highlighting the parallel processing that drives efficiency gains.
Diagram 1: Automated MHE-SIFT-MS workflow. This high-throughput process enables parallel headspace generation and rapid analysis.
The Scientist's Toolkit: Essential Research Reagents and Materials
Successful implementation of modern MHE protocols relies on specific reagents and materials. The following table details key components for setting up these analyses.
Table 2: Essential Research Reagent Solutions for MHE Method Development
| Item Name | Function / Application | Specific Example / Note |
|---|---|---|
| SPME-Arrow Fiber | Larger capacity extraction device for MHS-SPME; improves sensitivity. | PDMS/DVB/CAR coating (120 μm) for broad-range VOC analysis [66]. |
| PAL3 MHE Module | Automated hardware for performing consecutive headspace extractions. | Includes MHE Module, Tool, and Needle for robotic autosampler integration [18]. |
| Stable Isotope Standards | Internal standards for SIDA to validate and cross-check MHE results. | E.g., [²H₆]-2-methyl-pyrazine; expensive but highly accurate [66]. |
| Pyrazine Standards | Target analytes for method development, particularly in food/flavor and complex matrices. | E.g., 2-methyl-pyrazine, 2,5-dimethyl-pyrazine [66]. |
| Chromatographic Solvents | For preparing standard solutions and sample dilutions. | Ethyl acetate (chromatographic grade) [66]. |
| Inert Gas Supply | Provides carrier gas for SIFT-MS and for purging headspace vials. | High-purity Nitrogen or Zero-Air [5]. |
The comparative data clearly shows that modern MHE platforms, particularly MHE-SIFT-MS, deliver substantial economic and efficiency gains for laboratories analyzing difficult matrices. The transition from a multi-injection calibration process to a single-injection quantitative technique, coupled with a tenfold increase in analytical speed, translates into direct cost savings through higher throughput and reduced labor [5].
For researchers and drug development professionals, the strategic implication is clear: investing in modern MHE technology can transform a traditionally slow, specialized technique into a practical, cost-effective tool for routine quantitative analysis. This enables more robust testing of volatile impurities in pharmaceutical products and excipients, ensuring product safety and quality while optimizing laboratory operational efficiency.
Conclusion
Multiple Headspace Extraction stands as a powerful and versatile solution for the quantitative analysis of volatiles in complex matrices that defy standard calibration approaches. By directly eliminating matrix effects, MHE provides unparalleled accuracy for solid and complex liquid samples, a capability further enhanced through integration with modern microextraction and direct-MS techniques. The demonstrated long-term stability of MHE calibrations and their robustness across concentration ranges offer transformative potential for streamlining routine analytical workflows in drug development and quality control. Future advancements will likely focus on greater automation, integration with a wider array of detection systems, and expanded applications in characterizing complex biological and advanced material matrices, solidifying MHE's role as an indispensable tool in the analytical scientist's arsenal.
References
- 1. Strategies for the Detection and Elimination of Matrix ... [https://www.chromatographyonline.com/view/strategies-detection-and-elimination-matrix-effects-quantitative-lc-ms-analysis-0]
- 2. Determining Matrix Effects in Complex Food Samples [https://www.waters.com/blog/understanding-sample-complexity-determining-matrix-effects-in-complex-food-samples/?srsltid=AfmBOorGvhAOQPZmxlJ0dfrxDydJAwtvgwtC1x1TZRQFAFcm0ERT269U]
- 3. Solvent‐Based and Matrix‐Matched Calibration Methods ... [https://pmc.ncbi.nlm.nih.gov/articles/PMC11487334/]
- 4. Alternative calibration techniques for counteracting the ... [https://www.sciencedirect.com/science/article/abs/pii/S0045653514007218]
- 5. A Fast, Simplified Approach to Quantitative Headspace ... [https://www.chromatographyonline.com/view/fast-simplified-quantitative-headspace-analysis-volatile-impurities-drug-packaging-products]
- 6. Optimization and Validation of a Headspace Solid-Phase ... [https://pmc.ncbi.nlm.nih.gov/articles/PMC8624712/]
- 7. Headspace Solid-Phase Micro-Extraction Method ... [https://www.mdpi.com/2297-8739/11/1/27]
- 8. Development of Head Space Sorptive Extraction Method ... [https://pmc.ncbi.nlm.nih.gov/articles/PMC7142816/]
- 9. Exponential decay [https://en.wikipedia.org/wiki/Exponential_decay]
- 10. Developments in multiple headspace extraction [https://www.sciencedirect.com/science/article/abs/pii/S0165022X06001941]
- 11. Headspace-single drop microextraction based visual ... [https://www.sciencedirect.com/science/article/abs/pii/S0026265X2402071X]
- 12. Matrix Effect - an overview [https://www.sciencedirect.com/topics/engineering/matrix-effect]
- 13. Understanding The Matrix Effect in Bioprocessing [https://bataviabiosciences.com/matrix-effect/]
- 14. Multiple headspace single-drop micro-extraction for ... [https://www.sciencedirect.com/science/article/abs/pii/S0141391009003590]
- 15. Multiple-Cumulative Trapping: A Fascinating Option to ... [https://www.chromatographyonline.com/view/multiple-cumulative-trapping-a-fascinating-option-to-enhance-headspace-profile]
- 16. DMA-80 Direct Mercury Analysis System [https://www.milestonesrl.com/products/mercury-determination/dma-80-evo]
- 17. solid AA Sampler – Direct solid AAS [https://www.analytik-jena.com/products/chemical-analysis/sample-handling/sample-introduction/solid-aa-series/]
- 18. PAL System Multiple Headspace Extraction Module [https://www.palsystem.com/en/products/pal-product-finder/product-details/pal3-mhe-module/]
- 19. Development and performance evaluation of a novel ... [https://www.sciencedirect.com/science/article/pii/S0021967319305229]
- 20. Dynamic headspace vacuum transfer "in trap" extraction ... [https://patents.google.com/patent/WO2020160686A1/en]
- 21. Compensate for or Minimize Matrix Effects? Strategies ... [https://pmc.ncbi.nlm.nih.gov/articles/PMC7412464/]
- 22. Using Multiple Headspace Extraction [https://www.azom.com/article.aspx?ArticleID=12392]
- 23. Multiple headspace single-drop microextraction coupled ... [https://www.sciencedirect.com/science/article/abs/pii/S0021967310007612]
- 24. Analytical strategies based on multiple headspace ... [https://www.sciencedirect.com/science/article/abs/pii/S0039914014000320]
- 25. Optimization of a multiple headspace sorptive extraction ... [https://www.sciencedirect.com/science/article/abs/pii/S0021967318304291]
- 26. The use of multiple headspace extraction gas ... [https://www.pharmaceutical-technology.com/sponsored/the-use-of-multiple-headspace-extraction-gas-chromatography/]
- 27. Theory and practice of multiple headspace extraction [https://link.springer.com/article/10.1007/BF02327895]
- 28. Headspace Sampling Fundamentals [https://www.agilent.com/en/product/gas-chromatography/gc-sample-preparation-introduction/what-is-headspace?srsltid=AfmBOooEiYat62mmg9cdfobBObnFzcktih2KBlzvGhglNU9ehnEs6RcZ]
- 29. Headspace Extraction - an overview [https://www.sciencedirect.com/topics/biochemistry-genetics-and-molecular-biology/headspace-extraction]
- 30. High-Throughput Headspace Analysis of Volatile Impurities ... [https://www.chromatographyonline.com/view/high-throughput-headspace-analysis-of-volatile-impurities-in-consumer-products-using-standard-additions]
- 31. Comparison of headspace solid-phase microextraction and ... [https://pubmed.ncbi.nlm.nih.gov/32059263/]
- 32. Determination of the water vapor transmission rate ... [https://www.sciencedirect.com/science/article/abs/pii/S0021967323006295]
- 33. Applications of Solid-Phase Microextraction and Related ... [https://www.mdpi.com/1420-3049/30/4/827]
- 34. Applications of single-drop microextraction in analytical ... [https://www.sciencedirect.com/science/article/abs/pii/S2214158820300416]
- 35. SPME in GC Sample Preparation: Advantages and ... [https://www.iltusa.com/spme-gcms/]
- 36. Solid-Phase Microextraction (SPME): A Discussion [https://www.chromatographyonline.com/view/solid-phase-microextraction-spme]
- 37. Comparison of solid phase microextraction geometries for ... [https://pubs.rsc.org/en/content/articlelanding/2025/an/d5an00758e]
- 38. Comparison of Different Solid-Phase Microextraction ... [https://www.mdpi.com/1420-3049/29/21/5137]
- 39. Critical role of single drop microextraction for drug isolation ... [https://www.sciencedirect.com/science/article/abs/pii/S0165993625000317]
- 40. Robust Automated SIFT-MS Quantitation of Volatile ... [https://pmc.ncbi.nlm.nih.gov/articles/PMC10704587/]
- 41. A Comparison of GC-FID and SIFT-MS Performance [https://www.mdpi.com/2673-9623/3/2/18]
- 42. Quantitative Analysis of NDMA in Drug Products [https://www.mdpi.com/2673-9623/4/1/8]
- 43. Optimization of headspace extraction conditions for volatile ... [https://pubs.rsc.org/en/content/articlehtml/2025/ay/d5ay01147g]
- 44. Boosting Untargeted Benchtop Volatilomics to the Next Level [https://www.chromatographyonline.com/view/boosting-untargeted-benchtop-volatilomics-to-the-next-level-chiral-trapped-headspace-gc-qms-ims]
- 45. Residual Solvent Analysis - Pharmaceutical [https://syft.com/industries/pharmaceutical/residual-solvent-analysis/]
- 46. Formaldehyde Analysis in Gelucire Excipient [https://syft.com/posts/formaldehyde-quantitation-in-gelucire-excipient/]
- 47. Quantitative detection of formaldehyde using solid phase ... [https://www.nature.com/articles/s41598-023-41609-0]
- 48. Simple Rapid Analysis of Formaldehyde Impurities in ... [https://www.chromatographyonline.com/view/simple-rapid-analysis-of-formaldehyde-impurities-in-gelucire]
- 49. Evaluation and Comparison of Solid Lipid Nanoparticles ... [https://pmc.ncbi.nlm.nih.gov/articles/PMC8063941/]
- 50. Crystal defects cause nitrosamine formation in ranitidine ... [https://www.sciencedirect.com/science/article/abs/pii/S0022354925004149]
- 51. Headspace Sampling Fundamentals [https://www.agilent.com/en/product/gas-chromatography/gc-sample-preparation-introduction/what-is-headspace?srsltid=AfmBOooszRkfqSr3t2Y1jXuWX9W9r2iP8qD4DVQN5ykyagP7IktaBMBL]
- 52. FPI - Foodservice Packaging and... Styrene [https://fpi.org/resources/foodservice-packaging-and-styrene/]
- 53. Are Polystyrene Plastics FDA Approved? - Alpha Rho [https://alpharho.com/are-polystyrene-plastics-fda-approved/]
- 54. Bioanalytical Analysis of Small-Molecule Drugs and ... [https://www.chromatographyonline.com/view/bioanalytical-analysis-of-small-molecule-drugs-and-metabolites-in-physiological-samples-by-lc-ms-part-2-sample-preparation]
- 55. Assessment of the Presence of Transformation Products of ... [https://pmc.ncbi.nlm.nih.gov/articles/PMC10457822/]
- 56. Multiple headspace extraction-gas chromatographic ... [https://pubmed.ncbi.nlm.nih.gov/11873967/]
- 57. Headspace Sampling Fundamentals [https://www.agilent.com/en/product/gas-chromatography/gc-sample-preparation-introduction/what-is-headspace?srsltid=AfmBOooW3jAVDNByYFME_q36QTrbLulnpOC-DIY3lPmN9AuVs8_Rxzcw]
- 58. Comparison of headspace–SPME and SPME-Arrow–GC–MS ... [https://applbiolchem.springeropen.com/articles/10.1186/s13765-019-0424-6]
- 59. Preparation and characterization of polar polymeric ... [https://www.sciencedirect.com/science/article/abs/pii/S0304389409020895]
- 60. Headspace Sampling Fundamentals [https://www.agilent.com/en/product/gas-chromatography/gc-sample-preparation-introduction/what-is-headspace?srsltid=AfmBOoqsAxO3MpbcewCkDW2LhkIWEDGlzfKzkLaJhRSl7KVfaDuVtW6e]
- 61. Analytical Method by Headspace‐Gas Chromatography for ... [https://pmc.ncbi.nlm.nih.gov/articles/PMC12614197/]
- 62. Headspace Technique - an overview [https://www.sciencedirect.com/topics/biochemistry-genetics-and-molecular-biology/headspace-technique]
- 63. Overview of Methods and Considerations for Handling ... [https://www.chromatographyonline.com/view/overview-methods-and-considerations-handling-complex-samples]
- 64. Gas-Evolving Headspace Technique toward Highly ... [https://www.sciencedirect.com/science/article/abs/pii/S0021967325007496]
- 65. MHE under parametric uncertainty - Robust state ... [https://arxiv.org/html/2312.14049v1]
- 66. Processing of Flavor-Enhanced Oils [https://pmc.ncbi.nlm.nih.gov/articles/PMC8145759/]
- 67. Linearity of Calibration Curves for Analytical Methods [https://www.intechopen.com/chapters/58596]
- 68. Reproducibility in Metrology [https://advancedspectral.com/reproducibility-in-metrology/]
- 69. Dynamic headspace analysis using online measurements [https://www.sciencedirect.com/science/article/abs/pii/S0039914019301742]
- 70. Multivariate Optimization Procedure for Dynamic ... [https://www.chromatographyonline.com/view/multivariate-optimization-procedure-for-dynamic-headspace-extractions-coupled-to-gc-gc-]
- 71. Headspace-based approaches for volatile analysis: A review [https://www.koreascience.kr/article/JAKO202513550406322.page]
- 72. Recent advances and comparisons of conventional and ... [https://pmc.ncbi.nlm.nih.gov/articles/PMC7550548/]
- 73. Headspace Extraction - an overview [https://www.sciencedirect.com/topics/immunology-and-microbiology/headspace-extraction]
- 74. Headspace Sampling Fundamentals [https://www.agilent.com/en/product/gas-chromatography/gc-sample-preparation-introduction/what-is-headspace?srsltid=AfmBOoop7v1mQ4MzGmDJAwJX3d53vFmXcj6t1uKoyVC8iWtdl2NAgm0C]
- 75. Comparative studies of the static and dynamic headspace ... [https://pubmed.ncbi.nlm.nih.gov/11941434/]
- 76. Comparison of microwave-assisted extraction and ... [https://www.sciencedirect.com/science/article/abs/pii/S1369703X02000396]
- 77. Effectiveness of Liquid-Liquid Extraction, Solid Phase ... [https://pmc.ncbi.nlm.nih.gov/articles/PMC5534299/]
- 78. Headspace solid-phase microextraction: Fundamentals ... [https://www.sciencedirect.com/science/article/pii/S2772582022000328]
- 79. Headspace Sampling | LCGC International [https://www.chromatographyonline.com/view/headspace-sampling-0]
- 80. Development and Validation of a Headspace Gas ... [https://www.researchsquare.com/article/rs-7203829/latest]
- 81. Development and validation of a headspace GC-MS method ... [https://aapsopen.springeropen.com/articles/10.1186/s41120-021-00049-8]