Smartphone-Based Microfluidic ELISA: A Revolutionary Tool for On-Site Pharmaceutical Detection in Water
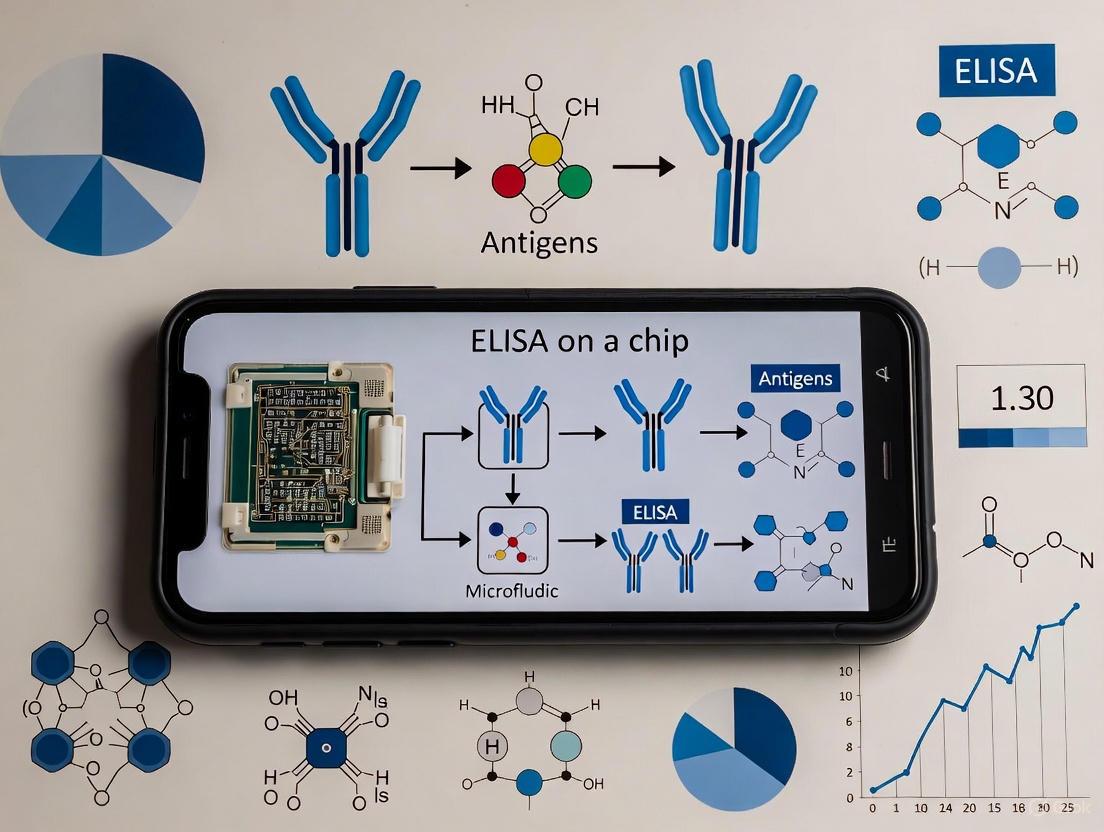
This article explores the development and application of smartphone-based microfluidic ELISA (Enzyme-Linked Immunosorbent Assay) platforms for the detection of pharmaceutical residues in water.
Smartphone-Based Microfluidic ELISA: A Revolutionary Tool for On-Site Pharmaceutical Detection in Water
Abstract
This article explores the development and application of smartphone-based microfluidic ELISA (Enzyme-Linked Immunosorbent Assay) platforms for the detection of pharmaceutical residues in water. Aimed at researchers, scientists, and drug development professionals, it provides a comprehensive analysis spanning from foundational principles and chip design to practical implementation, optimization strategies, and performance validation. We examine how the convergence of microfluidic precision, smartphone computational power, and immunoassay specificity creates portable, cost-effective, and rapid tools for environmental monitoring. The content addresses key challenges and future directions, highlighting the potential of this integrated technology to enable real-time, on-site water quality analysis and transform environmental surveillance capabilities.
The Convergence of Technologies: Understanding Smartphone ELISA and Water Contamination
The increasing detection of pharmaceutical residues in aquatic environments represents a significant environmental and public health challenge. These micropollutants, originating from domestic, agricultural, and industrial wastewater, are typically present at trace concentrations (ng/L to μg/L), making their monitoring technically demanding and costly with conventional methods [1].
This application note details a modernized analytical approach based on Enzyme-Linked Immunosorbent Assay (ELISA) principles, specifically adapted onto a smartphone-based microfluidic platform. This protocol is designed for researchers and environmental scientists requiring sensitive, cost-effective, and in-field detection of target pharmaceuticals in water samples, supporting broader environmental monitoring and risk assessment objectives [2] [3].
Traditional ELISA is a well-established plate-based technique for detecting and quantifying soluble substances such as peptides, proteins, antibodies, and hormones [4]. Our protocol transfers this robust assay chemistry to a miniaturized, portable format by integrating key technological advances:
- Microfluidic Chip: A 3D-printed chip replaces the traditional 96-well plate, incorporating a micropillar array to maximize the surface area for antibody immobilization and enhance assay sensitivity [2].
- Smartphone Detection: The smartphone's CMOS camera serves as a optical detector, enabling visual inspection and quantitative analysis of the colorimetric assay result through dedicated applications, eliminating the need for bulky laboratory spectrophotometers [3].
- Point-of-Care Testing (POCT): This integrated system allows for rapid in-field screening, which is crucial for timely environmental monitoring in resource-limited settings [2].
The core principle remains the specific binding between an antigen and an antibody. In the described sandwich ELISA format, the target pharmaceutical (antigen) is captured between two specific antibodies—a capture antibody immobilized on the chip and a detection antibody linked to an enzyme (e.g., Horseradish Peroxidase, HRP). Enzyme substrate addition produces a color change, the intensity of which is proportional to the target concentration [4].
Detailed Experimental Protocol
Reagent and Solution Preparation
- Coating Buffer (0.1 M Carbonate-Bicarbonate, pH 9.4): For immobilizing capture antibodies on the chip surface.
- Blocking Buffer (1% BSA in PBS): To saturate unsaturated binding sites on the chip and minimize non-specific background signal.
- Wash Buffer (PBST, 0.05% Tween 20 in PBS): For removing unbound reagents between steps.
- Detection Antibody: Target-specific antibody conjugated to HRP.
- Colorimetric Substrate (TMB): For HRP; yields a blue product that turns yellow upon stopping.
- Stop Solution (1 M H₂SO₄): Acidifies the solution to stop the enzymatic reaction and stabilize the final color.
Smartphone Microfluidic Platform Assembly
- Chip Fabrication: Fabricate the flower-shaped microfluidic chip using projection micro-stereolithography (PμSL) 3D printing as described in the literature [2]. The design should integrate a serpentine microchannel and a micropillar array within the detection zone.
- Imaging Accessory: Assemble a 3D-printed accessory that holds the smartphone in precise alignment over the chip's detection zone. The accessory should incorporate a uniform LED light source and, if necessary, a simple lens for optimal imaging [3].
Step-by-Step Assay Procedure
Diagram 1: Assay workflow for smartphone-based ELISA.
Chip Coating:
- Introduce the specific capture antibody (e.g., a novel nanobody [2]) diluted in coating buffer into the microfluidic chip.
- Incubate for 1 hour at 37°C or overnight at 4°C to allow passive adsorption to the chip surface.
- Wash the chip three times with Wash Buffer using the integrated capillary pump or a syringe [2] [4].
Blocking:
Sample Incubation:
- Load the prepared water sample (pre-concentrated if necessary) or standard onto the chip.
- Incubate for 1 hour to allow the target pharmaceutical antigen to bind to the immobilized capture antibody.
- Wash three times with Wash Buffer to remove unbound sample matrix [2].
Detection Antibody Incubation:
- Introduce the enzyme-conjugated detection antibody specific to a different epitope of the target pharmaceutical.
- Incubate for 1 hour to form the antibody-antigen-antibody "sandwich" complex.
- Wash three times thoroughly with Wash Buffer to remove any unbound detection antibody [4].
Substrate Addition and Signal Development:
- Introduce the colorimetric enzyme substrate (e.g., TMB for HRP) into the chip.
- Incubate in the dark for a precise, pre-optimized period (e.g., 10-20 minutes) for color development.
- Add Stop Solution to acidify the mixture, which changes the color from blue to yellow and halts the enzyme reaction [4].
Smartphone Detection and Data Acquisition:
- Place the chip into the 3D-printed imaging accessory attached to the smartphone.
- Capture an image of the detection zone under uniform illumination using the smartphone camera.
- Use a dedicated smartphone application to analyze the color intensity (e.g., in the RGB color space) of the solution [2] [3].
Data Analysis and Quantification
Standard Curve Generation:
Curve Fitting:
- Fit the standard curve data using a 4-parameter logistic (4PL) or 5-parameter logistic (5PL) model, which is most accurate for the sigmoidal response typical of immunoassays. The 4PL equation is: Y = D + (A - D) / (1 + (X / C)^B) where A is the minimum asymptote, D is the maximum asymptote, C is the inflection point (EC50), and B is the slope factor [6] [7].
Sample Concentration Interpolation:
- Calculate the mean absorbance/color value for each unknown sample.
- Interpolate the sample concentration from the standard curve using the fitting model.
- Multiply the interpolated value by any sample pre-concentration or dilution factor to obtain the original concentration in the water sample [6].
Quality Control:
Research Reagent Solutions and Essential Materials
Table 1: Key materials and reagents for smartphone-based ELISA on chip.
| Item | Function/Description | Example/Note |
|---|---|---|
| Capture Antibody | Immobilized on chip surface to specifically bind the target pharmaceutical. | High-affinity nanobodies offer excellent stability and specificity [2]. |
| Detection Antibody | Enzyme-linked antibody that binds the captured target, enabling detection. | Conjugated to Horseradish Peroxidase (HRP) [4]. |
| Microfluidic Chip | 3D-printed platform that miniaturizes and automates fluid handling and the assay. | Fabricated via PμSL; contains a micropillar array for increased surface area [2]. |
| Colorimetric Substrate | Chromogenic solution reacted with the detection enzyme to produce a measurable signal. | TMB (3,3',5,5'-Tetramethylbenzidine) for HRP [4]. |
| Smartphone & App | Acts as the detector (camera), data processor, and result interpreter. | Requires a stable imaging accessory and a dedicated analysis application [2] [3]. |
| Blocking Agent | Protein or polymer used to cover non-specific binding sites to reduce background noise. | 1% Bovine Serum Albumin (BSA) or non-fat dry milk in buffer [4] [5]. |
Performance Data and Validation
The smartphone-based ELISA platform has been rigorously validated for analytical performance.
Table 2: Representative performance metrics of a smartphone-based ELISA for virus detection, demonstrating platform capability [2].
| Parameter | Performance Metric | Notes / Implications |
|---|---|---|
| Limit of Detection (LOD) | 5.9 × 10³ EID₅₀/0.1 mL | Comparable to traditional ELISA, suitable for trace analysis. |
| Assay Time | Significantly reduced | Microfluidic flow accelerates binding kinetics versus static incubation. |
| Sample Volume | Low µL range | Miniaturization reduces reagent consumption and cost. |
| Reusability | Up to 9 cycles | Chip demonstrated consistent performance over multiple uses. |
| Specificity | High | Minimal cross-reactivity due to high-affinity nanobody pairs. |
Troubleshooting Guide
Table 3: Common issues, causes, and solutions in smartphone-based ELISA.
| Problem | Potential Cause | Suggested Solution |
|---|---|---|
| Low or No Signal | Degraded reagents (e.g., substrate, antibodies). | Use fresh aliquots of reagents; check expiration dates. |
| Incomplete reagent mixing or binding in chip. | Optimize flow rate and incubation times within the microchannel. | |
| Enzyme conjugate inactivity. | Check activity of enzyme conjugate with control test. | |
| High Background Signal | Inadequate washing. | Increase wash volume and frequency; ensure proper chip design for efficient washing [6]. |
| Non-specific binding. | Optimize blocking buffer composition and concentration; increase blocking time [6] [5]. | |
| Excessive detection antibody concentration. | Titrate the detection antibody to find the optimal dilution [6]. | |
| High Variation Between Replicates | Inconsistent sample loading or bubble formation. | Standardize loading technique; ensure chip primed with buffer. |
| Inconsistent imaging conditions. | Use a fixed-focus imaging accessory with uniform lighting [3]. | |
| Pipetting inaccuracy during sample prep. | Calibrate pipettes; use reverse pipetting for viscous solutions [7]. |
The Enzyme-Linked Immunosorbent Assay (ELISA) has stood as a cornerstone technique in diagnostic and research laboratories for decades, renowned for its high specificity and sensitivity. However, its dependence on laboratory infrastructure, lengthy protocol duration, and significant reagent consumption have limited its application in point-of-care and resource-limited settings. The paradigm is shifting with the advent of microfluidic technology, which miniaturizes and integrates complex laboratory procedures onto a single chip. This evolution is particularly impactful for environmental monitoring, such as the detection of pharmaceutical residues in water, where it enables the development of portable, smartphone-based analytical systems. This application note details the core principles of traditional ELISA, its transformation into microfluidic formats, and provides detailed protocols for their implementation in pharmaceutical detection.
Core Principles and Comparative Analysis
Fundamental Workflow of Traditional ELISA
The traditional ELISA is a heterogeneous assay typically performed in a 96-well microplate format. It relies on the specific binding of an antigen by an antibody, with an enzyme conjugate producing a measurable signal, most often a color change. The basic steps, whether for direct, indirect, or sandwich formats, involve multiple cycles of incubation and washing to separate bound from unbound reagents. These processes are labor-intensive and time-consuming, often requiring several hours to complete and relying on trained personnel and bulky plate readers for quantification [8].
The Microfluidic Evolution
Microfluidic ELISA, or lab-on-a-chip ELISA, translates the principles of the conventional assay onto a miniaturized platform. These devices feature networks of microchannels that manipulate small fluid volumes (typically microliters or less), offering significant advantages through enhanced fluid control and increased surface-area-to-volume ratios [9] [10].
Table 1: Quantitative Comparison of Traditional vs. Microfluidic ELISA
| Parameter | Traditional ELISA | Microfluidic ELISA | Key Improvements |
|---|---|---|---|
| Assay Time | Several hours (e.g., 4-6 hrs) | < 70 minutes; often 15-45 minutes [11] [9] [12] | >50% reduction [10] |
| Sample/Reagent Volume | 50-100 µL per well [10] | 1-30 µL; as low as 5 µL [11] [9] [12] | 5- to 20-fold reduction [10] |
| Limit of Detection (LOD) | Varies by analyte | Improved sensitivity; e.g., 8.4 pM for Rabbit IgG [13] | Up to 12.5-fold improvement reported [10] |
| Assay Steps | Multiple manual pipetting and washing steps | Semi- or fully automated sequential loading [14] [13] | Reduced user intervention and error |
| Detection Platform | Benchtop plate reader | Smartphone imaging with AI analysis [14] [2] [15] | Portability and in-field use |
The core improvements, as summarized in Table 1, stem from the physics of miniaturization. The dramatically reduced diffusion distances within microchannels accelerate binding kinetics, while the large surface-area-to-volume ratio increases the efficiency of solid-phase reactions [11]. This allows for faster assays with lower reagent consumption without sacrificing—and often enhancing—analytical sensitivity.
Experimental Protocols
Protocol: Microfluidic Paper-Based ELISA for Small Molecules
This protocol adapts the sandwich ELISA principle to a paper-based microfluidic device, ideal for developing smartphone-based detection of pharmaceutical contaminants in water samples [13].
Research Reagent Solutions & Essential Materials
| Item | Function |
|---|---|
| Nitroc cellulose Membrane | Serves as the solid support for immobilizing capture antibodies. |
| Conjugate Pad (Glass Fiber) | Contains dried detection antibodies conjugated to enzyme (e.g., HRP). |
| Absorbent Pad | Creates capillary flow by wicking fluid through the device. |
| Wash Buffer (PBS) | Removes unbound reagents to reduce background signal. |
| Chromogenic Substrate (TMB) | Enzyme substrate that produces a visible color change upon reaction. |
| Stop Solution (e.g., H₂SO₄) | Halts the enzyme-substrate reaction to stabilize the signal. |
| Smartphone with Custom App | For image capture and quantitative analysis of the colorimetric signal. |
Procedure:
- Chip Preparation: Fabricate the microfluidic paper-based analytical device (μPAD) using wax printing or laser cutting to define hydrophobic boundaries and microchannels on a nitrocellulose membrane [13].
- Antibody Immobilization: Dispense the capture antibody solution onto the designated detection zone of the nitrocellulose membrane and allow it to dry.
- Sample Application: Introduce 5-30 µL of the prepared water sample onto the conjugate pad. The sample rehydrates the detection antibodies and moves via capillary action toward the detection zone.
- Sandwich Complex Formation: As the sample flows through the detection zone, the target pharmaceutical analyte (if present) is captured, forming an antibody-analyte-antibody enzyme complex.
- Washing: Automatically or manually load a wash buffer (e.g., PBS) to remove any unbound reagents from the detection zone [13].
- Signal Development: Load the chromogenic substrate (e.g., TMB). In the presence of the enzyme, a colored precipitate forms at the detection zone.
- Reaction Termination: Add a stop solution to halt the reaction [13].
- Signal Detection & Quantification: Place the device in a dark box to eliminate ambient light. Capture an image of the detection zone using a smartphone camera. A dedicated application, often employing an adversarial neural network for robust image analysis, converts the color intensity into a quantitative concentration value [14] [15].
Protocol: Automated Active Microfluidic ELISA for Proteins
This protocol uses a chip with integrated pumps and valves for precise fluidic control, suitable for sensitive protein detection like cardiac biomarkers [9].
Procedure:
- Chip Priming: Load all reagents (wash buffer, sample, detection antibody, substrate) into their respective on-chip reservoirs.
- Surface Coating: The integrated micropump and valve system automatically draw the capture antibody solution into the reaction chamber, where it is immobilized.
- Sample Incubation: The system flushes the sample through the reaction chamber. The optimized chamber geometry and flow rate ensure efficient binding within 15 minutes [9].
- Detection Antibody Incubation: The enzyme-linked detection antibody is introduced to form the sandwich complex.
- Automated Washing: On-chip valves and pumps perform precise washing steps to minimize background noise.
- Chemiluminescent Detection: A chemifluorescent substrate is added. The resulting signal is measured using a miniaturized fluorescence detector or, in advanced systems, a smartphone-based optical module [11]. The entire process, from sample loading to result, is completed in under 15 minutes [9].
Integration with Smartphone-Based Detection for Water Analysis
The convergence of microfluidic ELISA with smartphone detection creates a powerful pocket laboratory. The smartphone serves a dual purpose: as an optical reader and a data analysis unit. Custom-developed mobile applications are crucial for consistent quantification. These apps can use AI algorithms to automatically interpret assay results from a smartphone image, correcting for variables like ambient lighting and camera model differences, which is vital for reliable field testing [14] [15].
This integrated approach is directly applicable to screening water samples for pharmaceutical contaminants. Research has demonstrated the feasibility of smartphone-based bioluminescence biosensors for water toxicity, achieving a limit of detection of 0.23 ppb for the cyanotoxin microcystin-LR, showcasing the sensitivity required for detecting trace-level pollutants [15].
Workflow and Technology Evolution Diagram
The following diagram illustrates the progression from traditional laboratory-bound methods to portable, intelligent detection systems.
The evolution of ELISA from a traditional microplate format to sophisticated microfluidic platforms represents a significant leap forward in analytical science. By drastically reducing assay times, reagent consumption, and the need for specialized equipment, microfluidic ELISA enables a new class of diagnostic tools. The integration of these chips with smartphone-based detection and AI-powered analysis creates a robust, portable, and highly accessible platform. This technological synergy is perfectly poised to address critical challenges in environmental monitoring, making sensitive, on-site detection of pharmaceutical contaminants in water a practical and scalable reality.
The convergence of smartphone technology and microfluidic systems is creating a paradigm shift in chemical and biological analysis, enabling the development of powerful, portable, and democratized diagnostic tools [16]. These smartphone-based lab-on-a-chip (LOC) devices are particularly transformative for applications requiring rapid, on-site analysis, such as the monitoring of pharmaceutical contaminants in water [17]. By leveraging the smartphone's integrated hardware—including high-resolution cameras, powerful application processors, and various sensors—as well as its software capabilities, researchers can engineer field-deployable systems that rival the performance of traditional benchtop instruments [16] [18]. This application note details how the core components of a smartphone make it an ideal platform for LOC devices, with a specific focus on implementing a smartphone-based microfluidic ELISA for detecting pharmaceuticals in water samples. The protocols and technical specifications provided herein are designed for researchers, scientists, and drug development professionals working in environmental monitoring.
The Smartphone Platform: Core Components for LOC Integration
A modern smartphone is an integrated package of sophisticated hardware and software, each component of which can be co-opted for analytical purposes. [16] summarizes the key features and their utility in chemical and biological analysis.
Table 1: Smartphone Features and Their Utility in LOC Systems
| Smartphone Component | Technical Specifications | Utility in LOC Devices |
|---|---|---|
| Camera | High-resolution sensors (e.g., 12-50 MP), large apertures (f/1.5-f/2.4), pixel sizes (~1.0-1.8 μm) [16] | Optical detection for colorimetric, fluorescent, and microscopic assays; quantitative RGB analysis. |
| Application Processor | Market shift towards chips with on-board AI accelerators; 10% YoY revenue growth in Q1 2025 driven by AI-enabled silicon [19] | On-device data processing, running machine learning models for classification, and controlling peripheral hardware. |
| Connectivity (USB, Bluetooth) | Standardized interfaces for power and data transfer. | Powering and controlling external microcontrollers, sensors, and microfluidic components (e.g., valves, pumps). |
| Software & Apps | Custom-developed applications (e.g., using MIT App Inventor, Android Studio) [20] | User interface for operating the device, initiating assays, processing data in real-time, and reporting results. |
The motivation for adopting smartphones is multifaceted: their global ubiquity (with smartphone ownership estimated at ~70% of the global population when including basic mobile phones), massive economy of scale, and pre-integrated suite of features make them a uniquely accessible and powerful platform for developing analytical devices that are both cost-effective and user-friendly [16].
Technical Specifications and Reagent Solutions
The development of a smartphone-interfaced LOC device requires specific materials and reagents. The following table outlines a core set of "Research Reagent Solutions" essential for constructing a microfluidic ELISA system for pharmaceutical detection.
Table 2: Essential Research Reagent Solutions for Smartphone-based Microfluidic ELISA
| Item | Function/Description | Application Example |
|---|---|---|
| PDMS (Polydimethylsiloxane) | An elastomeric polymer used to fabricate microfluidic channels via soft lithography; transparent, gas-permeable, and biocompatible. [17] [21] | Main material for the microfluidic chip that houses the ELISA reaction chambers and fluidic network. |
| Paper Substrate | Cellulose-based material patterned with hydrophobic barriers to create defined reaction zones; enables passive fluid transport via capillary action. [22] [20] [17] | Paper-based ELISA (p-ELISA) chip for antibody immobilization and low-cost, disposable assays. |
| Carbon Black Composite Electrodes | A low-cost, disposable conductive material integrated into microfluidic devices to act as an electrolytic pump via gas bubble generation. [21] | On-chip micropump for automated, precise fluid handling, powered directly by the smartphone. |
| Specific Antibodies (e.g., VHH Nanobodies) | Molecular recognition elements that provide high specificity and sensitivity for the target analyte. [21] | Immobilized capture antibodies for detecting specific pharmaceutical contaminants (e.g., BDE-47). |
| Enzyme-Labeled Detection Reagents | Conjugates (e.g., Horseradish Peroxidase - HRP) that generate a measurable colorimetric signal upon reacting with a substrate. [20] [21] | Key component of the ELISA for signal generation; catalyzes the conversion of a chromogenic substrate (e.g., TMB). |
| Chromogenic Substrate (e.g., TMB) | A colorless substrate that produces a colored, soluble product when catalyzed by the enzyme label (e.g., HRP). [20] | Provides the colorimetric signal for the smartphone camera to quantify. |
Experimental Protocol: Smartphone-Based Microfluidic ELISA for Pharmaceutical Detection
This protocol adapts established methods for microfluidic ELISA [20] [21] and smartphone-based colorimetric detection [22] for the specific application of pharmaceutical detection in water.
Fabrication of the Microfluidic Chip
Chip Design: Using design software (e.g., AutoCAD, SolidWorks), design a microfluidic chip layout containing:
- A sample inlet port.
- A series of microchannels (e.g., 200 μm deep, 250 μm wide) connecting the inlet to one or more reaction chambers.
- Reaction chambers (e.g., 2.0 × 4.0 × 0.5 mm) for antibody immobilization and the colorimetric reaction.
- Integrated chambers for electrolytic micropumps (e.g., 4.0 × 5.0 × 1.0 mm) with interdigitated electrode patterns.
- A waste chamber.
- Reference: [21]
Soft Lithography with PDMS: a. Mix PDMS base and curing agent at a 10:1 ratio and degas in a vacuum desiccator until all bubbles are removed. b. Pour the mixture over a master wafer (fabricated via photolithography or using a CO2 laser engraver) and cure at 65-100°C for 1 hour. c. Peel off the cured PDMS layer and punch inlets/outlets using a biopsy punch. d. Bond the PDMS layer to a glass slide or another PDMS layer using oxygen plasma treatment.
Integration of Electrolytic Pumps: a. Prepare a carbon black-PDMS (C-PDMS) composite by mixing carbon black nanoparticles (e.g., 15% by weight) with uncured PDMS. b. Fill the recessed electrode patterns in the PDMS chip with the C-PDMS composite and remove excess material with a squeegee. c. Cure the assembly at 100°C to form solid, conductive electrodes.
- Reference: [21]
Assay Workflow and Smartphone Integration
The following diagram illustrates the complete experimental workflow, from chip preparation to result analysis.
Diagram 1: Smartphone ELISA Workflow
Chip Preparation and Assay Execution: a. Antibody Immobilization: Covalently immobilize the specific capture antibodies (e.g., VHH nanobodies) onto the surface of the reaction chambers. This can be achieved by pre-treating the surface with APTES (3-aminopropyltriethoxysilane) to create amine-reactive groups. [20] [21] b. Blocking: Introduce a blocking solution (e.g., BSA) to cover any remaining non-specific binding sites on the chip surface to minimize background signal. c. Sample Introduction: Inject the prepared water sample into the chip's inlet. The smartphone-powered electrolytic pumps are activated (via a USB-connected microcontroller) to transport the sample through the microchannels to the reaction chamber. The target pharmaceutical analyte (if present) binds to the immobilized capture antibodies. [21] d. Washing: Automatically introduce washing buffers via the micropump system to remove unbound material. e. Detection Antibody Introduction: Transport the enzyme-labeled (e.g., HRP) detection antibody into the reaction chamber. It binds to the captured analyte, forming a "sandwich" complex. f. Signal Development: After a subsequent wash step, introduce the chromogenic substrate (TMB). The HRP enzyme catalyzes the reaction, producing a blue-colored product. The reaction can be stopped with an acid, turning the solution yellow. [20]
Smartphone-based Detection and Analysis: a. Imaging: Place the microfluidic chip in a simple, 3D-printed dark box to ensure consistent lighting. Use the smartphone camera to capture an image of the reaction chamber(s). [22] b. Color Analysis: A custom smartphone application (e.g., developed using MIT App Inventor) processes the image. The app performs RGB (Red, Green, Blue) analysis on a defined region of interest within the reaction chamber. [20] c. Quantification: The app correlates the intensity of the color (e.g., the Blue channel value for a yellow TMB product) with the analyte concentration using a pre-loaded calibration curve. Machine learning algorithms (e.g., Support Vector Machine) can be integrated to improve classification accuracy and even optimize the sensor array itself. [22] The result is displayed on-screen and can be saved or transmitted.
The integration of smartphones with microfluidic LOC devices represents a significant advancement in analytical technology, particularly for decentralized environmental monitoring. By harnessing the smartphone's camera for detection, its processing power for data analysis, and its connectivity for control and communication, researchers can build compact, automated, and highly sensitive systems. The detailed protocol for a smartphone-based microfluidic ELISA provided here demonstrates a viable path for detecting trace levels of pharmaceuticals in water, offering a powerful tool for environmental scientists and public health professionals. As smartphone technology continues to evolve, particularly with the integration of dedicated AI hardware, the capabilities of these portable diagnostic platforms will only expand, further democratizing access to sophisticated chemical and biological analysis. [16] [19] [18]
This application note details the implementation of a smartphone-based microfluidic ELISA platform, specifically designed for the detection of pharmaceutical contaminants in water samples. The system synergistically combines the portability and processing power of a smartphone with the precision of lab-on-a-chip technology, offering a powerful tool for on-site, real-time environmental monitoring. The core advantages of this integrated approach are summarized below.
Table 1: Core Advantages of Smartphone-Based Microfluidic ELISA
| Advantage | Description | Impact on Pharmaceutical-in-Water Detection |
|---|---|---|
| Portability & Field-Deployment | The entire analytical system is miniaturized into a compact, lightweight platform powered and controlled by a smartphone [21] [17]. | Enables testing at water sources (rivers, treatment plants, outlets), eliminating the need for sample transport and preserving analyte integrity. |
| Cost-Effectiveness | Utilizes low-cost materials (e.g., PDMS, PVC films) and fabrication methods (e.g., xurography, 3D printing) [23] [24]. The smartphone serves as a pre-owned multi-purpose instrument, replacing expensive spectrophotometers [16]. | Drastic reduction in per-test cost, making widespread monitoring of water supplies financially viable for municipalities and researchers. |
| Real-Time Analysis | Integrated biosensors and smartphone data logging enable continuous or rapid on-site measurement, providing results in minutes rather than days [25] [26]. | Allows for immediate response to contamination events and dynamic monitoring of pharmaceutical levels over time. |
The detection of trace levels of pharmaceuticals in water sources is a critical challenge in environmental science. Traditional laboratory methods, such as standard ELISA and chromatography, are ill-suited for rapid, widespread field testing due to their cost, time requirements, and lack of portability. The integration of microfluidic Elisa with smartphones directly addresses these limitations by creating a unified, "lab-in-a-phone" system [16].
The operational logic of this integrated system can be broken down into a streamlined workflow, from sample introduction to result delivery.
Detailed Experimental Protocols
Protocol 1: Fabrication of a Low-Cost Microfluidic Chip via Xurography
This protocol describes a rapid, inexpensive method for creating microfluidic chips, ideal for prototyping and resource-limited settings [23].
- Objective: To fabricate a multi-layer microfluidic chip with integrated microwells for ELISA reactions using a cutting plotter.
- Materials:
- Baseplate: Glass microscope slides (75 mm × 25 mm × 1 mm).
- Adhesive Films: Polyvinyl chloride (PVC) sheets in white, black, and transparent.
- Equipment: Cutting plotter (e.g., Roland or Graphtec models).
- Software: Coral Draw or similar vector graphics software.
- Procedure:
- Design: Create the microfluidic channel and well layout using the design software. The design should include an injection port, a main channel, and an array of microwells for the ELISA reaction.
- Cut Base Layer: Cut a white PVC film to the exact dimensions of the glass slide. Adhere this to the slide to create a uniform, high-contrast background for imaging.
- Cut Channel Layer: Load black PVC film into the plotter. Precisely cut the inner contours of the microfluidic channels and microwells. Remove the excess material from the cut areas to create the open channels.
- Assemble: Align and adhere the patterned black PVC layer onto the white base layer. A transparent PVC top layer with pre-cut inlet/outlet holes can be added to seal the device.
- Bonding: Apply gentle, even pressure across the entire chip to ensure all adhesive layers are fully bonded, creating water-tight seals.
- Technical Notes: This method avoids the need for expensive cleanroom facilities and toxic chemicals associated with traditional lithography [23]. The white background is critical for accurate colorimetric analysis by the smartphone camera.
Protocol 2: On-Chip Competitive ELISA for BDE-47 Detection
This protocol is adapted from a system that successfully detected an environmental contaminant, demonstrating high sensitivity suitable for pharmaceutical analysis [21].
- Objective: To perform a competitive ELISA on a microfluidic chip to detect and quantify a target pharmaceutical analyte.
- Materials:
- Chip: PDMS-based microfluidic chip with integrated carbon-black electrode micropumps [21].
- Reagents:
- Capture reagent: BSA-conjugated hapten (or pharmaceutical analog) immobilized in the detection chamber.
- Detection reagent: Horseradish peroxidase (HRP)-labeled variable domain of heavy chain antibodies (VHH).
- Sample: Water sample spiked with the target pharmaceutical.
- Substrate: TMB (3,3',5,5'-Tetramethylbenzidine) or other colorimetric HRP substrate.
- System: Smartphone connected to an Arduino microcontroller for pump actuation.
- Procedure:
- Chip Priming: Load the sample and all reagents (VHH-HRP, wash buffer, substrate) into their respective reservoirs on the chip.
- Assay Automation: Execute a pre-programmed script on the smartphone/Arduino unit. The script sequentially applies voltage to the electrolytic carbon-black electrodes, generating gas bubbles that act as micropumps to move reagents [21].
- Incubation & Reaction:
- The sample and VHH-HRP conjugate are mixed and transported to the detection chamber, where they compete for binding to the immobilized antigen.
- Unbound material is washed away.
- The enzyme substrate is pumped in, producing a color change inversely proportional to the analyte concentration.
- Detection: The smartphone camera captures an image or video of the detection chamber in real-time.
- Technical Notes: The carbon-black electrodes are low-cost, disposable, and less susceptible to electrochemical degradation than metal electrodes [21]. The competitive format is ideal for detecting small molecules like most pharmaceuticals.
Protocol 3: Smartphone-Based Colorimetric Detection with Machine Learning
This protocol leverages advanced data analysis to overcome challenges like lighting variations, ensuring laboratory-grade accuracy from a smartphone image [23].
- Objective: To accurately quantify the colorimetric signal from the ELISA reaction using a smartphone camera and a pre-trained convolutional neural network (CNN).
- Materials:
- Smartphone with a custom application for image capture.
- Fabricated microfluidic chip after ELISA completion.
- Computer or cloud service for model training (can be done once, then deployed on the app).
- Procedure:
- Image Capture: Place the chip on the uniform white background. Under consistent lighting, use the smartphone app to capture an image of the entire chip, ensuring all reaction wells are in frame.
- Pre-processing: The app automatically identifies and crops each reaction well within the image. Pixel values (e.g., in RGB or HSV color space) are extracted.
- Analysis with CNN: The cropped image is fed into a pre-trained CNN model. The model, having been trained on thousands of images with known concentrations and varying light conditions, directly predicts the analyte concentration.
- Output: The concentration result is displayed on the smartphone screen and can be saved or transmitted.
- Technical Notes: Traditional methods analyze color intensity against a calibration curve, which is sensitive to ambient light and camera optics. The CNN approach is more robust, with one study achieving 97% overall accuracy in classifying glucose concentrations [23]. This method requires an initial investment in creating a diverse training dataset.
The Scientist's Toolkit: Key Research Reagent Solutions
Table 2: Essential Materials and Reagents for Smartphone-Based Microfluidic ELISA
| Item | Function/Description | Key Characteristics & References |
|---|---|---|
| Polydimethylsiloxane (PDMS) | Elastomeric polymer for chip fabrication; optically transparent, gas-permeable, and biocompatible. | Enables soft lithography; susceptible to small molecule absorption [21] [17]. |
| Carbon Black-PDMS Electrodes | Integrated micropumps; generate fluid flow via gas bubble expansion from electrolysis. | Low-cost, low-power, disposable alternative to metal electrodes [21]. |
| Variable Domain of Heavy Chain Antibodies (VHH) | Miniature antibodies used for detection; bind to specific pharmaceutical targets. | Small size, high stability, and excellent specificity for sensitive assays [21]. |
| Immunomagnetic Beads (IMB) | Solid-phase carrier for ELISA; used to separate and purify targets from complex samples. | Enhances optical signals (light scattering) and reduces background noise [27]. |
| Convolutional Neural Network (CNN) | Machine learning algorithm for image analysis; classifies colorimetric results from chip images. | Compensates for smartphone camera variability; enables high analytical accuracy (~97%) [23]. |
Performance Data & Analysis
The quantitative performance of smartphone-integrated systems is competitive with traditional benchtop methods, as the data below demonstrates.
Table 3: Quantitative Performance of Smartphone-Based Detection Systems
| Analytical Method / Target | Linear Range | Detection Limit | Key Advantage Demonstrated | Source |
|---|---|---|---|---|
| Microfluidic ELISA (BDE-47) | 10⁻³ – 10⁴ μg/L | Comparable to standard ELISA | High sensitivity for a broad contaminant range [21]. | [21] |
| Microfluidic Fluorometric System (Fluorescein) | 0.001 - 0.01 μg/mL (R² = 0.9995) | 1 × 10⁻⁴ μg/mL | High sensitivity and throughput (>200 samples/hour) [26]. | [26] |
| Colorimetric Glucose CNN Classifier | N/A (Classification) | N/A | 97% overall accuracy, demonstrating reliability of smartphone analysis [23]. | [23] |
| Portable Microfluidic Photometry (IL-6) | Good linear correlation with concentration (R > 0.95) | Meets detection requirements | Solved smartphone camera accuracy issues via scatter enhancement [27]. | [27] |
Current Market and Research Landscape for Next-Generation Diagnostic Platforms
The diagnostic testing market is undergoing a significant transformation, propelled by technological advancements that emphasize portability, automation, and intelligence. The global market, valued at US $209.48 billion in 2025, is projected to reach US $274.53 billion by 2034, growing at a CAGR of 3.04% [28]. This growth is largely driven by the rising prevalence of chronic diseases, the demand for early and accurate diagnosis, and innovations in molecular diagnostics and point-of-care (POC) testing [29] [28]. A key trend within this landscape is the convergence of microfluidic lab-on-a-chip (LOC) systems with the global ubiquity and processing power of smartphones, creating powerful, portable diagnostic platforms [16]. These systems are poised to democratize access to sophisticated assays, such as the enzyme-linked immunosorbent assay (ELISA), moving them from centralized laboratories to the field for applications like pharmaceutical detection in water. This article details the market context and provides application notes and protocols for implementing smartphone-based, microfluidic ELISA, with a specific focus on detecting pharmaceutical residues in environmental water samples.
The diagnostic market is expanding due to several synergistic factors. The increasing burden of chronic diseases such as cancer, diabetes, and cardiovascular conditions creates a persistent demand for diagnostic testing for early detection and monitoring [29]. Concurrently, technological advancements in automation, artificial intelligence (AI), and molecular diagnostics are enhancing the precision, efficiency, and accessibility of these services [29].
Table 1: Global Diagnostic Testing Market Snapshot (2025-2034)
| Metric | Value / Forecast |
|---|---|
| Market Size in 2025 | USD 209.48 Billion [28] |
| Projected Market Size in 2034 | USD 274.53 Billion [28] |
| CAGR (2025-2034) | 3.04% [28] |
| Dominant Region (2024) | North America (≈40% share) [28] |
| Fastest Growing Region | Asia-Pacific (≈24% share) [28] |
Segmental analysis reveals key growth vectors. In test type, molecular diagnostics is the fastest-growing segment, driven by its ability to detect diseases at a genetic level and its critical role in oncology and infectious disease testing [28]. From a technology perspective, while laboratory-based testing currently dominates, point-of-care testing is anticipated to be the fastest-growing segment, fueled by demand for rapid, on-site results [28]. The oncology segment is also expanding rapidly due to rising cancer prevalence and advances in liquid biopsies and genetic profiling [30].
The next-generation cancer diagnostics market, a critical subset, is expected to grow from USD 19.16 billion in 2025 to USD 38.36 billion by 2034, at a robust CAGR of 8.02% [30]. This underscores the market's shift towards more precise, less invasive diagnostic technologies.
Technological Convergence: Smartphones and Microfluidic ELISA
The integration of smartphones with microfluidic LOC devices represents a paradigm shift for diagnostic testing. Smartphones offer a globally ubiquitous, integrated technological package with powerful cameras, sensors, and processors, making them an ideal platform for portable chemical and biological analysis [16]. Their global penetration and economy of scale allow for the development of diagnostic tools that are far more cost-effective than bespoke laboratory instruments [16].
Microfluidic ELISA-on-a-chip technologies have evolved to automate the multiple steps of traditional ELISA—such as sample incubation, washing, and reagent addition—without the need for bulky peripherals. Recent innovations include:
- Capillaric Circuits (CCs) and Microfluidic Chain Reactions (MCRs): These systems use capillary phenomena to pre-program fluidic operations structurally, automating multi-step assays without active components [31].
- 3D-Printed Aliquoting Chips: Devices that autonomously aliquot sample and reagents with high volumetric accuracy (>93%), simplifying user loading and enabling high-sensitivity detection of targets like the SARS-CoV-2 nucleocapsid protein [31].
- Electrolytic Micropumps: Systems using smartphone-powered electrolytic bubble pumps to transport reagents through a microfluidic chip for competitive ELISA, demonstrating performance comparable to laboratory methods [21].
The convergence of these technologies creates a powerful, field-deployable tool that retains the performance of laboratory ELISA while offering the convenience and form factor of rapid tests [31].
Diagram 1: Technology convergence creating a new diagnostic paradigm.
Application Note: Smartphone-Interfaced ELISA-on-Chip for Pharmaceutical Detection
Principle
This application note describes a protocol for detecting trace levels of pharmaceutical contaminants in water samples using a competitive ELISA format on a capillaric microfluidic chip, with a smartphone camera serving as the optical detector. The assay is based on the competition between the target pharmaceutical in the sample and a fixed concentration of an enzyme-labeled pharmaceutical analog (conjugate) for a limited number of antibody binding sites immobilized on a nitrocellulose membrane. The smartphone captures the colorimetric signal generated by the enzymatic conversion of a substrate, and the intensity is inversely proportional to the analyte concentration [7] [21].
Experimental Workflow
The entire process, from chip preparation to data analysis, is outlined in the workflow below.
Diagram 2: Smartphone-based ELISA-on-chip workflow.
Detailed Protocols
Protocol 1: Fabrication of a 3D-Printed Capillaric ELISA Chip
This protocol is adapted from Parandakh et al. (2023) [31].
- Design: Create a digital 3D model of the capillaric chip using computer-aided design (CAD) software. The design should include:
- A sample inlet and separate inlets for detection antibody, enzyme conjugate, and substrate.
- Volumetric measuring reservoirs for each solution (e.g., 70 µL for detection antibody, 210 µL for sample).
- A capillaric aliquoting circuit (CAC) with capillary pumps and drain channels to remove excess liquid.
- A separate assay module featuring a nitrocellulose membrane strip.
- Printing: Fabricate the chip using a high-resolution desktop 3D printer with biocompatible resin.
- Post-processing: Clean the printed chip according to the resin manufacturer's instructions (e.g., rinsing in isopropanol) and post-cure under UV light.
- Assay Module Preparation: Spot the capture antibody (specific to the pharmaceutical target or its antibody complex) onto the nitrocellulose membrane in a defined line. Allow it to dry, then block the membrane with a protein-based blocking buffer (e.g., 1% BSA) to prevent non-specific binding.
- Assembly: Click-connect the assay module containing the prepared nitrocellulose membrane to the main 3D-printed fluidic chip. Ensure a secure, leak-proof connection.
Protocol 2: Smartphone-Based Competitive ELISA for Pharmaceutical Detection
This protocol integrates elements from multiple sources [31] [7] [21].
Pre-Analytic Phase: Chip Loading
- Sample Preparation: Filter water samples to remove particulate matter. For quantitative analysis, prepare a standard curve using known concentrations of the target pharmaceutical diluted in a matrix similar to the sample (e.g., clean water).
- Chip Loading: Using a disposable pipette, load the following solutions into their respective inlets on the chip:
- Sample (or standard)
- Biotinylated detection antibody
- Streptavidin-poly-HRP enzyme conjugate
- Colorimetric substrate (e.g., TMB)
- Washing buffer
- Autonomous Aliquoting: Upon loading, capillary flow will draw each solution into its designated measuring reservoir. The integrated CAC will automatically drain excess liquid, creating precise aliquots of all solutions without user intervention.
Analytic Phase: Assay Execution
- Assay Initiation: Ensure the assay module is connected. The capillaric circuit, governed by the MCR, will autonomously initiate the flow of solutions in the pre-programmed sequence.
- Incubation and Washing: The chip will sequentially deliver the sample, detection antibody, and enzyme conjugate to the nitrocellulose membrane, with intermediate washing steps in between to remove unbound material. Each incubation step is timed by the fluidic resistance of the capillaric channels.
- Signal Development: The substrate is finally delivered to the membrane. The immobilized HRP enzyme catalyzes the conversion of the substrate to a colored precipitate on the test line.
Post-Analytic Phase: Data Acquisition and Analysis
- Image Capture: After the assay is complete (typically within 1.5 hours), use a smartphone to capture an image of the nitrocellulose membrane. For consistency, place the chip in a simple, 3D-printed dark box to minimize ambient light interference.
- Colorimetric Analysis: Use a dedicated app or image processing software (e.g., ImageJ) to convert the image to a grayscale or analyze the RGB color channels. Measure the pixel intensity of the test line.
- Quantification:
- Plot the mean absorbance (pixel intensity) of the standard concentrations against their known concentrations to generate a standard curve.
- Fit the data using a 4- or 5-parameter logistic (4PL or 5PL) model, which is well-suited for immunoassay data [7].
- Interpolate the absorbance values of the unknown samples from the standard curve to determine their concentration. Remember to multiply by the dilution factor if the sample was diluted.
Table 2: Troubleshooting Common Issues in Smartphone-Based ELISA
| Problem | Potential Cause | Solution |
|---|---|---|
| High background signal | Insufficient washing; non-specific binding | Optimize blocking buffer; increase number or volume of wash steps [7]. |
| Weak or no signal | Low analyte concentration; degraded reagents | Check reagent integrity; ensure sample is not beyond the assay's linear range [7]. |
| Inconsistent aliquoting | Chip fabrication defects; surfactant concentration | Verify printer resolution; reduce concentration of Tween-20 in buffers if possible [31]. |
| Poor image quality | Uneven lighting; glare | Use a fixed dark box for image capture; ensure camera focus is on the test line [16]. |
The Scientist's Toolkit: Research Reagent Solutions
Table 3: Essential Materials and Reagents for Smartphone-Based Pharmaceutical ELISA
| Item | Function | Application Note |
|---|---|---|
| Capture Antibody | Binds the target pharmaceutical or an immuno-complex specifically and immobilizes it on the nitrocellulose membrane. | Critical for assay specificity. Must be validated for cross-reactivity with common water contaminants [32]. |
| Biotinylated Detection Antibody | Binds to a different epitope of the pharmaceutical or the capture antibody complex; provides a binding site for the enzyme conjugate via biotin-streptavidin interaction. | The biotin-streptavidin system enables significant signal amplification [32]. |
| Streptavidin-poly-HRP | Enzyme conjugate that binds to the biotinylated detection antibody. Catalyzes the colorimetric reaction. | Poly-HRP, with multiple enzyme molecules per streptavidin, offers enhanced sensitivity over traditional streptavidin-HRP [31]. |
| Colorimetric Substrate (e.g., TMB) | Chromogenic compound that is converted by HRP into a colored, insoluble precipitate. | The precipitate forms a visible line on the membrane, which can be quantified by the smartphone camera [31] [21]. |
| Blocking Buffer (e.g., BSA) | Prevents non-specific binding of proteins to the nitrocellulose membrane and microfluidic channel surfaces, reducing background noise. | Essential for achieving a high signal-to-noise ratio. A concentration of 1% BSA is commonly used [32]. |
| Wash Buffer (PBS with Tween-20) | Removes unbound reagents and sample components during the washing steps, minimizing cross-contamination between assay steps. | Tween-20 is a surfactant that helps reduce non-specific binding. A concentration of 0.05% is typical, but higher levels may interfere with some capillaric circuits [31] [32]. |
| Nitrocellulose Membrane | Porous solid support for the immobilization of the capture antibody in a line format. | The capillary flow properties of nitrocellulose are ideal for lateral flow and capillaric assay formats [31]. |
Performance Characterization and Data Analysis
A well-executed smartphone-based ELISA should be quantitatively characterized. Data analysis should always involve running samples and standards in duplicate or triplicate, with duplicates ideally within 20% of the mean [7].
Standard Curve and Quantification: The concentration of the target pharmaceutical is determined by interpolating the sample's absorbance from a standard curve. For competitive ELISA, the standard curve is inverted, with the highest concentration corresponding to the lowest signal [7]. The coefficient of variation (CV) should be calculated (CV = standard deviation / mean) to assess the precision and reproducibility of the assay. A high CV can indicate issues with pipetting, contamination, or inconsistent flow conditions [7].
Assay Validation: To ensure accuracy in complex sample matrices like water, perform a spike recovery experiment. A known concentration of the pharmaceutical is spiked into a real water sample and a clean buffer. The recovery is calculated by comparing the measured concentration to the expected concentration. If recovery is poor, it indicates matrix interference, and the standard curve may need to be prepared in the sample matrix itself [7].
The integration of smartphone technology with advanced microfluidic designs is ushering in a new era for diagnostic and environmental testing. The protocols and application notes detailed herein demonstrate that it is feasible to perform sophisticated, laboratory-grade quantitative assays like ELISA in a portable, automated, and cost-effective format. For researchers focused on pharmaceutical detection in water, these next-generation platforms offer a powerful tool for widespread environmental monitoring, enabling rapid screening and data collection directly in the field. As these technologies continue to mature, supported by robust quality management systems and AI-powered data analysis, their impact on ensuring water safety and public health is poised to be substantial.
Building the System: Chip Design, Assay Development, and Protocol Execution
The development of smartphone-based ELISA (Enzyme-Linked Immunosorbent Assay) on-chip for detecting pharmaceuticals in water represents a paradigm shift in environmental monitoring. This technology convergence enables rapid, portable, and quantitative analysis at the point-of-need, moving beyond traditional laboratory confines. The core of this approach lies in the microfluidic chip, which miniaturizes and integrates the entire analytical process. The selection of appropriate chip materials—polymers, paper, and glass—is paramount, as their intrinsic properties directly dictate device functionality, fabrication complexity, assay performance, and ultimately, the success of the field-deployable platform [33] [3]. This application note provides a detailed comparison of these materials and standardized protocols for their use in smartphone-based pharmaceutical detection.
Material Properties and Comparison
The choice of material influences optical clarity, fabrication ease, cost, biocompatibility, and chemical resistance, all critical for automating multi-step ELISA on a miniature scale and ensuring compatibility with smartphone detection.
Table 1: Comparative Analysis of Microfluidic Chip Materials for Smartphone-Based ELISA
| Property | Polydimethylsiloxane (PDMS) | Polymethyl Methacrylate (PMMA) | Paper | Glass |
|---|---|---|---|---|
| Optical Transparency | High (down to ~280 nm) [33] | High [34] | Opaque | Very High & Low Background Fluorescence [33] |
| Biocompatibility | Excellent [33] [35] | Good | Good | Excellent, Biologically Inert [33] [35] |
| Fabrication Complexity | Moderate (Soft Lithography) [33] [34] | Low (CNC Milling) to Moderate (Injection Molding) [34] | Very Low (Wax Printing, Cutting) [33] [34] | High (Photolithography, Etching) [35] [34] |
| Cost | Low for Prototyping | Low to Moderate [34] | Very Low [33] [35] | High [35] [34] |
| Gas Permeability | High (Beneficial for cell culture) [33] | Low | N/A (Porous) | Non-Permeable |
| Chemical Resistance | Low (Swelling with organic solvents) [33] | Moderate | Low | High [33] [34] |
| Key Advantage | Rapid prototyping, gas permeability | Optical clarity, mechanical stability | Capillary flow, no external pumps [33] [3] | Chemical resistance, excellent optical properties [33] |
| Primary Disadvantage | Hydrophobicity, absorbs small hydrophobic molecules [33] | Susceptible to some organic solvents | Limited to simpler assays, low fabrication precision [34] | High cost, complex and slow fabrication [35] [34] |
Table 2: Dominant Material Selection by Application Focus
| Research and Development Goal | Recommended Material | Rationale |
|---|---|---|
| High-Throughput Drug Screening | PDMS [36] | Biocompatibility, permeability, and ease of rapid prototyping for complex designs like organ-on-a-chip. |
| Point-of-Care Diagnostic Chips | Paper or PMMA [9] [3] | Paper for ultra-low-cost, passive flow devices. PMMA for more durable, integrated devices with optical detection. |
| Integrated, Disposable ELISA Chips | PMMA [9] [34] | Good optical clarity for detection, mechanical stability for integration, and cost-effectiveness for mass production. |
| Applications Involving Harsh Solvents | Glass [33] [34] | Superior chemical resistance and stability under demanding conditions. |
Figure 1: A decision workflow for selecting a microfluidic chip material for smartphone-based ELISA, prioritizing PMMA and Paper for the final application, with PDMS and Glass for specific use cases.
Experimental Protocols
Protocol: Fabrication of a PMMA Microfluidic Chip for ELISA
This protocol details the creation of a durable, optically clear PMMA chip suitable for quantitative smartphone detection [9] [34].
Research Reagent Solutions & Essential Materials
| Item | Function/Description |
|---|---|
| PMMA Sheets (3 mm & 1 mm thick) | Substrate for the microfluidic chip and cover layer. |
| Computer Numerical Control (CNC) Mill | For precision milling of microchannels into the 3 mm PMMA sheet. |
| Ethanol (≥99%) | Solvent for chemical-assisted thermal bonding; also used for cleaning. |
| Temperature-Controlled Pneumatic Press | To apply uniform heat and pressure for bonding. |
| O-Rings & Microfluidic Connectors | For creating sealed fluidic ports for sample and reagent introduction. |
| Plasma Cleaner (O₂) | Optional. For surface activation to enhance bonding. |
Procedure:
- Design and File Preparation: Design the chip layout (e.g., containing a reaction chamber, inlet/outlet ports, and connecting microchannels) using CAD software. Convert the design into a format compatible with the CNC machine (e.g., a STEP file) [34].
- CNC Milling: Secure a 3 mm thick PMMA sheet to the CNC bed. Mill the microchannels and reaction chambers according to the design file. The nominal volume of a reaction chamber can be designed to be as low as 6 µL to conserve reagents [9] [34].
- Cleaning and Preparation: Thoroughly clean the milled PMMA chip and a separate 1 mm thick PMMA cover sheet with ethanol to remove debris and dust.
- Chemical-Assisted Thermal Bonding: a. Immerse both the milled chip and the cover in ethanol for a brief period (seconds) [34]. b. Assemble the wetted pieces and place them in a temperature-controlled pneumatic press. c. Bond at a low temperature (≈55°C) and applied pressure for approximately 3 minutes. This method creates a strong seal without causing channel deformation [34].
- Post-processing: Install O-rings and connectors at the inlet and outlet ports to facilitate fluidic interfacing.
Protocol: On-Chip Smartphone-Based ELISA for Pharmaceutical Detection
This protocol adapts a conventional sandwich ELISA to the fabricated PMMA microfluidic chip, integrated with a smartphone for detection [9] [3].
Research Reagent Solutions & Essential Materials
| Item | Function/Description |
|---|---|
| Capture Antibody (Specific to target pharmaceutical) | Immobilized on the chip's reaction chamber surface to capture the analyte. |
| Sample (Environmental water) | The test matrix, potentially containing the target pharmaceutical analyte. |
| Detection Antibody (HRP-conjugated, specific to the analyte) | Binds to the captured analyte to form the "sandwich". |
| Wash Buffer (e.g., PBS with Tween) | Removes unbound reagents to minimize background signal. |
| Chromogenic Substrate (e.g., TMB) | Enzyme substrate that produces a color change catalyzed by HRP. |
| Smartphone with CMOS Camera | The core detection module for capturing colorimetric signals. |
| 3D-Printed Cradle | Holds the chip and ensures consistent alignment and distance from the camera. |
| Controlled LED Light Source | Provides uniform, consistent illumination for reproducible imaging. |
Procedure:
- Surface Functionalization: Pre-coat the reaction chamber of the PMMA chip with the capture antibody. Incubate, then wash with buffer to remove excess antibody.
- Sample Introduction and Incubation: Introduce a small volume of the prepared water sample (e.g., 30 µL) into the chip. Allow the target pharmaceutical analyte to bind to the capture antibody during a short incubation period (minutes).
- Washing: Flush the chip with wash buffer to remove unbound molecules from the sample matrix.
- Detection Antibody Incubation: Introduce the enzyme-linked (e.g., Horseradish Peroxidase, HRP) detection antibody. After incubation, perform another wash step to remove any unbound detection antibody.
- Signal Development: Add the chromogenic substrate (e.g., TMB). The enzymatic reaction will produce a blue color, the intensity of which is proportional to the amount of captured analyte.
- Smartphone Detection and Analysis: a. Place the chip into a custom 3D-printed cradle that positions it under the smartphone camera with a uniform LED light source [3]. b. Capture an image of the reaction chamber. c. Use a dedicated image-processing application on the smartphone to select a region of interest (ROI) over the reaction zone and a reference zone. The app calculates the relative grayscale value (GSV) by subtracting the average GSV of the reaction zone from the reference GSVs [9]. A higher color intensity yields a lower GSV. d. Quantify the analyte concentration by comparing the relative GSV against a pre-established calibration curve.
Figure 2: The step-by-step workflow for performing a sandwich ELISA for pharmaceutical detection within a microfluidic chip, culminating in smartphone-based quantitative analysis.
The successful implementation of a smartphone-based ELISA platform for monitoring pharmaceuticals in water hinges on a strategic selection of microfluidic chip materials. PDMS is ideal for initial prototyping and fundamental R&D due to its versatility. For field-deployable, cost-effective devices, PMMA offers an excellent balance of optical performance and manufacturability, while paper is unmatched for ultra-low-cost, disposable tests. Glass remains the material of choice for applications involving aggressive solvents. By leveraging the protocols and comparisons outlined in this document, researchers can effectively engineer robust, sensitive, and portable diagnostic systems that meet the demanding requirements of environmental water analysis.
This application note details the design, fabrication, and operational protocols for 3D-printed microfluidic chips tailored for smartphone-based Enzyme-Linked Immunosorbent Assays (ELISA). The focus is on detecting pharmaceutical contaminants in water samples. The integration of 3D printing allows for the rapid prototyping of complex channel architectures that enable precise fluid control, which is critical for the automation and accuracy of in-field ELISA. These designs are intended for use by researchers and engineers developing point-of-care testing (PoCT) systems for environmental monitoring. [2] [3]
3D Printing Technologies for Microfluidic Fabrication
Selecting an appropriate 3D printing technology is fundamental to achieving the desired feature resolution, biocompatibility, and optical properties for smartphone-based colorimetric detection. The following table compares the primary 3D printing techniques used in microfluidic device fabrication.
Table 1: Comparison of 3D Printing Technologies for Microfluidic Chip Fabrication
| Technology | Principle | Suitable Materials | Typical Resolution | Key Advantages | Key Limitations |
|---|---|---|---|---|---|
| Vat Photopolymerization (SLA/DLP) [37] [38] | UV light selectively cures a liquid photopolymer resin layer-by-layer. | Photopolymer resins (e.g., clear resin) | ~25 - 100 μm | High resolution, smooth surface finish, ability to create complex internal channels. | Material may require biocompatibility validation; post-processing (washing, curing) is needed. |
| Material Extrusion (FDM) [39] [37] | Thermoplastic filament is heated and extruded through a nozzle, building layers. | PLA, ABS | ~50 - 200 μm | Low cost, wide material selection, easily accessible. | Lower resolution, visible layer lines; achieving water-tight seals can be challenging. |
| Powder Bed Fusion (e.g., SLS) [37] | A laser sinters polymer powder particles together. | Nylon (PA) | ~80 - 150 μm | High strength, no need for support structures. | Porous surfaces often require infiltration to make them water-tight; rougher surface finish. |
Recommendation: For high-performance chips requiring fine details and optical clarity for smartphone imaging, DLP-based printing is preferred. Its high resolution is suitable for creating intricate channel architectures and functional components like micropillar arrays and micromixers. [2] [38]
Channel Architecture for Fluid Control
Channel design directly impacts fluid flow, mixing efficiency, reagent incubation, and ultimately, assay sensitivity. The architecture must be optimized for the specific requirements of an ELISA protocol.
Design Considerations for Smartphone ELISA
- Surface Area Enhancement: Increasing the surface area within the chip allows for greater immobilization of capture antibodies (Ab1), enhancing the assay's signal. Integrating micropillar arrays within the chip's reaction chamber is an effective strategy to achieve this. [2]
- Mixing Efficiency: Efficient mixing of reagents with the sample is crucial for uniform reactions. Passive micromixers, which rely on channel geometry to induce chaotic advection, are ideal as they require no external moving parts. [40]
- Flow Control: Precise control of fluid flow is necessary for consistent incubation and washing steps. This can be achieved through automated pumping systems or by designing channels that leverage capillary forces. [3] [40]
Common Channel Architectures
Table 2: Microfluidic Channel Architectures for Fluid Control
| Architecture Type | Description | Function in Assay | Key Performance Data |
|---|---|---|---|
| Straight Channel | Simple, linear path. [41] | Basic transport of fluids; limited mixing. | N/A |
| Flower-Shaped Chamber with Micropillar Array | A central chamber with radiating channels and an integrated micropillar array. [2] | Increases surface area for antibody immobilization; enhances capture efficiency. | Device LOD for H7N9: 5.9 × 10³ EID₅₀/0.1 mL. Chip reusability: up to 9 cycles. [2] |
| Passive Micromixer (Serpentine/Grooved) | A channel with a serpentine path or embedded grooves/obstacles. [40] | Enhances mixing of samples and reagents without external energy input. | Simulation-predicted mixing efficiency >90% for optimized designs. [40] |
| Vertical Flow Assay (VFA) | A porous membrane with separated spots for assays; sample flows vertically. [3] | Allows for multiplexed detection; results readable by smartphone. | High sensitivity (97.8%) and specificity (100%) demonstrated for HIV tests. [3] |
Detailed Experimental Protocol
Fabrication of a 3D-Printed Microfluidic Chip with Integrated Micromixer
This protocol outlines the steps for creating a PDMS microfluidic chip using a 3D-printed mold, based on a validated methodology. [40]
Materials:
- Software: COMSOL Multiphysics (or similar CFD software), CAD software (e.g., SolidWorks).
- 3D Printer: DLP/SLA printer (e.g., Formlabs Form2).
- Printing Material: High-resolution resin.
- PDMS Kit: Sylgard 184 (base and curing agent).
- Lab Equipment: Plasma cleaner, oven, vacuum desiccator.
Procedure:
- Channel Design and Simulation:
- Design a passive micromixer (e.g., serpentine with obstacles) in CAD software.
- Export the design and use CFD software (e.g., COMSOL) to simulate fluid flow and mixing efficiency. Optimize the geometry to achieve >90% mixing efficiency. [40]
- 3D Printing the Master Mold:
- Convert the finalized design into an inverse mold.
- Print the mold using a DLP printer with clear resin. Ensure printing orientation minimizes stair-stepping artifacts in critical channel features.
- Post-process the mold according to the resin manufacturer's instructions: wash in isopropanol and post-cure with UV light.
- PDMS Replica Molding:
- Mix the PDMS base and curing agent at a 10:1 ratio. Degas the mixture in a vacuum desiccator until all bubbles are removed.
- Pour the PDMS over the 3D-printed master mold and cure in an oven at 65°C for at least 4 hours.
- Chip Bonding:
- Carefully peel the cured PDMS from the mold.
- Treat the PDMS slab and a glass slide (or another PDMS slab) with oxygen plasma for 45-60 seconds.
- Immediately bring the activated surfaces into contact to form an irreversible seal.
Protocol for Smartphone-Based ELISA for Pharmaceutical Detection
This protocol adapts the "ELISA in a tip" concept for a microfluidic chip format, targeting a model pharmaceutical analyte. [42]
Materials:
- The Scientist's Toolkit: Key Research Reagent Solutions:
- Capture Antibody (Ab1): Specific to the target pharmaceutical.
- Detection Antibody (Ab2): Conjugated to Horseradish Peroxidase (HRP).
- Blocking Buffer: 1% Bovine Serum Albumin (BSA) in PBS.
- Washing Buffer: PBS with 0.05% Tween 20 (PBST).
- Colorimetric Substrate: Tetramethylbenzidine (TMB).
- Stop Solution: 1M Sulfuric Acid (H₂SO₄).
- Chip Functionalization Reagents: Chitosan hydrogel, Glutaraldehyde.
Procedure:
- Chip Functionalization:
- Introduce a chitosan solution into the chip's reaction chamber and incubate to form an adhesive layer.
- Flush with glutaraldehyde to activate the chitosan.
- Immobilize the Capture Antibody (Ab1) by introducing its solution into the chip and incubating. [42]
- Blocking:
- Introduce Blocking Buffer (1% BSA) to cover any remaining reactive sites. Incubate for 1 hour at room temperature.
- Wash with Washing Buffer (PBST).
- Assay Execution:
- Sample Incubation: Introduce the water sample (potentially spiked with the target pharmaceutical). Incubate for 20-30 minutes to allow antigen binding. Wash.
- Detection Antibody Incubation: Introduce the HRP-conjugated Detection Antibody (Ab2). Incubate for 20 minutes. Wash thoroughly.
- Signal Development: Introduce the TMB substrate. Allow the colorimetric reaction to proceed for 10 minutes.
- Reaction Stop: Introduce the Stop Solution (H₂SO₄), which turns the color from blue to yellow.
- Smartphone Detection & Analysis:
- Place the chip on a standardized background with a controlled LED light source to minimize ambient light variation.
- Capture an image of the reaction chamber using a smartphone camera.
- Use a color analysis application (e.g., Color Grab) or custom software to quantify the color intensity, which is proportional to the analyte concentration. [2] [42]
Workflow and Signaling Pathway Visualization
ELISA-on-Chip Workflow
Sandwich ELISA Signaling
Successful drug discovery and environmental monitoring begin with robust target selection and validation. Improving target validation can reduce attrition rates in phase II clinical trials by approximately 24%, ultimately lowering the cost of developing new therapeutics by about 30% [43]. In the context of pharmaceutical detection in water, this process involves identifying specific biomarkers, proteins, or enzymes associated with pharmaceutical contaminants and confirming their suitability as detection targets. Antibodies serve as essential and versatile tools in this process, enabling the characterization of target distribution, cellular localization, function, and roles in environmental contamination [43]. The emergence of smartphone-based ELISA on chip technology represents a significant advancement for field-deployable, sensitive detection of pharmaceutical residues in water sources, particularly in low-resource settings where conventional laboratory equipment is unavailable [21] [9].
Effective target identification and validation require careful evaluation across multiple factors, including linkage to disease pathology for environmental health applications, target-related safety, availability of specific tool reagents such as antibodies, strategic considerations regarding environmental impact, and analytical feasibility [43]. This application note provides comprehensive guidance on selecting appropriate antibodies and developing optimized protocols specifically configured for smartphone-based ELISA on chip platforms targeting pharmaceutical contaminants in water.
Antibody Selection for Pharmaceutical Targets
Types of Antibodies and Their Applications
Antibodies function as critical reagents in immunoassays, with selection depending on the specific assay format, required specificity, and intended application. For pharmaceutical detection in water, several antibody formats offer distinct advantages:
Monoclonal antibodies provide high specificity by recognizing a single epitope on the target pharmaceutical compound, offering consistent batch-to-batch reproducibility and reduced cross-reactivity with similar compounds [44]. These characteristics make them ideal for quantitative detection of specific pharmaceutical contaminants where precise measurement is critical.
Polyclonal antibodies, derived from multiple immune cell clones, recognize multiple epitopes on the target analyte. This multi-epitope recognition can enhance assay sensitivity through signal amplification and improve the likelihood of detecting structurally diverse pharmaceutical compounds [43]. However, they may exhibit greater batch-to-batch variability compared to monoclonal antibodies.
Single-domain antibodies (Nanobodies) and other recombinant fragments offer advantages for microfluidic applications due to their small size, stability, and suitability for engineering [21]. These properties facilitate their integration into miniaturized detection systems and make them particularly valuable for smartphone-based ELISA platforms.
Antibody-matched pairs are essential for sandwich ELISA formats, consisting of capture and detection antibodies that bind to non-overlapping epitopes on the target pharmaceutical compound [45]. These pairs must be carefully selected for mutual compatibility to ensure optimal assay performance.
Key Selection Criteria
When selecting antibodies for pharmaceutical detection in water samples, several critical factors must be considered:
Specificity and Cross-Reactivity: Antibodies must demonstrate minimal cross-reactivity with structurally similar compounds that may be present in water samples. For example, in detecting BDE-47 (2,2′,4,4′-tetrabromodiphenyl ether), antibodies showed less than 1% cross-reactivity with human IL-10 analogues and against rat and murine interleukins IL-4 and IL-10 [32]. This high specificity is crucial for accurate environmental monitoring.
Affinity and Avidity: High-affinity antibodies with low dissociation constants (K_D) are essential for detecting low concentrations of pharmaceutical contaminants in water, which may be present at parts-per-billion or parts-per-trillion levels. The association strength directly impacts the assay's limit of detection [45].
Stability and Storage Requirements: Antibodies must maintain activity under various environmental conditions, particularly for field-deployable water testing applications. Considerations include thermal stability, resistance to proteolysis, and compatibility with preservation methods suitable for resource-limited settings [21].
Manufacturer Validation: Antibodies should be supplied with comprehensive validation data specific to environmental sample matrices, including information on cross-reactivity profiles, demonstrated performance in similar assay formats, and lot-to-lot consistency [45].
Table 1: Recommended Antibody Types for Pharmaceutical Detection Applications
| Antibody Type | Key Characteristics | Advantages | Limitations | Ideal Applications |
|---|---|---|---|---|
| Monoclonal | Single epitope specificity | High reproducibility; Low cross-reactivity | Limited epitope coverage | Quantitative detection of specific pharmaceutical compounds |
| Polyclonal | Multiple epitope recognition | High sensitivity; Signal amplification | Batch-to-batch variability | Screening for pharmaceutical classes with structural diversity |
| Single-domain (Nanobodies) | Small size (12-15 kDa); Stable structure | Engineering flexibility; Microfluidic compatibility | Limited commercial availability | Smartphone-based LOC devices; Field-deployable sensors |
| Recombinant Fragments | Engineered specificity; Consistent production | Reproducible production; Tailorable characteristics | Requires specialized production | Custom assay development; Multiplex detection platforms |
Assay Configuration and Development
ELISA Formats for Pharmaceutical Detection
Selecting the appropriate ELISA format is crucial for successful pharmaceutical detection in water samples. The primary formats include:
Sandwich ELISA is considered the most robust format for complex matrices like water samples, as it involves capturing the target pharmaceutical between two specific antibodies [45]. This format offers high specificity and sensitivity, making it ideal for detecting low molecular weight pharmaceutical compounds that may be present in trace amounts in environmental samples. The assay requires carefully selected antibody-matched pairs that bind to non-overlapping epitopes on the target pharmaceutical.
Competitive ELISA is particularly suitable for detecting small molecule pharmaceuticals, which may not have multiple epitopes for sandwich assay configuration [21]. In this format, the target pharmaceutical in the water sample competes with a labeled reference compound for binding sites on a limited amount of antibody. The signal generated is inversely proportional to the amount of target present in the sample. This approach has been successfully implemented in smartphone-interfaced devices for detecting BDE-47, an environmental contaminant found in food supplies with adverse health impacts [21].
Direct and Indirect ELISA formats, while simpler in design, generally offer lower specificity compared to sandwich and competitive formats [45]. These may be suitable for preliminary screening applications but are less ideal for definitive quantification of specific pharmaceutical contaminants in complex water matrices.
Smartphone-Based ELISA on Chip Configuration
The translation of conventional ELISA to microfluidic lab-on-a-chip (LOC) platforms enables rapid, sensitive detection of pharmaceuticals in water samples with smartphone readout [9]. Key configuration elements include:
Microfluidic Device Design: Effective devices incorporate high-surface-area bead beds or reaction chambers to enhance capture efficiency [32]. These designs significantly improve the dynamic range of the assay compared to standard plate-based ELISA. The miniaturization of reaction chambers reduces sample and reagent consumption while decreasing assay time, crucial for conventional ELISA using 96-well microplates [9].
Fluid Handling Systems: Advanced LOC devices implement integrated pumping mechanisms for precise fluid control. These include electrolytic bubble pumps that convert electric current to fluid movement via gas expansion [21] and PDMS-based pneumatic pumps and valves that regulate reaction time and reagent volume [9]. These systems enable complete automation of complex assay protocols in a field-deployable format.
Detection and Signal Readout: Smartphone-based detection utilizes built-in cameras and processing capabilities for colorimetric, fluorescent, or chemiluminescent detection [21]. For colorimetric detection, dedicated image-processing applications can analyze post-ELISA images as relative gray scale values (GSV), calculating the difference between reaction zones and reference zones to quantify the target pharmaceutical [9].
Experimental Workflow for Smartphone-Based ELISA
The following diagram illustrates the complete experimental workflow for smartphone-based ELISA detection of pharmaceuticals in water samples:
Protocol Implementation and Optimization
Step-by-Step Protocol for Smartphone-Based ELISA
Step 1: Surface Functionalization
- Prepare capture antibody solution at 1-12 µg/mL in coating buffer for affinity-purified monoclonal antibodies [45].
- Immobilize the capture antibody on the functionalized surface of the microfluidic chip or beads.
- Incubate for 2 hours at room temperature or overnight at 4°C.
- Block non-specific binding sites with 1% BSA in PBS or commercial blocking buffer for 2 hours [32].
Step 2: Sample Preparation and Introduction
- Pre-concentrate water samples if necessary, depending on the expected pharmaceutical concentration.
- Load 30-1000 µL of prepared sample into the device reservoir [32] [9].
- For microfluidic devices, introduce sample onto the capture surface using integrated pumping mechanisms.
- Incubate for 30 minutes to allow target capture, with precise timing controlled by automated fluid handling [32].
Step 3: Detection Antibody Incubation
- Prepare biotinylated detection antibody at 0.5-5 µg/mL for affinity-purified monoclonal antibodies in blocking buffer [45].
- Introduce detection antibody into the microfluidic system.
- Incubate for 20 minutes to form the antibody-pharmaceutical complex [32].
Step 4: Enzyme-Conjugate Binding
- Prepare streptavidin-HRP conjugate at 10-100 ng/mL for chemiluminescent systems or 20-200 ng/mL for colorimetric systems [45].
- Incubate for 90 seconds in the microfluidic device [32].
Step 5: Signal Development and Detection
- Introduce appropriate enzyme substrate (e.g., TMB for colorimetric detection).
- Incubate for 30 seconds to 5 minutes, depending on the required sensitivity [32].
- Capture the colorimetric signal using smartphone camera under controlled lighting conditions.
- Process images using dedicated applications to calculate relative grayscale values [9].
Optimization Strategies
Successful implementation of smartphone-based ELISA requires systematic optimization of key parameters:
Checkerboard Titration: Simultaneously optimize concentrations of capture and detection antibodies by testing different combinations in a grid pattern [45]. This approach efficiently identifies the optimal antibody concentrations that provide strong signal with low background.
Incubation Time Optimization: Test various incubation times for each assay step to balance assay speed with sufficient signal development. Microfluidic systems can significantly reduce incubation times compared to conventional ELISA—from 120 minutes to 30 minutes for sample incubation and from 120 minutes to 20 minutes for detection antibody incubation [32].
Sample Volume and Matrix Optimization: Adjust sample volume based on the expected pharmaceutical concentration and microfluidic device capacity. For water samples, match the standard diluent as closely as possible to the sample matrix to ensure accurate quantification [45]. Perform spike-and-recovery experiments to validate assay performance in specific water matrices.
Table 2: Performance Comparison of Conventional vs. Microfluidic ELISA Systems
| Parameter | Conventional ELISA | Bead-Based Microfluidic ELISA [32] | Integrated Microfluidic Device [9] |
|---|---|---|---|
| Total Assay Time | 5 hours | 75 minutes | 15 minutes per ELISA step |
| Sample Volume | 100 µL | 0.01-1 mL | 30 µL |
| Limit of Detection | Varies by target | Comparable or improved sensitivity | 4.88 pg/mL (for cTnI) |
| Sensitivity | Standard | Greater than conventional ELISA | Significantly improved |
| Automation Level | Manual steps | Fully automated on-chip | Fully integrated pump and valve control |
| Detection Method | Plate reader | On-board fluorescence | Smartphone colorimetric detection |
Research Reagent Solutions
The successful implementation of smartphone-based ELISA for pharmaceutical detection in water requires specific research reagents and materials:
Table 3: Essential Research Reagents for Smartphone-Based Pharmaceutical Detection
| Reagent/Material | Function | Specifications/Recommendations |
|---|---|---|
| Capture Antibodies | Binds target pharmaceutical | Affinity-purified monoclonal; 1-12 µg/mL coating concentration [45] |
| Detection Antibodies | Recognizes captured pharmaceutical | Biotinylated for signal amplification; 0.5-5 µg/mL working concentration [45] |
| Enzyme Conjugates | Signal generation | Streptavidin-HRP at 10-200 ng/mL depending on detection system [45] |
| Microfluidic Chips | Reaction platform | PDMS-based with integrated pumps/valves; PMMA thermoplastic chips [9] |
| Signal Substrates | Colorimetric development | TMB for HRP systems; QuantaRed for fluorescence [32] |
| Blocking Buffers | Reduce non-specific binding | 1% BSA in PBS; commercial blocking buffers [32] |
| Wash Buffers | Remove unbound reagents | 0.05% Tween-20 in PBS [32] |
| Smartphone Interface | Signal detection & processing | USB-powered; image analysis apps for grayscale quantification [21] [9] |
System Architecture and Detection Principles
The following diagram illustrates the architecture of a smartphone-interfaced lab-on-a-chip system and the biochemical detection principle:
The configuration of robust antibody-based assays for pharmaceutical detection in water requires careful consideration of target properties, antibody characteristics, and assay format compatibility with smartphone-based detection platforms. The integration of microfluidic technologies with smartphone detection creates powerful field-deployable systems that offer significant advantages over conventional ELISA, including reduced assay time (from 5 hours to 75 minutes or less), minimal reagent consumption (as low as 30 µL sample volume), and comparable or improved sensitivity [32] [9]. These systems are particularly valuable for environmental monitoring in resource-limited settings, enabling rapid detection of pharmaceutical contaminants with laboratory-quality results. As these technologies continue to evolve, further improvements in multiplexing capability, detection limits, and user-friendliness will enhance their application in comprehensive water quality assessment and pharmaceutical contamination studies.
The integration of smartphone-based imaging with Enzyme-Linked Immunosorbent Assay (ELISA) on microfluidic chips presents a transformative approach for monitoring pharmaceutical contaminants in water. This paradigm shift towards point-of-care testing (POCT) replaces bulky, expensive laboratory equipment with compact, field-deployable systems [46] [21]. A critical component of this technology is the standardized smartphone interface, which encompasses the hardware attachments that align the optical components and the software algorithms that ensure reproducible image acquisition and colorimetric analysis. This document provides detailed application notes and protocols for establishing a robust smartphone interface for quantitative microfluidic ELISA, specifically contextualized for detecting pharmaceuticals in water samples.
Hardware Attachments & Optical Configurations
The primary function of the hardware attachment is to standardize the imaging conditions between the microfluidic chip and the smartphone camera, minimizing ambient light variability and enabling precise colorimetric measurement. Configurations range from simple accessory-free setups to sophisticated spectrometers.
Table 1: Smartphone Imaging Configurations for Microfluidic ELISA.
| Configuration Type | Key Components | Resolution/Sensitivity | Best Use-Case |
|---|---|---|---|
| Accessory-Free Imaging [46] | Smartphone camera only; uses internal plate controls (PC/NC) for calibration. | 99.7% agreement with reader (chronic disease); 95.4% (congenital disease). | Field use with commercial ELISA plates; rapid screening. |
| Integrated Spectrometer [47] | Cradle, diffraction grating (1200 grooves/mm), collimating lens, broadband halogen light source, optical fiber, cuvette. | Spectral resolution: 0.334 nm/pixel; Range: ~400-700 nm. | Laboratory-grade analysis; research and validation. |
| USB-Interfaced Mobile Platform [21] | Smartphone, Arduino microcontroller, PCB with electrode pairs, C-PDMS electrolytic micropump. | Sensitive for BDE-47 range of 10⁻³–10⁴ μg/L. | Automated, pump-driven microfluidic ELISA. |
The accessory-free method is the most portable, leveraging the phone's native camera and using the positive and negative controls within the ELISA plate as internal references to create a self-calibration curve for each image, accounting for variable ambient light, capture distance, and angle [46]. In contrast, the integrated spectrometer provides laboratory-grade data by dispersing light through a diffraction grating, allowing the smartphone camera to function as a high-resolution spectrometer for generating full absorption spectra, which is crucial for discerning subtle colorimetric changes in complex samples [47]. For fully automated fluid handling, a USB-interfaced platform can be employed, where the smartphone powers an Arduino microcontroller that drives electrolytic micropumps within the microfluidic chip, automating reagent delivery for the ELISA sequence [21].
Image Acquisition & Standardization Protocol
Scope
This protocol standardizes the process of acquiring and processing images of microfluidic ELISA chips using a smartphone to ensure consistent, quantitative, and reproducible results for pharmaceutical detection in water.
Materials and Equipment
- Smartphone with a minimum 12 MP camera (e.g., iPhone 4 or equivalent Android).
- Microfluidic ELISA chip or commercial 96-well plate.
- Custom optical attachment (if using spectrometer configuration) [47].
- Miniaturized, Bluetooth-controlled heating device for incubation (~±1 °C uniformity) [46].
Procedure
Step 1: Pre-imaging Setup and Calibration
- Stabilize Assay Temperature: Place the microfluidic chip or ELISA plate on the heating device and allow it to reach and stabilize at the required incubation temperature (e.g., 37°C) [46].
- Positioning: For accessory-free imaging, position the smartphone camera directly above the chip/plate, ensuring the entire reaction chamber or well array is in frame. Maintain a consistent distance (e.g., 30 cm) for all measurements [46].
- Camera Settings: Lock the focus and exposure of the smartphone camera. This is typically achieved by tapping and holding on the screen in the camera app. For consistency, focus on a point at infinity in a dimly lit environment before final alignment [47].
Step 2: Image Capture
- Capture Images: Using the native camera application or a custom app, capture multiple images (recommended: 5 consecutive images).
- Include References: Ensure that each image frame contains all relevant sample wells/chambers alongside the positive control (PC) and negative control (NC) [46].
- Data Transfer: Images can be processed on the device or wirelessly transferred to a computing server for post-processing [21].
Step 3: Image Processing and Data Analysis
- Color Space Conversion: Convert the captured RGB image to a suitable color space (e.g., HSV) for more robust color analysis.
- Region of Interest (ROI) Selection: Manually or automatically define ROIs for each sample and control well.
- Intensity Extraction: For accessory-free methods, calculate the mean pixel intensity within each ROI for the green and/or blue channels, which are most sensitive to common ELISA substrates like TMB [46] [47].
- Normalization and Calibration:
- Use the positive and negative controls to generate a normalization or calibration curve for each individual image. This corrects for spatial light non-uniformity and other variability sources [46].
- The normalized signal can be calculated as:
Normalized Signal = (Sample Intensity - NC Intensity) / (PC Intensity - NC Intensity).
- Concentration Interpolation: For quantitative analysis, interpolate the sample concentration from a standard curve prepared with known concentrations of the target pharmaceutical.
The Scientist's Toolkit: Research Reagent Solutions
Table 2: Essential Materials for Smartphone-based Microfluidic ELISA.
| Item | Function/Description | Example/Specification |
|---|---|---|
| Variable Domain Heavy Chain Antibodies (VHH) [21] | High-affinity capture/detection agents for pharmaceuticals (e.g., BDE-47). | Isolated from alpaca; directly labeled with HRP. |
| Horseradish Peroxidase (HRP) [21] | Enzyme conjugated to detection antibody; catalyzes color change. | Used with TMB substrate; EZ-Link Plus Activated Peroxidase. |
| Carbon-PDMS (C-PDMS) Composite [21] | Material for on-chip electrolytic micropumps. Low-cost, disposable. | 5-25% carbon black by weight; forms interdigitated electrodes. |
| Polydimethylsiloxane (PDMS) [21] | Elastomer for fabricating microfluidic chips. Biocompatible, gas-permeable. | Sylgard 184, 10:1 base to curing agent ratio. |
| Phosphate Buffered Saline (PBS) [21] | Standard buffer for washing steps and reagent dilution. | Maintains physiological pH and osmolarity. |
| 3,3',5,5'-Tetramethylbenzidine (TMB) [47] | Chromogenic substrate for HRP. Turns blue upon oxidation, measurable at ~450 nm. | Provides colorimetric readout for smartphone detection. |
Data Analysis & Validation Workflow
The transformation of a raw smartphone image into a validated, quantitative result requires a multi-step workflow that ensures data reliability.
Key Steps in the Workflow:
- Image Pre-processing: This involves cropping the image to the relevant area (e.g., the microfluidic chip or plate), selecting the Regions of Interest (ROI) for each sample and control, and converting the color space from RGB to one that separates color from intensity (like HSV) for more robust analysis [46].
- Control-based Normalization: The positive control (PC) and negative control (NC) intensities from the same image are used to generate a normalization factor. This critical step creates a self-calibrating system that accounts for variable ambient light, camera sensor differences, and minor positioning changes, significantly improving reproducibility [46].
- Quantitative Model: The normalized sample signals are fitted to a calibration curve obtained from standards of known concentration. A four-parameter logistic (4PL) regression model is often used for ELISA data due to its sigmoidal shape, providing accurate interpolation of unknown sample concentrations [47].
- Result Validation: The final step involves validating the smartphone-derived results against a gold standard.
- Bland-Altman Analysis: A statistical method used to assess the agreement between two different measurement techniques (e.g., smartphone vs. commercial plate reader) [46].
- Integrative Spectral Analysis: When using a spectrometer attachment, calculating the integrative absorption over a specific wavelength range (e.g., 410-500 nm for TMB) can improve sensitivity and provide a more robust data set than a single-wavelength measurement [47].
The convergence of smartphone technology, microfluidic engineering, and artificial intelligence has created a powerful paradigm for portable, quantitative biochemical analysis. Within the specific context of pharmaceutical detection in water, on-device data processing is the critical link that transforms a raw image of an assay into a reliable, quantitative result. This application note details the methodologies and protocols for implementing such a system, focusing on the marriage of smartphone-based ELISA (Enzyme-Linked Immunosorbent Assay) on microfluidic chips with robust computational analysis for determining pharmaceutical concentrations in environmental water samples.
The core advantage of this platform lies in its integration. Smartphones provide a compact package containing a high-resolution camera for optical detection, a powerful processor for on-device computation, and connectivity for data transmission [16] [3]. When paired with a disposable microfluidic chip that miniaturizes and automates the complex steps of an ELISA, the platform becomes a true point-of-need device, capable of performing sophisticated analyses outside traditional laboratory settings [21] [3]. This is particularly valuable for monitoring pharmaceutical contaminants in water sources, where widespread, frequent testing is essential for environmental and public health.
Platform Architecture & Workflow
A complete mobile health (mHealth) platform for pharmaceutical detection consists of three synergistic components: the microfluidic chip for sample handling and assay execution, the smartphone with its hardware accessories for image acquisition, and the software intelligence for data processing and quantification [3]. The seamless operation of these elements enables the transition from a raw image to a quantitative result.
System Components and Workflow Logic
The following diagram illustrates the integrated workflow and logical relationships between the hardware and software components of the platform, from sample introduction to final quantitative result.
The Scientist's Toolkit: Essential Research Reagent Solutions
The successful implementation of a smartphone-based microfluidic ELISA requires a carefully selected set of reagents and materials. The following table details the key components and their functions within the assay.
Table 1: Essential Research Reagents and Materials for Smartphone-Based Microfluidic ELISA
| Item | Function | Key Considerations |
|---|---|---|
| Capture Antibody | Immobilized on the microfluidic channel to specifically bind the target pharmaceutical [4]. | High specificity and affinity are critical for assay sensitivity. |
| Detection Antibody | Binds to the captured pharmaceutical; conjugated to a reporter enzyme (e.g., HRP) [4]. | Must recognize a different epitope than the capture antibody for sandwich ELISA. |
| Enzyme Substrate (e.g., TMB) | Converted by HRP into a colored, precipitable product for colorimetric detection [4] [48]. | Signal generation must be stable and compatible with smartphone camera detection. |
| Microfluidic Chip (PDMS) | Houses the immunoassay, providing a substrate for antibody coating and microchannels for fluid control [21]. | Design must enable passive pumping (e.g., capillary action) and minimize reagent use [3]. |
| Variable Domain Heavy Chain (VHH) Antibodies | Single-domain antibodies used as recognition elements for small molecule pharmaceuticals [21]. | Offer superior stability and are well-suited for detecting small molecule contaminants like BDE-47 [21]. |
| Carbon Black-PDMS Electrodes | Integrated electrodes for on-chip electrolytic pumping via gas bubble generation [21]. | Enable low-cost, disposable, and power-efficient fluid control actuated by the smartphone. |
Data Processing Methodology
The transformation of an assay image into a pharmaceutical concentration involves a multi-stage data processing pipeline. This pipeline can be executed directly on the smartphone or via a connected cloud service, balancing speed and computational demand.
Image Pre-processing and Feature Extraction
Raw images captured by the smartphone camera require pre-processing to enhance signal quality and standardize the data before analysis. The primary goals are to correct for variations in ambient lighting and to isolate the region of interest (ROI) – typically the detection chamber where the colorimetric reaction occurs [49] [3].
Key Pre-processing Steps:
- Denoising: Application of digital filters (e.g., in the spatial or frequency domain) or advanced deep learning methods like convolutional neural networks (CNNs) to reduce image noise [49].
- Color Space Conversion: Transformation of the image from the standard RGB (Red, Green, Blue) color space to more perceptually uniform spaces like HSV (Hue, Saturation, Value) or CIELAB. This makes the analysis less sensitive to fluctuations in illumination intensity.
- ROI Identification and Intensity Extraction: Using edge-detection algorithms or pre-defined masks to locate the detection chamber. The average pixel intensity within this ROI is then calculated, often by converting the image to grayscale or analyzing the intensity in a specific color channel (e.g., blue channel for a yellow TMB product) [3].
Quantitative Analysis and Curve Fitting
The core of quantification involves relating the measured optical signal to the concentration of the target analyte. This is achieved by constructing a standard curve with known concentrations.
Protocol: Standard Curve Generation and Data Fitting
- Prepare Standard Solutions: Create a dilution series of the target pharmaceutical standard across the expected dynamic range (e.g., 6-8 concentrations). Include a blank (zero concentration) standard [48].
- Run Assay and Acquire Images: Process each standard through the identical microfluidic ELISA protocol on the smartphone platform. Capture images of the detection chambers under consistent lighting conditions.
- Extract Optical Density (OD) Values: After pre-processing, obtain the mean pixel intensity (I) for each standard well. Calculate the adjusted OD as:
- Adjusted OD = -log₁₀(I / I₀) where I₀ is the mean intensity of the blank well [48].
- Select and Apply a Curve-Fitting Model: Plot the adjusted OD values against the known standard concentrations and fit with an appropriate model. The 4-Parameter Logistic (4PL) model is the gold standard for immunoassays due to its ability to fit the characteristic sigmoidal response curve [48].
- 4PL Equation:
Y = D + (A - D) / (1 + (X / C)^B)Y: OD valueX: Analyte concentrationA: Minimum asymptote (background signal)D: Maximum asymptote (saturation signal)C: Inflection point (EC₅₀ value)B: Hill slope (steepness of the curve)
- 4PL Equation:
- Interpolate Unknown Samples: Use the fitted 4PL model to interpolate the concentrations of unknown water samples from their measured OD values. Multiply the result by any sample-specific dilution factor to report the final concentration [48].
Software Tools for Analysis:
- On-Device/Web-Based: Boster Bio Online ELISA Data Calculator, MyAssays.com [48].
- Desktop Software: GraphPad Prism, Microsoft Excel, CurveExpert [48].
Experimental Protocol: Smartphone mHealth ELISA for Pharmaceuticals in Water
This section provides a detailed, step-by-step protocol for detecting a model pharmaceutical contaminant, BDE-47, in a water sample, based on a validated research study [21].
Materials and Device Setup
- Smartphone Platform: Android or iOS smartphone with a custom 3D-printed adapter holding optical lenses for magnification and uniform LED illumination [3].
- Control Hardware: Arduino microcontroller powered by the smartphone's USB port to operate on-chip electrolytic pumps [21].
- Microfluidic Chip: Disposable PDMS chip featuring:
Step-by-Step Procedure
Chip Priming and Blocking:
- Inject a blocking buffer (e.g., 1% BSA in PBS) into the sample inlet to block non-specific binding sites on the PDMS surface.
- Incubate for 15 minutes at room temperature, then flush the channels with wash buffer.
Sample and Reagent Introduction:
- Mix the water sample with a known concentration of HRP-labeled VHH antibody (detection reagent) [21].
- Load the sample-antibody mixture into the chip's sample chamber.
On-Chip Competitive ELISA Execution:
- Activate the first electrolytic pump via the smartphone-controlled Arduino. This pump transports the sample mixture to the detection chamber, where the target pharmaceutical (if present) and the immobilized hapten compete for binding to the limited number of HRP-labeled VHH antibodies.
- Incubate for 20 minutes to allow the competitive binding reaction to reach equilibrium.
- Activate a second pump to flush a wash buffer through the detection chamber, removing unbound antibodies and sample matrix.
Signal Development and Image Capture:
- Activate a third pump to deliver the enzyme substrate (e.g., TMB for HRP) to the detection chamber.
- Incubate for a precise, pre-optimized period (e.g., 5 minutes) to allow color development. The color intensity is inversely proportional to the pharmaceutical concentration in the sample.
- Use the smartphone app to automatically capture an image of the detection chamber once the reaction is complete.
On-Device Data Processing:
- The smartphone application executes the processing pipeline:
- Pre-processing: Corrects the image and extracts the mean pixel intensity from the detection chamber.
- Quantification: Converts the intensity to an OD value, which is interpolated against the pre-loaded 4PL standard curve for BDE-47.
- Result Reporting: Displays the calculated pharmaceutical concentration (e.g., in μg/L) on the screen and optionally transmits the data to a cloud server.
- The smartphone application executes the processing pipeline:
Performance Validation and Metrics
The performance of the described platform for BDE-47 detection has been quantitatively evaluated. The following table summarizes key performance metrics, demonstrating the system's viability for environmental monitoring.
Table 2: Quantitative Performance Metrics of a Smartphone-Interfaced ELISA for BDE-47 Detection [21]
| Parameter | Quantitative Result | Implication for Pharmaceutical Detection |
|---|---|---|
| Detection Range | 10⁻³ to 10⁴ μg/L | Covers a wide range of environmentally relevant concentrations for various contaminants. |
| Assay Time | < 30 minutes (on-chip) | Enables rapid, on-site screening compared to lab-based methods. |
| Sensitivity | Comparable to standard plate-based competitive ELISA [21] | Provides laboratory-level confidence in field results. |
| Specificity | Enabled by VHH antibodies [21] | Minimizes false positives from complex water sample matrices. |
The integration of on-device data processing with smartphone-based microfluidic ELISA creates a robust and transformative platform for the decentralized monitoring of pharmaceuticals in water. By providing detailed protocols for image analysis, quantitative curve fitting, and a complete experimental workflow, this application note empowers researchers to implement this cutting-edge technology. The system's ability to rapidly convert a raw colorimetric image into an accurate, quantitative result directly in the field addresses a critical need for accessible environmental surveillance, paving the way for more widespread and effective assessment of water quality.
Enhancing Performance: Sensitivity, Specificity, and Real-World Usability
Strategies for Improving Limit of Detection (LOD) in Complex Water Matrices
The accurate detection of pharmaceutical residues in complex water matrices presents a significant challenge for environmental researchers and analytical chemists. These contaminants often exist at trace concentrations, and the water sample components can severely interfere with analytical signals. The limit of detection (LOD) represents the lowest concentration of an analyte that can be reliably distinguished from background noise, making its improvement crucial for early warning systems and regulatory compliance [50] [51]. Within the framework of smartphone-based ELISA on-chip platforms, optimizing LOD becomes particularly critical as these systems aim to provide sensitive, field-deployable alternatives to conventional laboratory instrumentation [52] [18]. This application note details practical strategies and protocols for enhancing LOD in the context of microfluidic immunoassays targeting pharmaceutical compounds in challenging water samples.
Core Strategies for LOD Improvement
Improving LOD fundamentally relies on enhancing the signal-to-noise ratio, which can be achieved by either amplifying the target signal or reducing background interference [53]. The following sections outline key approaches, with a focus on their application to smartphone-based ELISA chips.
Sample Preparation and Pre-Concentration
Effective sample preparation is the first critical step to mitigate matrix effects and concentrate target analytes.
- Solid-Phase Extraction (SPE): SPE utilizes cartridges with functionalized sorbents to selectively adsorb analytes from large water volumes. Following adsorption, analytes are eluted with a small volume of organic solvent, achieving both clean-up and pre-concentration [50] [53]. This significantly enhances sensitivity by increasing the effective concentration of the target pharmaceutical entering the microfluidic chip.
- Liquid-Liquid Extraction (LLE): This method partitions analytes between immiscible solvents based on solubility, purifying samples and reducing interfering compounds from the aqueous matrix [53].
- Filtration and Centrifugation: These physical separation methods effectively remove large particulate matter, suspended solids, and other interferents that could clog microfluidic channels or contribute to non-specific binding in ELISA [54].
Surface Engineering and Assay Chemistry
Optimizing the solid-liquid interface and biochemical reactions within the chip is paramount for maximizing specific signal generation.
- Nonfouling Surface Modifications: Coating microfluidic channels or detection zones with antifouling polymers like polyethylene glycol (PEG) or polysaccharides (e.g., chitosan) minimizes non-specific adsorption of matrix components, thereby reducing background noise [55].
- Oriented Antibody Immobilization: Using bacterial proteins such as Protein G or the biotin-streptavidin system to immobilize capture antibodies ensures a uniform orientation with the antigen-binding sites available. This enhances binding efficiency and assay sensitivity compared to random passive adsorption [55].
- Advanced Signal Amplification: Integrating novel signal generation systems, such as chemiluminescence (CL), which offers high sensitivity with low background noise, is highly compatible with smartphone camera detection [52]. Furthermore, cell-free synthetic biology systems, including CRISPR-Cas or T7 RNA polymerase-based amplification, can be incorporated to exponentially increase the signal output for a single binding event, pushing LOD to lower levels [55].
Fluidic Control and System Integration
Precise fluid handling and system design are essential for assay reproducibility and sensitivity.
- Microfluidic Mixing: Implementing active or passive micro-mixers within the chip enhances the interaction between the analyte and immobilized antibodies by overcoming reliance on slow passive diffusion. This reduces incubation times and improves binding efficiency [55].
- Automated Washing: Integrated, programmable washing steps are crucial for thoroughly removing unbound reagents and sample matrix components. This dramatically lowers background signal and improves the signal-to-noise ratio [55] [52]. Automating this process minimizes user-induced variability.
Table 1: Comparison of LOD Improvement Strategies for Smartphone-Based ELISA-Chip
| Strategy Category | Specific Technique | Key Mechanism | Compatibility with Smartphone-ELISA |
|---|---|---|---|
| Sample Pre-Treatment | Solid-Phase Extraction (SPE) | Analyte concentration & matrix clean-up | High (off-chip pre-processing) |
| Filtration (e.g., 0.22 μm) | Removal of particulates & microbes | Essential pre-step | |
| Surface & Assay Chemistry | PEG-based Nonfouling Coatings | Reduction of non-specific binding | High, improves signal-to-noise |
| Oriented Immobilization (e.g., Protein G) | Increased antibody binding capacity | High, directly enhances capture | |
| Chemiluminescence Detection | High sensitivity, low background noise | Excellent for smartphone cameras | |
| Fluidic & System Design | Integrated Micro-Mixers | Enhanced binding kinetics | High, reduces assay time |
| Automated, Valved Washing | Lower background, improved reproducibility | Critical for "sample-in-answer-out" |
Experimental Protocols
Protocol: On-Chip SPE Pre-concentration for Microfluidic ELISA
This protocol describes an integrated solid-phase extraction module for pre-concentrating analytes prior to the ELISA reaction chamber.
Materials:
- On-chip SPE column packed with C18 or mixed-mode sorbent.
- Water samples (100 mL to 1 L).
- Conditioning solution (methanol).
- Equilibration solution (ultrapure water, pH adjusted).
- Elution solvent (e.g., 70:30 methanol:acetonitrile).
Procedure:
- Conditioning: Flush the on-chip SPE column with 2 column volumes (CV) of methanol.
- Equilibration: Flush with 5 CV of equilibration solution (e.g., ultrapure water at pH 7).
- Sample Loading: Peristaltically pump the water sample through the SPE column at a controlled, slow flow rate (e.g., 1-2 mL/min).
- Washing: Pass 5 CV of equilibration solution to remove weakly adsorbed matrix components.
- Elution: Elute the concentrated analytes with 1-2 CV of elution solvent directly into the ELISA chip's sample reservoir. The eluate is now significantly pre-concentrated and ready for analysis.
Protocol: Chemiluminescence Smartphone-ELISA on a Microfluidic Chip
This detailed protocol is adapted for the detection of a model pharmaceutical, such as a common antibiotic, in water.
Materials:
- Microfluidic chip with antibody-coated detection chambers.
- Capture antibody specific to the target pharmaceutical.
- Biotinylated detection antibody.
- Streptavidin-conjugated Horseradish Peroxidase (SA-HRP).
- Chemiluminescence substrate (e.g., Luminol/H2O2).
- Blocking buffer (e.g., 1% BSA in PBS).
- Washing buffer (e.g., PBS with 0.05% Tween 20).
- Smartphone in a darkbox with a chip adapter.
Procedure:
- Chip Priming and Blocking:
- Flush all channels of the chip with PBS.
- Incubate the detection chambers with blocking buffer for 1 hour at room temperature to minimize non-specific binding.
- Wash with 3 CV of washing buffer.
Sample Incubation:
- Introduce the pre-processed (e.g., concentrated) water sample into the chip.
- Allow the sample to flow through the detection chamber and incubate for 30-45 minutes to facilitate antigen-antibody binding.
- Wash thoroughly with 5 CV of washing buffer to remove unbound molecules.
Detection Antibody Incubation:
- Flow the biotinylated detection antibody through the chip and incubate for 30 minutes.
- Perform another wash with 5 CV of washing buffer.
Signal Amplification:
- Introduce SA-HRP into the chip and incubate for 15-20 minutes.
- Wash stringently with 5 CV of washing buffer to remove any unbound enzyme conjugate.
Signal Generation and Detection:
- Mix the chemiluminescence substrate off-chip and immediately inject it into the microfluidic system.
- Initiate the smartphone camera in a darkbox to capture the light emission from the detection zones. Use a time-lapse or video mode to record the peak intensity, which typically occurs within seconds to minutes.
- Use a dedicated smartphone app to analyze the image/video, quantifying the light intensity from each zone [52] [16].
Workflow and Strategy Visualization
Figure 1: Integrated LOD Improvement Workflow. This diagram outlines the complete process from sample intake to result, highlighting key stages where LOD is enhanced.
Figure 2: LOD Improvement Strategy Map. A hierarchical breakdown of the core approaches for enhancing the signal-to-noise (S/N) ratio.
The Scientist's Toolkit
Table 2: Essential Research Reagent Solutions for Smartphone-Based ELISA-Chip
| Item | Function/Description | Application Note |
|---|---|---|
| Protein G | Bacterial protein that binds Fc region of antibodies, enabling oriented immobilization. | Maximizes capture antibody binding capacity on the chip surface [55]. |
| Polyethylene Glycol (PEG) | Synthetic polymer used for nonfouling surface modifications. | Coats unused surface areas to minimize non-specific protein adsorption, reducing background [55]. |
| Biotinylated Antibody | Detection antibody conjugated to biotin. | Serves as a universal linker for high-affinity streptavidin-enzyme conjugates in signal generation [55]. |
| Streptavidin-HRP | Streptavidin conjugated to Horseradish Peroxidase. | Binds to biotinylated antibodies; enzyme catalyzes chemiluminescent reaction for detection [52]. |
| Chemiluminescence Substrate | Luminol/enhancer/H2O2 mixture. | HRP substrate that produces light upon reaction, ideal for sensitive smartphone camera detection [52]. |
| Blocking Agent (BSA/Casein) | Proteins like Bovine Serum Albumin or casein. | "Blocks" residual surface sites after antibody coating to prevent non-specific binding [55]. |
Minimizing Non-Specific Binding and Background Interference
The integration of enzyme-linked immunosorbent assays (ELISA) with smartphone-based microfluidic chips represents a transformative advancement for the on-site detection of pharmaceutical contaminants in water. This platform combines the specificity of immunoassays with the portability, computational power, and connectivity of smartphones, making it a powerful tool for environmental monitoring [17]. A primary challenge in achieving high-sensitivity detection with these systems is minimizing non-specific binding (NSB) and background interference. NSB leads to false-positive signals and reduced assay sensitivity, which is particularly critical when detecting trace-level analytes like pharmaceutical residues in complex water matrices [56] [57]. This application note provides detailed protocols and strategies to suppress background noise, ensuring the reliability and accuracy of smartphone-based microfluidic ELISA for pharmaceutical detection in water.
Key Concepts and Challenges
Non-specific binding in ELISA occurs when proteins or detection antibodies adhere to surfaces other than the intended target binding sites, such as the walls of the microfluidic channel or the well plate. In the context of smartphone-based detection, even low levels of background interference can significantly obscure the specific signal, as smartphone cameras and sensors may have lower inherent sensitivity compared to laboratory spectrophotometers [16] [56]. The key manifestations of this problem include high background signal, reduced signal-to-noise ratio, and consequently, poor assay sensitivity and inaccurate quantification [57].
For assays deployed in the field using smartphone detection, optimizing every step to minimize this background is paramount. The following sections outline a detailed, optimized protocol and a toolkit of reagent solutions to achieve this goal.
Experimental Protocols
Core Workflow for Smartphone-Based Microfluidic ELISA
The diagram below illustrates the optimized workflow for a sandwich ELISA on a microfluidic chip, integrating key steps to minimize background.
Detailed Coating and Blocking Protocol
This protocol is designed for a microfluidic chip fabricated from polymers like PDMS or PMMA, which are commonly used for their optical properties and ease of fabrication [17].
Materials Required:
- Coating Buffer: 0.2 M carbonate/bicarbonate, pH 9.6 [58].
- Capture Antibody: Specific to the target pharmaceutical, diluted in coating buffer.
- Blocking Buffer: 5% w/v Bovine Serum Albumin (BSA) in PBS or 5% normal serum from the same species as the detection antibody [58] [57]. Ensure BSA is IgG- and protease-free to prevent contamination [58].
- Wash Buffer: PBS or Tris-Buffered Saline (TBS) with 0.05% Tween 20 [57].
Step-by-Step Procedure:
Chip Coating with Capture Antibody:
- Prepare a solution of the capture antibody in carbonate/bicarbonate coating buffer at a concentration of 1–10 µg/mL [59].
- Introduce the antibody solution into the microfluidic channel. For passive pumping, pipette the solution into the inlet reservoir.
- Seal the reservoirs to prevent evaporation and incubate for 2 hours at room temperature with gentle agitation, or overnight at 4°C [59].
- Critical Note: The coating buffer must be protein-free to prevent other proteins from occupying binding sites on the chip and becoming a source of background [58].
Washing:
- After incubation, wash the microfluidic channel three times with wash buffer. For microfluidics, this can be achieved by flowing ~100 µL of wash buffer through the channel per wash [59]. The mild detergent in the wash buffer helps disrupt weak, non-specific interactions.
Blocking:
- Introduce the selected blocking buffer into the channel, ensuring it fills completely.
- Incubate for at least 1–2 hours at room temperature. The blocking agent occupies any remaining protein-binding sites on the chip surface [58] [57].
- Optimization Tip: If background remains high, increase the blocking incubation period or try a different blocking agent, such as casein [57].
Final Wash:
- Perform a final wash step with buffer (2-3 times) to remove any excess, unbound blocking agent before proceeding to sample addition [59].
Sample Preparation and Detection Protocol
Materials Required:
- Water Samples: Pre-filtered to remove particulate matter.
- Detection Antibody: Specific to a different epitope of the target pharmaceutical, preferably conjugated to HRP or Alkaline Phosphatase (AP) [58] [59].
- Enzyme Substrate: TMB (for HRP) or pNPP (for AP), compatible with colorimetric detection via smartphone camera [58].
Step-by-Step Procedure:
Sample and Antigen Incubation:
- Introduce the prepared water sample into the blocked microfluidic channel.
- Incubate to allow the target pharmaceutical (antigen) to be captured by the immobilized antibody. Incubation times (e.g., 1-2 hours) should be optimized for the specific assay [59].
Washing:
- Wash the channel thoroughly (3-5 times) with wash buffer to remove unbound substances from the complex water matrix [56].
Detection Antibody Incubation:
- Introduce the enzyme-conjugated detection antibody into the channel.
- Incubate for 1–2 hours at room temperature to form the "antibody-antigen-antibody" sandwich complex [59].
- Critical Note: The concentration of the detection antibody must be optimized. Too high a concentration can lead to non-specific binding and high background [56].
Final Washing:
Signal Development and Smartphone Detection:
- Introduce the colorimetric enzyme substrate (e.g., TMB) into the channel.
- Allow the color to develop for a precise, pre-determined time (e.g., 5-30 minutes).
- Place the microfluidic chip in a standardized attachment that positions the smartphone camera for consistent imaging. Capture the image immediately after color development or after adding a stop solution (e.g., sulfuric acid for TMB) [56] [58].
- Use a dedicated smartphone app to analyze the color intensity (e.g., RGB values) and correlate it to a standard curve for quantification [16] [17].
The Scientist's Toolkit
The table below details essential reagents and materials critical for successfully implementing a low-background, smartphone-based microfluidic ELISA.
Table 1: Key Research Reagent Solutions for Background Suppression
| Item | Function & Role in Minimizing Background | Key Considerations |
|---|---|---|
| High-Purity BSA | Blocks non-specific binding sites on the chip surface after antibody coating [58] [57]. | Use IgG-free and protease-free preparations to avoid cross-reactivity or sample degradation [58]. |
| Cross-Adsorbed Secondary Antibodies | Detection antibodies purified to remove antibodies that cross-react with non-target species proteins. | Minimizes background caused by secondary antibody binding to capture antibody or other assay components [58]. |
| Matched Antibody Pairs | Pairs of capture and detection antibodies that bind distinct, non-overlapping epitopes on the target antigen [59]. | Essential for sandwich ELISA; ensures specific signal and prevents steric hindrance or competition. |
| Wash Buffer with Tween-20 | Buffer used to remove unbound reagents between each assay step. The detergent Tween-20 disrupts hydrophobic non-specific interactions [57]. | Optimize the number and volume of washes; insufficient washing leaves unbound reagents, while excessive washing can weaken specific binding. |
| Microplate/ Chip Substrate | The solid phase (e.g., polystyrene microplate, PDMS, or PMMA chip) to which the capture antibody is adsorbed [58] [17]. | Source from trusted suppliers. "Sticky" plates or chips with poor surface properties can cause excessive NSB. Polymer chips offer good optical properties for smartphone detection [17]. |
Troubleshooting and Optimization Strategies
Despite a robust protocol, background issues may persist. The following table guides systematic troubleshooting.
Table 2: Troubleshooting High Background in Smartphone ELISA
| Problem | Possible Cause | Recommended Solution |
|---|---|---|
| Consistently High Background | Inefficient blocking. | Increase blocking incubation time; change blocking agent (e.g., switch from BSA to 5% normal serum from the detection antibody host species) [58] [57]. |
| Detection antibody concentration too high. | Titrate the detection antibody to find the optimal dilution that maximizes signal-to-noise [56]. | |
| High Background in Sample Wells | Non-specific interference from the complex sample matrix (e.g., water contaminants). | Dilute the sample further; use a sample purification step (e.g., solid-phase extraction) to remove interferents [58]. |
| High Signal in Negative Controls | Non-specific binding of the detection antibody. | Include a control without the primary antibody. Use cross-adsorbed secondary antibodies to minimize cross-reactivity [56] [58]. |
| Variable Background | Inconsistent washing. | Standardize and automate washing steps as much as possible. Ensure wash buffer flows through all areas of the microfluidic channel uniformly [56] [57]. |
Optimizing Reagent Volumes and Incubation Times for Rapid Analysis
The detection and quantification of pharmaceutical residues in water sources represent a critical challenge in environmental monitoring. Traditional enzyme-linked immunosorbent assay (ELISA), while specific and sensitive, involves laborious sample handling, high reagent consumption, and prolonged incubation periods, making it less ideal for rapid field deployment [60]. This application note details optimized protocols for performing ELISA on smartphone-interfaced microfluidic chips, specifically designed for the rapid detection of pharmaceuticals in water. By systematically optimizing reagent volumes and incubation times, and leveraging the miniaturization and portability of lab-on-a-chip technology, these methods significantly accelerate analysis time while maintaining robust analytical performance, supporting the broader thesis of deploying smartphone-based biosensing in water research [24] [21].
Optimization Strategies for Microfluidic ELISA
The transition from conventional plate-based ELISA to a microfluidic format necessitates a re-optimization of key physical and chemical parameters. The core strategy focuses on enhancing mass transfer in microchannels and reducing reagent volumes without compromising the signal-to-noise ratio.
Optimizing Assay Components and Reagent Volumes
In microfluidic ELISA, every component must be calibrated for maximum efficiency at a reduced scale. The primary goal is to identify the working concentration that provides a strong specific signal with minimal background.
Table 1: Recommended Reagent Concentrations for Microfluidic ELISA Optimization
| Assay Component | Recommended Concentration Range | Key Considerations |
|---|---|---|
| Capture Antibody [45] [61] | Affinity-purified: 1–12 µg/mLUnpurified (e.g., serum, ascites): 5–15 µg/mL | Affinity-purified antibodies are recommended for optimal signal-to-noise ratio. |
| Detection Antibody [45] [61] | Affinity-purified: 0.5–5 µg/mLUnpurified: 1–10 µg/mL | Biotinylated detection antibodies offer flexibility for signal amplification. |
| Enzyme Conjugate [45] | HRP (Colorimetric): 20–200 ng/mLHRP (Chemiluminescent): 10–100 ng/mLAlkaline Phosphatase (AP, Colorimetric): 100–200 ng/mL | Concentration must align with the detection method and substrate sensitivity. |
Optimization of these components is efficiently performed using a checkerboard titration, where different concentrations of capture and detection antibodies are tested against each other in a grid pattern, with all other reagents held constant [45]. This approach allows for the simultaneous identification of the optimal pair of concentrations.
Additional critical optimizations include:
- Blocking Buffer: Test different commercial formulations or concentrations of proteins like BSA to find the condition that minimizes non-specific binding without interfering with the immunoreaction [45] [61].
- Sample/Standard Diluent: The diluent should match the sample matrix (e.g., filtered water sample) as closely as possible to avoid matrix effects. Performance should be validated through spike-and-recovery and linearity-of-dilution experiments [45] [61].
Accelerating Incubation Times
Miniaturization reduces diffusion distances, which can significantly shorten the time required for reagents to bind to their targets.
Table 2: Framework for Optimizing Incubation Parameters
| Parameter | Conventional Benchmark | Microfluidic Optimization Strategy | Expected Outcome |
|---|---|---|---|
| General Incubation | Often 1-2 hours [45] | Systematically reduce time (e.g., 30, 15, 5 min) while monitoring signal strength. | Reduction to minutes without significant signal loss. |
| Temperature Control | Room temperature or 37°C | Leverage on-chip heating elements for controlled, elevated temperatures to accelerate kinetics. | Faster immunocomplex formation. |
| Fluid Dynamics | Static incubation | Utilize continuous or pulsed flow to enhance mixing and replenish reagents at the active surface. | Improved efficiency and further reduced incubation times. |
The success of shortened incubation periods must be statistically validated against established protocols to ensure that the reduction in time does not significantly alter the microorganism recovery or analyte detection [62].
Protocol for Rapid, Smartphone-Based Microfluidic ELISA
The Scientist's Toolkit: Essential Materials and Reagents
Key Research Reagent Solutions:
- Capture and Detection Antibodies: Specific to the target pharmaceutical (e.g., anti-BDE-47 VHH [21] or anti-TNF-α [63]).
- Biotin-Streptavidin System: For signal amplification (e.g., biotinylated detection antibody and Streptavidin-HRP conjugate) [45].
- Enhanced Chemiluminescent (ECL) Substrate: For high-sensitivity detection with a smartphone camera [45] [24].
- Smartphone Interfacing Setup: A 3D-printed or commercial cradle to align the microchip with the smartphone camera [24] [21].
- Portable Power Source: A USB-powered microcontroller (e.g., Arduino) to operate on-chip electrolytic pumps [21].
Experimental Workflow
The following diagram illustrates the integrated workflow of the smartphone-based microfluidic ELISA system, from sample introduction to result analysis.
Step-by-Step Procedure
Step 1: Microfluidic Chip Preparation
- Fabricate microchannels in PDMS or PMMA using soft lithography or laser etching [21] [60].
- Functionalize the channel surface. For PMMA, this can involve coating with poly(ethyleneimine) (PEI) to introduce amine groups for covalent antibody immobilization [60].
- Immobilize the capture antibody by flowing a solution (1–12 µg/mL in coating buffer) through the channel and incubating. This can be done passively or assisted by an electrolytic pump [45] [21] [60].
- Block the channels with a suitable blocking buffer (e.g., 1-5% BSA) for 30-60 minutes to prevent non-specific binding [45] [61].
Step 2: On-Chip Immunoassay Execution
- Introduce the water sample (pre-concentrated if necessary) and the detection antibody (0.5–5 µg/mL) into the chip. The use of electrolytic micropumps, powered by a smartphone via a USB interface, allows for automated and sequential delivery of these reagents [21].
- Incubation Optimization: Instead of a long, static incubation, employ flow-based incubation. The total time for immunocomplex formation can often be reduced to 15-30 minutes by circulating the reagents through the channel [21] [60].
- Introduce the enzyme conjugate (e.g., Streptavidin-HRP at 10-100 ng/mL) and incubate for an optimized period of 5-15 minutes with flow.
Step 3: Signal Generation and Smartphone Detection
- Flush the chip with wash buffer to remove unbound enzyme conjugate.
- Mix and inject the chemiluminescent substrate (e.g., for HRP) into the chip [45] [24].
- Immediately place the chip into a light-tight smartphone cradle and capture the chemiluminescent signal using the phone's camera in video or time-lapse mode [24] [21].
- Use a dedicated smartphone application or transfer the data to a computer for intensity quantification and generation of a calibration curve.
Discussion
The integration of optimized reagent volumes and shortened incubation times within a smartphone-interfaced microchip creates a powerful tool for environmental surveillance. This platform directly addresses the need for monitoring pharmaceuticals in urban water streams, where compounds like anti-inflammatories, anticonvulsants, and psychiatric drugs are frequently detected [64] [65]. The miniaturized system conserves precious reagents and expensive antibodies, which is particularly advantageous when analyzing a "new" target and matched antibody pairs are not commercially available [45].
The primary limitation of this approach is the potential for matrix effects from complex water samples, which can be mitigated by sample pre-filtration and the use of appropriate standard diluents [61]. Furthermore, the analytical performance of this rapid method must be rigorously validated against standard laboratory techniques to ensure data reliability for critical environmental and public health decisions [64]. Future work will focus on expanding this platform for the multiplexed detection of a wider panel of pharmaceutical residues and their metabolites in a single run.
Ensuring Assay Reproducibility and Chip-to-Chip Consistency
Reproducibility is a fundamental requirement in analytical science, becoming particularly critical when deploying enzyme-linked immunosorbent assays (ELISAs) on microfluidic chips for detecting pharmaceutical residues in water. Traditional plate-based ELISA benefits from established standardization protocols, but transferring these assays to chip-based platforms introduces new challenges in maintaining consistency between individual devices. For smartphone-based detection systems aimed at environmental monitoring, ensuring chip-to-chip consistency is paramount for generating reliable, comparable data across different locations and timepoints. This application note outlines key validation methodologies and experimental protocols to ensure assay reproducibility throughout the development and implementation of smartphone-based ELISA-on-chip platforms.
Principles of Reproducibility in Immunoassays
Assay reproducibility encompasses multiple dimensions of variability that must be characterized and controlled. Repeatability refers to the agreement between measurements taken under identical conditions (same operator, same chip, same laboratory), while reproducibility describes the agreement between measurements using the same method but under different conditions (different operators, different chips, different laboratories) [66].
In immunoassays, reproducibility is quantitatively expressed through the coefficient of variation (%CV), which describes relative variation independently of absolute values. The %CV is calculated as the standard deviation (σ) of a set of measurements divided by the mean (µ) of the set, expressed as a percentage: %CV = (σ / µ) × 100 [66]. For ELISA, precision is typically evaluated at two levels: intra-assay precision (variation between wells within a single run, with %CV should not exceed 10-15%) and inter-assay precision (variation between runs or plate-to-plate, with %CV should not exceed 15-20%) [66].
When transitioning to chip-based platforms, an additional dimension of chip-to-chip consistency must be considered, encompassing variability introduced during chip fabrication, reagent deposition, and the fluidic handling characteristics of each device.
Establishing Lot-to-Lot Reproducibility for Assay Components
Kit Validation Requirements
For any ELISA-based detection system, consistent performance across different lots of critical components must be rigorously validated. Before releasing new lots, manufacturers should conduct comprehensive testing to confirm three key parameters [67]:
- High specificity for the target of interest, demonstrated by low background signal
- Comparable sensitivity to current lots, with similar limits of detection
- Broad dynamic range demonstrated through sensitivity curves
Statistical Criteria for Lot Acceptance
New ELISA kit lots should meet specific statistical benchmarks when compared to current lots. Representative validation criteria are summarized in Table 1.
Table 1: Statistical Criteria for ELISA Lot-to-Lot Validation
| Parameter | Acceptance Criterion | Experimental Approach |
|---|---|---|
| Signal/Blank Ratio | >5.0 for highest titration point; similar range to current lot [67] | Side-by-side titration curves with current and new lots [67] |
| Inter-assay Variance | <15% coefficient of variation [67] | %CV calculation from titration curves run on three randomly selected strips [67] |
| Correlation with Current Lot | R-squared value between 0.85-1.00 [66] | Linear regression analysis of results from 37-40 positive samples [66] |
| Slope of Fitting Line | 0.85 - 1.15 (ideal correction factor 1.00) [66] | Comparison curve of old vs. new kit lots tested the same day [66] |
Experimental Protocol: Lot-to-Lot Comparison
Purpose: To validate that a new lot of ELISA components performs comparably to the current lot.
Materials:
- Current and new lots of ELISA components (capture antibodies, detection antibodies, enzyme conjugates)
- Positive control samples with known analyte concentrations
- Standard buffer solutions
- Microfluidic chips or plates
- Detection instrumentation (smartphone reader or plate reader)
Procedure:
- Sample Preparation: Prepare at least 37-40 positive samples spanning the assay's dynamic range, with concentrations in the low, middle, and high regions of the standard curve [66].
- Same-Day Testing: Analyze all samples with both current and new lots on the same day to minimize variability from sample degradation.
- Standard Curve Generation: For each lot, generate standard curves using serial dilutions of the target analyte.
- Data Collection: Measure optical density or fluorescence signals for all samples and standards.
- Statistical Analysis:
- Plot results from the new lot against the current lot in a linear curve fit
- Calculate R-squared value (should be 0.85-1.00)
- Determine slope of fitting line (should be 0.85-1.15)
- Calculate %CV between paired measurements (should be <15%)
Troubleshooting Tips:
- If correlation falls below acceptance criteria, check reagent storage conditions and preparation procedures
- If %CV exceeds limits, verify pipetting accuracy and incubation timing
- Consider testing additional samples to confirm initial findings
Ensuring Chip-to-Chip Consistency in Microfluidic Platforms
Fabrication Quality Control
Microfluidic chip consistency begins with controlled fabrication processes. The 3D-printed capillaric ELISA chip demonstrates how structural encoding of fluidic functions can achieve high reproducibility [31]. Key parameters to monitor during fabrication include:
- Channel dimensions and surface characteristics
- Bonding quality between layers
- Membrane porosity and uniformity for nitrocellulose-based capture zones
- Reagent deposition consistency in pre-loaded chips
Volumetric Accuracy in Fluid Handling
Capillaric circuits must consistently handle precise volumes for reliable assay performance. The ELISA-on-a-chip with aliquoting functionality demonstrates >93% aliquoting accuracy across multiple reservoirs [31]. Table 2 outlines critical fluidic parameters to monitor for chip-to-chip consistency.
Table 2: Fluidic Parameters for Chip-to-Chip Consistency
| Parameter | Target Performance | Validation Method |
|---|---|---|
| Aliquoting Accuracy | >93% volumetric accuracy [31] | Gravimetric measurement of aliquoted volumes |
| Flow Timing | <10% variation in step completion times [31] | Visual monitoring of fluid front progression |
| Mixing Efficiency | Consistent between chips | Dye dispersion studies |
| Wash Efficiency | >95% removal of unbound components [32] | Measurement of signal reduction in wash steps |
Experimental Protocol: Chip Performance Validation
Purpose: To validate consistent fluidic handling and assay performance across multiple chips from the same production batch.
Materials:
- Multiple chips from the same fabrication batch
- Colored dye solutions
- Buffer solutions containing surfactants (e.g., 0.05% Tween-20)
- Timer or stopwatch
- Analytical balance (for gravimetric analysis)
Procedure:
- Visual Inspection: Examine each chip for defects in channels, reservoirs, and bonding surfaces.
- Capillary Flow Test: Load dye solution into sample inlet and measure time for fluid to reach specific circuit points.
- Aliquoting Verification:
- Load a precise volume of water into each reagent inlet
- Collect aliquoted volumes from measuring reservoirs
- Weigh collected volumes to determine aliquoting accuracy
- Surfactant Tolerance: Repeat flow tests with buffers containing 0.05% Tween-20 to ensure valve function with commonly used immunoassay surfactants [31].
- Data Analysis:
- Calculate mean and %CV for flow timing between chips
- Determine mean and %CV for aliquoted volumes
- Document any chip failures or irregularities
Integration with Smartphone Detection Systems
Imaging Consistency
Smartphone-based detection introduces additional variables that must be controlled for reproducible results. The camera system, lighting conditions, and image analysis algorithms all contribute to overall system variance [16]. Key considerations include:
- Camera specifications: Sensor size, pixel dimensions, and lens quality vary between smartphone models [16]
- Lighting control: Consistent illumination is critical for quantitative colorimetric measurements
- Focus and positioning: Reproducible distance and orientation between chip and camera
Signal Processing and Data Analysis
Consistent data extraction from smartphone images requires standardized processing approaches:
- Color space selection: RGB, HSV, or grayscale conversion based on assay chemistry
- Region of interest (ROI) definition: Consistent positioning of analysis areas
- Background subtraction: Uniform approach to correcting for non-specific signal
- Calibration curves: Regular validation using standard concentrations
The Scientist's Toolkit: Essential Research Reagent Solutions
Successful implementation of reproducible smartphone-based ELISA-on-chip platforms requires carefully selected materials and reagents. Table 3 outlines essential components and their functions.
Table 3: Essential Research Reagent Solutions for Smartphone-Based ELISA-on-Chip
| Reagent/Material | Function | Considerations for Reproducibility |
|---|---|---|
| High-Specificity Antibodies | Target capture and detection [67] | Validate lot-to-lot consistency; application-specific testing [67] |
| Blocking Buffers | Minimize non-specific binding [32] | Use consistent formulation and concentration across experiments |
| Enzyme Conjugates | Signal generation [68] | Standardize labeling efficiency and activity between lots |
| Colorimetric Substrates | Visual signal production [68] | Monitor stability and batch-to-batch consistency |
| Microfluidic Chip Materials | Fluidic handling and assay execution [31] | Control fabrication parameters and surface properties |
| Reference Standards | Calibration and quantification [66] | Use traceable standards with documented stability |
Workflow for Reproducible Chip-Based ELISA
The following diagram illustrates the complete workflow for developing and validating a reproducible smartphone-based ELISA-on-chip system, integrating both lot-to-lot and chip-to-chip consistency measures:
Achieving robust reproducibility in smartphone-based ELISA-on-chip platforms for pharmaceutical detection in water requires systematic attention to both component quality and system integration. By implementing rigorous lot-to-lot validation of critical reagents, maintaining tight control over chip fabrication processes, and standardizing smartphone detection protocols, researchers can generate reliable, comparable data across multiple devices and locations. The protocols and validation criteria outlined in this application note provide a framework for developing environmental monitoring systems that combine the convenience of point-of-need testing with the reliability of laboratory-based methods.
Battery Life, Data Management, and Ruggedness for Field Deployment
The deployment of smartphone-based enzyme-linked immunosorbent assay (ELISA) platforms for monitoring pharmaceuticals in water sources presents distinct challenges in field settings. This application note details protocols and considerations for three critical aspects of field deployment: optimizing battery life for extended operation, implementing robust data management strategies, and ensuring the ruggedness of equipment in diverse environmental conditions. These factors are paramount for generating reliable, high-quality data in remote or resource-limited environments where traditional laboratory infrastructure is unavailable.
Technical Specifications for Field-Ready Devices
The selection of appropriate hardware is the foundation of a successful field deployment. The following specifications should be prioritized for a smartphone-based ELISA platform intended for pharmaceutical detection in water research.
Table 1: Key Technical Specifications for Field Deployment
| Component | Key Specification | Importance for Field Deployment |
|---|---|---|
| Battery | Capacity: ≥4000 mAh [69]Operating Time: Up to 14 hours [69]Type: Removable/replaceable [70] | Enables extended operation in areas without reliable power sources. A removable battery allows for quick swaps in the field. |
| Durability | Ingress Protection: IP65 or higher (dust-tight and protected against water jets) [69] [70]Drop Specification: Survives drops from ≥1.2 meters [69] | Withstands harsh environmental conditions encountered during field sampling, including rain, dust, and accidental impacts. |
| Data Connectivity | Options: 4G LTE, Dual-Band Wi-Fi, Bluetooth 5.0 [69] | Ensures reliable data transfer from the field to cloud servers or central databases, facilitating real-time analysis and remote collaboration. |
| Operating System | Modern OS (e.g., Android 12) with GMS Certification [69] | Supports the development and stable operation of custom applications for data acquisition, instrument control, and preliminary analysis. |
Experimental Protocols
Protocol: Power Management for Extended Field Assays
This protocol ensures continuous operation of the smartphone-based ELISA platform during prolonged field use.
I. Materials
- Smartphone or rugged tablet with ≥4000 mAh battery [69]
- Portable power bank (optional)
- USB Type-C cable
II. Procedure
- Pre-Field Preparation: Fully charge the primary device and any backup power banks before departing for the field.
- Device Configuration:
- Activate the device's built-in power-saving mode.
- Reduce screen brightness to the minimum usable level.
- Disable non-essential wireless communications (e.g., Bluetooth, Wi-Fi) when not actively transferring data.
- Assay Execution: Perform the smartphone-based ELISA analysis as per standard microfluidic protocols [21] [71]. The use of low-power components, such as LEDs for illumination and electrochemically generated micropumps, minimizes the peripheral power draw [21] [3].
- Data Transmission: Enable high-speed connectivity (4G/LTE or Wi-Fi) only during data upload to cloud servers to conserve power. Once transfer is verified, disable the connection [69] [72].
Protocol: Data Acquisition and Cloud-Based Management
This protocol outlines the workflow for capturing, processing, and managing assay data securely from the field.
I. Materials
- Smartphone with a high-resolution camera (e.g., 16 MP) [69]
- Custom application for image capture and control
- Cloud computing server for data processing
II. Procedure
- Image Capture: Using the in-house developed application, capture images of the microfluidic ELISA plate or lateral flow assay strip. The app should standardize capture conditions to minimize variability [71] [72].
- Data Pre-processing: The smartphone application performs initial image processing, such as cropping and color channel extraction (RGB values) [71].
- Secure Data Transfer: Transmit the pre-processed image data wirelessly to a cloud server. This step leverages the smartphone's 4G LTE or Wi-Fi capabilities [69] [3].
- Cloud-Based Analysis: On the server, machine learning algorithms (e.g., adaptive boosting regression, convolutional neural networks) analyze the data to quantify analyte concentration, correlating RGB values with optical density [71] [72].
- Result Reporting and Archiving: The diagnostic results are sent back to the smartphone for user display and are simultaneously archived in a secure cloud database with spatiotemporal labels for future access and epidemiological tracking [3] [71].
Protocol: Ruggedness Testing and Field Handling
This protocol validates the physical resilience of the equipment to ensure reliable performance under field conditions.
I. Materials
- Rugged smartphone/tablet (IP65 rated, 1.2m drop-proof) [69]
- Protective boot case [69]
- Glove-compatible touchscreen stylus (optional) [70]
II. Pre-Deployment Testing Procedure
- Sealing Check: Visually inspect the device and its ports for any damage. Confirm that all protective covers are securely fastened.
- Environmental Testing: Verify the device's operational temperature range (typically -10°C to 50°C) to ensure suitability for the deployment climate [69].
- Impact Resistance: The device should be certified to withstand tumbles and drops from at least 1.2 meters, with a protective case increasing this threshold to 1.5 meters [69].
III. Field Handling Procedure
- Always use the provided protective boot case.
- In wet or dusty conditions, ensure the IP65-rated covers are properly sealed after using any ports.
- The device's touchscreen is designed to be operated while wearing thick industrial gloves, which should be utilized in rough environments [70].
Workflow Visualization
The following diagram illustrates the integrated workflow for a field-deployed smartphone-based ELISA analysis, from sample collection to result reporting, highlighting the critical roles of battery life, data management, and device ruggedness.
The Scientist's Toolkit: Research Reagent Solutions
The successful implementation of a smartphone-based ELISA for pharmaceutical detection relies on a suite of specialized reagents and materials.
Table 2: Essential Research Reagents and Materials
| Item | Function/Description | Application Note |
|---|---|---|
| VHH Antibodies (Nanobodies) | Variable domain of heavy chain antibodies; used as sensitive and stable recognition elements [21]. | Ideal for field assays due to their high stability and sensitivity for small molecules like BDE-47, a model environmental contaminant [21]. |
| C-PDMS Electrodes | Carbon-black-PDMS composite material fabricated into interdigitated electrodes [21]. | Serves as a low-cost, disposable, and low-power electrolytic micropump for fluid actuation within the microfluidic chip, powered by the smartphone [21]. |
| HRP-Labeled Detection Probe | Horseradish peroxidase (HRP) enzyme conjugated to a detection antibody or nanobody [21]. | Catalyzes a colorimetric reaction in the presence of a substrate, generating a signal detectable by the smartphone camera for quantitative analysis. |
| Polydimethylsiloxane (PDMS) | Elastomer used for fabricating microfluidic chips via soft lithography or laser etching [21]. | The primary material for the lab-on-a-chip device, allowing for precise manipulation of minute fluid volumes and integration of functional components like electrodes. |
| Colorimetric ELISA Substrate | A substrate that produces a colored, soluble product upon reaction with the HRP enzyme [71]. | The resulting color intensity, measured by the smartphone's digital image colorimetry, is directly correlated to the concentration of the target pharmaceutical analyte [71]. |
Benchmarking Performance: Validation Against Standard Methods and Future Potential
The detection and quantification of pharmaceutical residues in water sources represent a significant challenge in environmental monitoring. Within this context, establishing robust validation frameworks that correlate innovative smartphone-based microfluidic ELISA with established laboratory methods is paramount. This document details application notes and protocols for validating a smartphone-based ELISA-on-chip platform for pharmaceutical detection in water, using High-Performance Liquid Chromatography (HPLC) and standard laboratory ELISA as reference standards. The convergence of microfluidic technology, smartphone imaging, and artificial intelligence offers unprecedented potential for point-of-care testing (POCT), but requires rigorous correlation with conventional analytical techniques to ensure data reliability and acceptance within the scientific and regulatory communities [73] [3].
Comparative Analysis of Detection Methods
Fundamental Principles and Technical Characteristics
Standard Laboratory ELISA is a well-established plate-based assay technique for detecting and quantifying soluble substances such as peptides, proteins, antibodies, and hormones. The process involves immobilizing an antigen on a solid surface, complexing it with an antibody linked to an enzyme, and detecting the presence of the antigen through a colorimetric reaction catalyzed by the enzyme. The optical density (OD) of the resulting solution is measured using a plate reader, and the target concentration is determined by interpolation from a standard curve [74]. For pharmaceutical monitoring, ELISA provides high specificity and sensitivity, with the ability to process multiple samples simultaneously. However, it can be time-consuming, requires well-equipped laboratory settings, and may be subject to matrix interference in complex samples like wastewater [75] [76].
HPLC, particularly when coupled with fluorescence (FL) or mass spectrometry (MS) detectors, is a powerful separation technique used for precise identification and quantification of individual compounds in a mixture. In HPLC, the sample is forced through a column packed with chromatographic packing material under high pressure by a liquid (mobile phase). The different components in the sample interact differently with the column packing, causing them to elute at different times (retention times), thus separating them. HPLC is recognized for its high sensitivity, precision, and ability to provide confirmatory analysis, making it a reference method for many analytical applications, including the detection of contaminants in food, feed, and environmental samples [77] [75] [76]. Its main drawbacks are the requirement for expensive equipment, highly trained technicians, and extensive sample preparation, including pre-concentration and clean-up steps such as immunoaffinity chromatography [77] [76].
Smartphone-Based Microfluidic ELISA represents the integration of microfluidic technology, smartphone imaging, and data analysis. The assay principle remains based on the immunoassay and enzymatic color reaction of conventional ELISA. However, the reaction occurs within the miniaturized channels or chambers of a microfluidic chip, which reduces reagent consumption and analysis time. The smartphone, equipped with complementary metal oxide semiconductor (CMOS) cameras, serves as a portable detector for capturing the colorimetric signal. Supporting components, such as 3D-printed adapters, lenses, and light sources, ensure optimal imaging conditions. The acquired images are then processed and analyzed by software and artificial intelligence (AI) algorithms on the device or via a cloud server, providing quantitative results [73] [3]. This platform is designed for portability, rapid analysis, and use in resource-limited environments.
Performance Comparison and Validation Parameters
The table below summarizes the key performance characteristics of the three analytical platforms, which must be evaluated during the validation and correlation process.
Table 1: Comparison of Analytical Methods for Pharmaceutical Detection
| Parameter | Standard Laboratory ELISA | HPLC (with FL or MS detection) | Smartphone-Based Microfluidic ELISA |
|---|---|---|---|
| Principle | Immunoassay, colorimetric detection [74] | Chromatographic separation, physicochemical detection [77] [76] | Immunoassay, colorimetric detection with smartphone imaging [3] |
| Throughput | High (multiple samples in parallel) | Moderate to High (serial analysis) | Moderate (depends on chip design) |
| Analysis Time | Several hours (including incubation) [76] | 30 minutes to over 1 hour (per run) [76] | Potentially faster due to smaller dimensions [73] |
| Sensitivity | High (in the μg/kg to ng/kg range) [75] [76] | Very High (can reach ng/kg or pg/kg) [77] [76] | To be validated against reference methods [73] |
| Specificity | High (depends on antibody) | Very High (confirmation via retention time/MS spectrum) | High (depends on antibody; can be enhanced by AI) [3] |
| Sample Volume | ~50-100 μL per well [74] | ~10-100 μL injection volume | Low (μL scale), reduced reagent consumption [73] |
| Equipment Cost | Moderate (plate reader required) | High (HPLC system, specialized lab) | Low (smartphone and low-cost accessories) [3] |
| Portability | Low | Low | High [3] |
| Data Analysis | Standard curve fitting [74] | Calibration curve, peak integration | Image analysis, machine learning algorithms [3] |
| Key Advantage | Established, high-throughput, cost-effective for screening | Gold standard for confirmation, high sensitivity and specificity | Portability, rapidity, potential for point-of-care use [73] [3] |
| Key Limitation | Potential for matrix interference, laboratory-bound | Expensive, requires skilled operator, complex sample prep | In development, requires validation, limited multiplexing |
Experimental Protocol for Method Correlation
This protocol provides a step-by-step guide for validating the smartphone-based microfluidic ELISA platform by correlating its performance with standard laboratory ELISA and HPLC.
Materials and Reagents
Table 2: Essential Research Reagent Solutions and Materials
| Item | Function/Description | Example/Specification |
|---|---|---|
| Microfluidic Chip | Platform for miniaturized immunoassay. Can be designed with reaction chambers or microchannels [3]. | Disposable chip with integrated channels for sample and reagent flow. |
| Smartphone Platform | Core detection unit. Includes smartphone, imaging adapter, and light source [3]. | Smartphone with high-resolution CMOS camera; 3D-printed adapter with uniform LED illumination. |
| ELISA Kit | Provides the core immunoassay components for the target pharmaceutical (e.g., exenatide, aflatoxins) [76]. | Includes capture antibody, detection antibody, enzyme conjugate, and substrates. |
| HPLC System | Reference method for confirmatory analysis and cross-validation [77] [75]. | System with fluorescence or mass spectrometry detector. |
| Immunoaffinity Columns | Sample clean-up and pre-concentration for HPLC analysis to reduce matrix interference [75]. | Columns with antibodies specific to the target analyte. |
| Standard Solutions | Used for generating calibration curves for all three methods [75] [76]. | Certified reference material (CRM) of the target pharmaceutical. |
| Mobile Phase Solvents | Required for HPLC separation. | HPLC-grade acetonitrile, methanol, and water [75] [76]. |
| Data Analysis Software | For result calculation. Standard curve fitting for ELISA [74] and AI-based image analysis for the smartphone platform [3]. | Software for 4- or 5-parameter logistic curve fitting; custom app with algorithm for image analysis. |
Sample Preparation and Spiking
- Sample Collection: Collect water samples (e.g., effluent from wastewater treatment plants) in clean, sterile containers. Store samples at appropriate conditions (e.g., 4°C or -20°C) immediately after collection to prevent degradation [73].
- Sample Pre-treatment: Filter water samples to remove particulate matter. Depending on the expected analyte concentration, a pre-concentration step (e.g., solid-phase extraction) may be necessary, especially for HPLC analysis [73] [75].
- Sample Spiking: Prepare a stock solution of the target pharmaceutical from certified reference material. Spike the pre-treated water samples at known concentrations covering the expected range (e.g., from below the limit of quantification to well above the maximum expected level). Use unspiked samples as blanks [76].
Parallel Analysis Workflow
- Split Samples: Divide each spiked and blank sample into three aliquots for analysis by: (A) Standard Laboratory ELISA, (B) HPLC, and (C) Smartphone-based Microfluidic ELISA.
- Standard Laboratory ELISA Protocol:
- Follow the manufacturer's instructions for the commercial ELISA kit [76].
- Briefly, add standards and samples to the antibody-coated microwells.
- Add enzyme conjugate and incubate.
- Wash the plate to remove unbound material.
- Add substrate solution and incubate for color development.
- Add stop solution and measure the absorbance of each well immediately using a microplate reader [74].
- HPLC Reference Protocol:
- Extraction: Extract the analyte from the water sample. For instance, mix the sample with a solvent like methanol or acetonitrile and shake vigorously [75].
- Clean-up: Pass the extract through an immunoaffinity column containing antibodies specific to the target pharmaceutical. Elute the bound analyte with a suitable solvent like pure methanol [75].
- Analysis: Inject the purified extract into the HPLC system. The separation can be achieved using a C18 column with a mobile phase of water, methanol, and acetonitrile. Detect the eluted analyte using a fluorescence detector or mass spectrometer [75] [76].
- Smartphone-Based Microfluidic ELISA Protocol:
- Chip Priming and Loading: Introduce the sample and reagents into the microfluidic chip. Fluid control can be achieved via capillary action, integrated finger pumps, or passive vacuum pumps [3].
- On-chip Incubation: Allow the immunoassay reactions (antigen-antibody binding, enzymatic reaction) to occur within the chip's microchannels or chambers.
- Image Acquisition: After color development, place the chip into the 3D-printed smartphone adapter. Use the smartphone application to capture an image of the detection zone under controlled lighting conditions [3].
- Data Analysis: The smartphone application analyzes the image, measuring color intensity. The concentration of the target pharmaceutical is calculated by interpolating the intensity value from a standard curve that was pre-loaded or generated on-chip [3] [74].
Data and Statistical Analysis for Correlation
- Calculation of Results:
- For all methods, average the replicate readings for each standard and sample.
- Generate a standard curve for each method. For ELISA and the smartphone platform, this typically involves plotting absorbance or color intensity against the logarithm of concentration and fitting the data with a 4- or 5-parameter logistic curve [74]. For HPLC, a linear calibration curve is often used.
- Interpolate the sample concentrations from the respective standard curves. For diluted samples, multiply the result by the dilution factor [74].
- Precision and Accuracy: Calculate the intra-assay and inter-assay precision (Coefficient of Variation, CV%) for all methods. The CV for duplicates should typically be ≤ 20% [74]. Determine accuracy by calculating the percent recovery of the spiked known concentrations.
- Sensitivity: Determine the Limit of Detection (LOD) and Limit of Quantification (LOQ) for each method [75] [76].
- Correlation Analysis: Perform linear regression analysis comparing the results from the smartphone-based platform (y-axis) against those from standard ELISA (x-axis) and HPLC (x-axis). Key parameters to report include the slope (ideally close to 1.0), y-intercept (ideally close to 0), and the coefficient of determination (R²), which should be greater than 0.95 to demonstrate strong correlation [76].
Validation Workflow for Method Correlation
The successful correlation of a smartphone-based microfluidic ELISA with HPLC and standard ELISA establishes a robust validation framework that bridges the gap between innovative point-of-care technology and conventional laboratory analysis. This framework demonstrates that the portable, rapid, and cost-effective smartphone platform can generate data of comparable reliability to established methods for monitoring pharmaceuticals in water. This validation is a critical step towards the adoption of such decentralized sensing platforms by researchers, regulatory bodies, and water quality professionals, enabling more widespread and frequent monitoring to better assess and manage environmental contamination.
The detection of pharmaceutical contaminants in water sources is a critical public health challenge, demanding analytical methods that are not only sensitive and reliable but also adaptable for field use. This application note provides a comparative performance analysis and detailed protocols for implementing smartphone-based enzyme-linked immunosorbent assay (ELISA) on a chip, a cutting-edge approach for pharmaceutical detection in water. Traditional laboratory ELISA, while highly sensitive, is often ill-suited for rapid, on-site testing due to its reliance on bulky, expensive instrumentation and lengthy manual procedures. The emergence of miniaturized lab-on-a-chip (LOC) systems coupled with the computational and imaging power of smartphones presents a transformative alternative for point-of-need monitoring. This document outlines the quantitative performance metrics of these different approaches and provides a detailed experimental framework for researchers developing biosensing platforms for environmental water analysis.
Performance Metrics: A Comparative Analysis
The transition from traditional methods to modern portable systems involves key trade-offs between sensitivity, portability, cost, and operational complexity. The following tables summarize the performance characteristics of traditional, other portable, and smartphone-based microfluidic ELISA platforms.
Table 1: Overall System Performance Comparison
| Performance Parameter | Traditional Plate ELISA | Other Portable ELISA Systems | Smartphone-based Microfluidic ELISA |
|---|---|---|---|
| Limit of Detection (LOD) | Sub-picomolar range (e.g., 54 pg mL⁻¹ for SARS-CoV-2 N protein) [31] | Varies; can be comparable to traditional (e.g., 91 pg mL⁻¹ in saliva) [31] | Sensitive to low concentrations (e.g., 10⁻³–10⁴ μg/L for BDE-47) [21] |
| Assay Time | Several hours (2-12 hours) [31] | Reduced (e.g., 75 minutes for automated on-chip) [32] | Significantly reduced (e.g., 1.5 hours) [21] [31] |
| Sample & Reagent Consumption | High (e.g., 100+ μL per well) | Reduced (microliter volumes) [32] | Minimal (nanoliter to microliter volumes) [21] [16] |
| Portability & Footprint | Non-portable; requires benchtop equipment | Portable but may have dedicated peripherals | Highly portable; smartphone is the core platform [21] [3] |
| Degree of Automation | Manual; requires skilled technician | Often fully automated on-chip [32] | High; can be fully automated via capillary flow or electrolytic pumps [21] [31] |
| Quantitative Capability | Excellent; standard curve-based | Good to excellent | Good to excellent; with image-based analysis [27] [3] |
| Cost & Accessibility | High equipment cost; centralized labs | Lower cost but often custom-built | Low-cost potential; leverages ubiquitous smartphones [16] [3] |
Table 2: Key Characteristics of Microfluidic Modalities for Smartphone ELISA
| Microfluidic Modality | Driving Mechanism | Key Features | Example Performance |
|---|---|---|---|
| Capillaric Circuits (CCs) | Capillary action & microfluidic chain reaction (MCR) [31] | Structurally encoded protocol; no external power; includes washing steps; 3D-printed. | LOD: 54 pg mL⁻¹ (buffer); Aliquoting accuracy: >93% [31] |
| Electrolytic Micropumps | Electrolysis & gas bubble expansion [21] | Electrically controlled; low-power; can be USB-powered from a phone. | Sensitive for BDE-47 range of 10⁻³–10⁴ μg/L [21] |
| Bead-Based Columns | Pressure or capillary flow [32] | High surface area for antibody immobilization; enhanced capture efficiency. | Greater sensitivity vs. plate ELISA; dynamic range increased [32] |
| Lateral/Vertical Flow | Capillary action through membrane [3] | Simple, low-cost; suitable for qualitative/semi-quantitative results. | Sensitivity: 97.8%; Specificity: 100% for HIV tests with AI analysis [3] |
| Immunomagnetic Beads (IMB) | Magnetic separation & scattering enhancement [27] | Accurate target separation; signal enhancement for smartphone cameras. | Improved linearity by 22.6%; good correlation with standard methods [27] |
Experimental Protocols
This section provides detailed methodologies for implementing a smartphone-based capillaric ELISA, representative of the most advanced portable systems, and the traditional plate-based method for reference.
Protocol 1: Smartphone-Based Capillaric ELISA-on-a-Chip for Pharmaceutical Antigens
This protocol is adapted from Parandakh et al. for the detection of small molecule pharmaceuticals in water samples [31].
A. Chip Fabrication and Preparation
- Materials: Design files for the capillaric circuit, 3D printer with high-resolution resin, nitrocellulose membrane.
- Procedure:
- 3D Printing: Fabricate the main chip body with integrated capillaric aliquoting circuit (CAC) and measuring reservoirs using a high-resolution 3D printer.
- Antibody Immobilization: Spot the capture antibody specific to the target pharmaceutical (e.g., a VHH or hapten-specific antibody) onto the nitrocellulose membrane in a defined line. Allow to dry.
- Assay Module Assembly: Click-connect the nitrocellulose membrane strip and a capillary pump to the main chip body to form the complete assay module.
B. Chip Loading and Automated Aliquoting
- Materials: Prepared chip, water sample, reagents (detection antibody, enzyme conjugate, wash buffer, substrate), disposable pipettes.
- Procedure:
- Loading: Using standard disposable pipettes, load the respective solutions into their designated inlets on the chip: sample (up to 210 µL), detection antibody (70 µL), enzyme conjugate (50 µL), substrate (80 µL), and wash buffer (which is split into four reservoirs of 40, 40, 60, and 20 µL).
- Autonomous Aliquoting: The CAC will autonomously draw the precise volume of each liquid into its measuring reservoir and drain any excess. No precise pipetting is required by the user.
C. Assay Execution and Smartphone Readout
- Materials: Smartphone with camera and custom app, assembled and loaded chip.
- Procedure:
- Initiation: The user connects the assay module, which triggers the microfluidic chain reaction (MCR). The capillaric domino valves control the sequential, timed flow of all solutions.
- Incubation: The solutions flow in the pre-programmed sequence (sample → wash → detection antibody → wash → enzyme → wash → substrate) with built-in incubation times. The entire process completes in approximately 1.5 hours without user intervention.
- Image Acquisition: After the substrate incubation, a colored precipitate forms a line on the nitrocellulose strip. Place the chip into a standardized imaging enclosure attached to the smartphone to minimize ambient light interference. Capture an image of the detection zone using the smartphone camera.
- Data Analysis: A dedicated smartphone app analyzes the image intensity of the test line. The intensity is correlated with the analyte concentration via a pre-loaded calibration curve to provide a quantitative result.
Protocol 2: Traditional Microplate ELISA for Reference
A. Reagent Coating and Sample Incubation
- Materials: 96-well microplate, capture antibody, blocking buffer (e.g., BSA), samples and standards, washing buffer (PBS with Tween-20).
- Procedure:
- Coating: Add capture antibody in coating buffer to each well. Incubate overnight at 4°C.
- Washing: Wash the plate 3-4 times with washing buffer using a manual multichannel pipette or an automated plate washer.
- Blocking: Add blocking buffer to each well and incubate for 1-2 hours at room temperature. Wash again.
- Sample Addition: Add samples and pharmaceutical standards to the wells. Incubate for 1-2 hours at room temperature. Wash thoroughly.
B. Detection and Signal Development
- Materials: Detection antibody (biotinylated or enzyme-conjugated), enzyme conjugate (e.g., Streptavidin-HRP), colorimetric substrate (e.g., TMB), stop solution (e.g., sulfuric acid), plate reader.
- Procedure:
- Detection Antibody: Add the detection antibody to each well. Incubate for 1-2 hours. Wash.
- Enzyme Conjugate: Add the enzyme conjugate. Incubate for 1 hour. Wash.
- Signal Development: Add the colorimetric substrate solution. Incubate in the dark for 15-30 minutes.
- Stopping and Reading: Add stop solution to terminate the reaction. Immediately measure the absorbance of each well using a microplate reader.
The Scientist's Toolkit: Research Reagent Solutions
Table 3: Essential Materials for Smartphone-Based Microfluidic ELISA
| Item | Function / Description | Example & Notes |
|---|---|---|
| Specialized Antibodies | Molecular recognition of the target pharmaceutical. | VHH (Nanobodies): Offer high stability and sensitivity for small molecules like BDE-47 [21]. |
| Microfluidic Chip | Platform that automates fluid handling and contains the assay. | 3D-printed Capillaric Chip: Structurally encodes the entire ELISA protocol without external power [31]. |
| Signal Generation System | Produces a measurable signal (optical/colorimetric). | HRP enzyme with colorimetric substrate (e.g., TMB or precipitating substrates for nitrocellulose) [32] [31]. |
| Smartphone & App | The core detection device and data processor. | Requires a camera for image capture and a custom app for analysis; can be paired with a 3D-printed imaging enclosure [3]. |
| Solid-Phase Support | Surface for immobilizing the capture agent. | Nitrocellulose membrane (for lateral flow-style readout) [31] or functionalized polystyrene beads (packed in a column for high surface area) [32]. |
| Portable Pumping System | Drives fluid flow in active microfluidic systems. | Electrolytic micropump: Uses interdigitated carbon electrodes to generate gas bubbles for pumping; can be powered by a smartphone's USB [21]. |
| Signal Enhancers | Improve detection limits for smartphone cameras. | Immunomagnetic Beads (IMB): Act as a solid-phase carrier and enhance light scattering, improving absorbance measurement accuracy [27]. |
Workflow and Performance Relationship Diagrams
The following diagrams illustrate the procedural workflow of a smartphone-based ELISA and the logical relationship between the choice of platform and its resulting performance characteristics.
Diagram 1: Smartphone-Based Capillaric ELISA Workflow. The process highlights user-friendly steps (yellow) and automated smartphone-centric steps (green), demonstrating the reduced manual intervention compared to traditional methods.
Diagram 2: Performance Characteristics of ELISA Platforms. This diagram visualizes the core strengths of each platform type (yellow) and the key performance metrics they deliver (green), highlighting inherent compromises (red). The smartphone-based LOC offers a balanced profile ideal for field application.
Application Note: Smartphone-Based Microfluidic ELISA for D-Penicillamine
The detection of pharmaceutical residues in water sources is a growing concern for environmental and public health. D-penicillamine, a thiol-containing drug used for conditions like rheumatoid arthritis and Wilson's disease, represents a notable environmental contaminant due to its persistence and potential ecological effects [78]. Traditional laboratory methods for its detection, including HPLC and spectrophotometry, are often confined to central laboratories due to their dependence on sophisticated, expensive, and non-portable instrumentation [78]. This application note details a successful case study utilizing a smartphone-based microfluidic ELISA platform for the detection of D-penicillamine, demonstrating a viable path toward decentralized, on-site water quality monitoring.
The assay was based on the Ellman's colourimetric reaction, where thiol-containing compounds like D-penicillamine react with 5,5'-dithiobis(2-nitrobenzoic acid) (DTNB, Ellman's reagent) to produce a yellow-colored product [78]. This reaction was miniaturized and integrated with a microplate and smartphone detection system. The key performance metrics are summarized in the table below.
Table 1: Performance Summary of the Smartphone-Based D-Penicillamine Assay
| Parameter | Result | Description |
|---|---|---|
| Analytical Technique | Ellman's colourimetric assay | Reaction between thiol groups and DTNB [78]. |
| Detection Principle | Smartphone colorimetry (RGB analysis) | iPhone 5s camera used to capture and analyze color intensity [78]. |
| Linear Range | 5–40 µg/mL | Concentration range showing excellent linearity [78]. |
| Correlation | Consistent with HPLC | Results from commercial capsules agreed with standard HPLC method [78]. |
| Application | Drug content & dissolution testing | Successfully applied to pharmaceutical formulations [78]. |
Detailed Experimental Protocol
Materials and Reagents
- D-penicillamine (≥99.0%, Sigma-Aldrich) and D-penicillamine disulfide [78].
- Ellman's reagent (DTNB) from Sigma-Aldrich [78].
- Carbonate-bicarbonate buffer (pH 9.4) or phosphate-buffered saline (PBS, pH 7.4) for coating [4].
- Microplate: 96-well polystyrene assay plate (clear, flat-bottom) [4].
- Smartphone: iPhone 5s was used in the study, but modern smartphones with superior cameras are also suitable [78].
Assay Workflow and Procedure
The following diagram illustrates the core workflow of the smartphone-based colorimetric assay.
- Sample and Reagent Preparation: Prepare standard solutions of D-penicillamine in the concentration range of 5–40 µg/mL using an appropriate buffer. For environmental water samples, filtration and dilution may be necessary to fit within the assay's linear range and minimize matrix interference [78].
- Colorimetric Reaction:
- Pipette 100 µL of each standard or prepared sample into individual wells of a 96-well microplate.
- Add 100 µL of Ellman's reagent solution to each well.
- Incubate the plate at room temperature to allow for the development of the yellow color. The incubation time should be optimized and kept consistent.
- Image Acquisition:
- Place the microplate on a uniform white light source (e.g., the screen of a tablet set to maximum brightness) within a dark box to minimize ambient light interference.
- Using a smartphone mounted on a stand, capture a top-view image of the entire microplate. Ensure the camera settings (focus, exposure, white balance) are consistent and set to manual mode if possible.
- Image and Data Analysis:
- Transfer the image to a computer or use an on-device application for analysis.
- Using image analysis software (e.g., ImageJ or a custom app), select each well and extract the average Red, Green, and Blue (RGB) pixel intensity values (on a scale of 0-255) [78].
- The Blue (B) channel intensity, being the complementary color to yellow, shows an exponential decrease with increasing analyte concentration. Therefore, the logarithm of the blue channel intensity (log(B)) is used for the calibration curve [78].
- Quantification:
- Plot log(B) versus the concentration of the D-penicillamine standards to generate a linear calibration curve.
- Use the equation of the calibration curve to calculate the concentration of D-penicillamine in the unknown water samples.
Protocol: General Workflow for Smartphone-Based Sandwich ELISA on a Chip
While the D-penicillamine case used a direct colorimetric reaction, the sandwich ELISA is a more common and highly sensitive format for detecting proteins and larger molecules. Recent advances in microfluidics have enabled the full automation of this multi-step protocol on a single, compact chip. The following protocol is adapted from a 3D-printed capillaric chip designed for detecting the SARS-CoV-2 nucleocapsid protein, showcasing a format that can be adapted for other protein-based pharmaceutical contaminants [31].
Detailed Experimental Protocol
Key Research Reagent Solutions
Table 2: Essential Materials for Microfluidic Sandwich ELISA
| Reagent/Material | Function | Example & Notes |
|---|---|---|
| Capture Antibody | Immobilized on solid phase to specifically bind the target analyte. | Target-specific monoclonal antibody immobilized on a nitrocellulose membrane within the chip [31]. |
| Detection Antibody | Binds to a different epitope on the captured analyte. | Biotinylated target-specific antibody; provides specificity for the second binding step [31]. |
| Enzyme Conjugate | Produces a detectable signal. | Streptavidin-poly-HRP (Horseradish Peroxidase); binds to the biotin on the detection antibody [31]. |
| Colorimetric Substrate | Converted by the enzyme to a colored precipitate. | TMB (3,3',5,5'-Tetramethylbenzidine) or other precipitating substrates for HRP; forms a visible line [31]. |
| Washing Buffer | Removes unbound reagents to reduce background. | PBS or Tris buffer with 0.05-0.1% Tween 20 [31]. |
| Blocking Buffer | Covers non-specific binding sites on the surface. | Proteins like BSA or casein in a buffer solution [4]. |
| Microfluidic Chip | Automates fluid handling and houses the assay. | 3D-printed capillaric circuit with pre-stored reagents and a capillary pump [31]. |
Microfluidic ELISA-on-a-Chip Workflow
The following diagram outlines the fluidic steps and signaling pathway autonomously executed by the capillaric chip.
- Chip Loading:
- Using a disposable pipette, the user loads the sample (e.g., 210 µL of filtered water), biotinylated detection antibody, enzyme conjugate, substrate, and washing buffer into their respective large inlet reservoirs on the chip [31].
- Autonomous Aliquoting:
- Capillary action draws each solution into a dedicated measuring reservoir of a specific volume (e.g., 70 µL for detection antibody, 50 µL for enzyme conjugate). An integrated capillaric aliquoting circuit (CAC) automatically drains any excess liquid, creating highly precise aliquots (>93% accuracy) without user intervention [31].
- Assay Module Connection:
- The user physically "click-connects" the assay module, which contains a nitrocellulose membrane strip patterned with capture antibodies, to the main chip. This action fluidically connects the system and triggers the start of the automated assay sequence [31].
- Automated Sequential Flow and Incubation:
- A Microfluidic Chain Reaction (MCR), powered by capillary forces and controlled by capillary domino valves, initiates the timed, step-by-step delivery of all solutions [31]. The sequence, which preserves critical washing steps, is as follows:
- Sample flows over the capture antibody line, incubating for a pre-set time to allow the target pharmaceutical to bind.
- Wash Buffer flows through to remove unbound substances.
- Biotinylated Detection Antibody is delivered and binds to the captured target, forming the "sandwich".
- Wash Buffer flows through again.
- Streptavidin-poly-HRP Enzyme Conjugate is introduced and binds to the biotin on the detection antibody.
- Wash Buffer performs a final rinse.
- Colorimetric Substrate flows over the line. The HRP enzyme converts the substrate into an insoluble colored precipitate that deposits on the line.
- A Microfluidic Chain Reaction (MCR), powered by capillary forces and controlled by capillary domino valves, initiates the timed, step-by-step delivery of all solutions [31]. The sequence, which preserves critical washing steps, is as follows:
- Signal Detection and Readout:
- The intensity of the colored line is proportional to the concentration of the target analyte. The entire assay is completed in approximately 1.5 hours [31].
- The smartphone camera, potentially housed in a 3D-printed accessory to ensure consistent positioning and lighting, captures an image of the nitrocellulose strip [3].
- A dedicated smartphone application analyzes the image, quantifying the line intensity and converting it into a quantitative concentration value using a pre-loaded calibration curve. This system achieved a limit of detection (LOD) of 54 pg/mL for the SARS-CoV-2 nucleocapsid protein in buffer, demonstrating exceptional sensitivity [31].
The integration of enzyme-linked immunosorbent assay (ELISA) with smartphone-based microfluidic chips presents a transformative approach for the decentralized monitoring of pharmaceutical contaminants in water. This paradigm aims to deliver point-of-care testing (POCT) that is rapid, cost-effective, and accessible for field use [79]. Despite significant advances, the path to robust, reliable, and widely deployable systems is fraught with challenges. Key constraints include the inherent limitations of smartphone imaging sensors, the complexity of automating multi-step ELISA protocols on a miniaturized platform, and the difficulty of achieving laboratory-level sensitivity and specificity in complex environmental matrices like water [27] [3]. This document outlines the principal technological hurdles and provides detailed experimental protocols and reagent solutions aimed at addressing these constraints, specifically within the context of pharmaceutical detection in water research.
Key Technological Constraints and Analysis
The development of smartphone-based ELISA for pharmaceutical detection faces several interconnected constraints. The quantitative summary of these challenges is presented in the table below.
Table 1: Key Constraints of Smartphone-based ELISA for Pharmaceutical Detection in Water
| Constraint Category | Specific Challenge | Impact on Performance | Potential Mitigation Strategy |
|---|---|---|---|
| Imaging & Signal Acquisition | Low signal-to-noise ratio; auto-exposure/white balance instability [27] | Large errors in colorimetric signal quantification; misclassification of results | Use of controlled lighting chambers; computational color stabilization algorithms [3] |
| Limited camera resolution and sensitivity [79] | Reduced ability to detect faint colorimetric changes, raising the limit of detection (LOD) | Signal enhancement using immunomagnetic beads or enzymatic silver deposition [27] [21] | |
| Fluidic Control & Automation | Complexity of multi-step fluid handling (washing, reagent addition) [20] | User error; poor reproducibility; limits full automation in field settings | Integrated electrolytic pumps [21]; capillary-driven flow [3]; rotational "merry-go-round" mechanisms [20] |
| Incompatibility with large sample volumes needed for trace analytes [73] | Failure to meet the low LOD required for pharmaceuticals in water (ng/L to µg/L) | On-chip preconcentration methods (e.g., magnetic separation, filtration) [73] | |
| Assay Sensitivity & Specificity | Matrix interference from complex water samples [73] | False positives/negatives; reduced assay accuracy and reliability | Sample pre-filtration; use of high-affinity capture agents like nanobodies [2] [80] |
| Inefficient biomarker capture and reaction kinetics on-chip | Longer assay times; lower sensitivity compared to bench-top ELISA | 3D-printed chips with micropillar arrays to increase surface area [2] [80] | |
| System Integration & Usability | Dependence on bulky peripheral equipment [21] | Reduced portability and true point-of-care application | Design of self-contained, 3D-printed accessories powered by the smartphone itself [21] [3] |
| Need for specialized, high-cost reagents | Limits deployment in resource-limited settings | Development of reusable microfluidic chips [2] [80] and stable reagent formulations |
Detailed Experimental Protocols for Overcoming Constraints
Protocol 1: Scattering-Enhanced Photometric Detection for Signal Amplification
This protocol details a method to overcome smartphone camera inaccuracy by using immunomagnetic beads (IMBs) to enhance light scattering, thereby improving the signal for photometric detection [27].
1. Reagent Preparation:
- Immunomagnetic Beads (IMBs): Use Fe₂O₃-polystyrene core-shell IMBs (e.g., 450 nm diameter, 1:5 core-shell ratio) as determined by Mie theory simulations for optimal scattering at 450 nm wavelength [27].
- Pharmaceutical Capture Agent: Covalently conjugate antibodies specific to the target pharmaceutical (e.g., a specific antibiotic) to the IMB surface using standard EDC-NHS chemistry.
- ELISA Reagents: Prepare standard solutions of the target pharmaceutical, enzyme-linked detection antibodies (e.g., HRP-conjugated), and appropriate chromogenic substrates (e.g., TMB).
2. Microfluidic Chip Fabrication:
- Design a chip with a serpentine channel that incorporates a mixing zone for the sample and IMBs.
- Fabricate the chip using polydimethylsiloxane (PDMS) via soft lithography or employ projection micro-stereolithography (PμSL) 3D printing for higher resolution features [2] [80].
- Integrate a miniaturized LED light source (450 nm) and a simple optical path that directs light through the detection chamber and onto the smartphone CMOS sensor.
3. Assay Workflow:
- Step 1: Inject the water sample and IMBs into the chip. Incubate with mixing to allow the target pharmaceutical to bind to the IMBs.
- Step 2: Apply a magnetic field to wash the IMBs, removing unbound matrix components.
- Step 3: Introduce the enzyme-linked detection antibody. Incubate and wash again.
- Step 4: Add the chromogenic substrate. The enzymatic reaction produces a color change.
- Step 5: Illuminate the detection chamber with the 450 nm LED. The smartphone camera captures the image of the IMB-product complex. The IMBs scatter the light, enhancing the absorbance signal captured by the phone.
4. Data Analysis:
- A dedicated smartphone application converts the image to a grayscale value.
- The app uses a pre-calibrated absorbance error compensation model, which accounts for the scattering parameters of the IMBs, to convert the grayscale value into an accurate analyte concentration [27].
Protocol 2: Automated, Pump-Free Fluidic Control Using a Rotational System
This protocol describes an automated fluid handling system inspired by a "merry-go-round" to overcome the hurdle of manual, multi-step fluidic operations, which is critical for complex ELISA procedures [20].
1. System Setup:
- Hardware: Construct a hand-sized, battery-powered device with a rotating disc that holds reagent reservoirs. The disc is driven by a simple gear mechanism and solenoids that control the up-and-down movement of pipetting heads.
- Chip Design: Use a paper-based ELISA (p-ELISA) chip. The chip features a multi-layered design with amine-functionalized cellulose paper discs for covalent antibody immobilization, a reaction chamber, and a one-way surge layer for efficient waste absorption [20].
- Control Interface: Develop a smartphone app with voice recognition or touch controls to command the rotational and dispensing actions via Bluetooth.
2. Assay Workflow:
- Step 1: Load the water sample (pre-treated if necessary) and all reagents (wash buffer, detection antibody, substrate) into their designated reservoirs on the rotational platform.
- Step 2: Initiate the assay via a voice command to the smartphone app (e.g., "Start ELISA").
- Step 3: The system automatically executes the following sequence:
- The disc rotates to align the sample reservoir with the pipetting head.
- The solenoid lowers the head, dispensing the sample onto the p-ELISA chip.
- After a programmed incubation, the disc rotates to a wash buffer reservoir, which is dispensed to wash the chip.
- The process repeats sequentially for the detection antibody and the substrate solution.
- Step 4: After the final colorimetric reaction, the smartphone camera captures an image of the p-ELISA chip for analysis.
3. Data Analysis:
- The smartphone app performs RGB analysis on the image of the reaction zone.
- The intensity of the color change is correlated with the pharmaceutical concentration using a pre-loaded calibration curve, providing a semi-quantitative result.
Visualization of System Integration and Workflow
The following diagram illustrates the core components and workflow of an integrated smartphone-based microfluidic ELISA system for pharmaceutical detection in water.
The Scientist's Toolkit: Essential Research Reagents and Materials
Successful development of a smartphone-based ELISA platform requires careful selection of reagents and materials. The following table lists key components and their critical functions in the analytical process.
Table 2: Essential Research Reagent Solutions for Platform Development
| Item | Function/Description | Key Consideration for Pharmaceutical Detection in Water |
|---|---|---|
| Immunomagnetic Beads (IMBs) | Solid-phase carrier for target capture and separation; enhances light scattering for signal amplification [27]. | Core-shell material (e.g., Fe₂O₃-polystyrene) and size must be optimized for scattering efficiency and binding capacity. |
| High-Affinity Capture Agents | Antibodies or nanobodies that specifically bind to the target pharmaceutical. Nanobodies offer high stability and specificity [2] [80]. | Affinity and cross-reactivity must be characterized against common water matrix interferents and pharmaceutical metabolites. |
| 3D-Printed Microfluidic Chip | Platform that houses the assay. PμSL printing allows for integrated micropillar arrays to increase surface area for immobilization [2] [80]. | Chip material must be compatible with organic solvents and have low non-specific binding to prevent analyte loss. |
| Enzyme-Substrate System | Generates the detectable signal. HRP with TMB is common for colorimetric detection. | The enzyme must remain stable under field conditions. The substrate reaction should produce a strong, stable color change. |
| Portable Signal Acquisition Box | A 3D-printed accessory that holds the phone, chip, and controlled LED lighting, minimizing ambient light variability [3]. | Design must ensure consistent distance and alignment between the LED, detection chamber, and phone camera for reproducibility. |
The constraints facing smartphone-based ELISA for pharmaceutical detection in water—spanning imaging, fluidics, assay sensitivity, and system integration—are significant but not insurmountable. The experimental protocols and reagent solutions detailed herein provide a concrete roadmap for researchers to address these hurdles. By leveraging technological innovations such as scattering-enhanced detection, pump-free automation, advanced nanobodies, and integrated 3D-printed designs, the vision of a deployable, sensitive, and user-friendly platform for monitoring water quality can be realized. Future work must focus on the rigorous validation of these systems with real environmental samples and a push towards standardization to ensure reliability and acceptance in the field.
The convergence of biosensing, microfluidics, and artificial intelligence (AI) is revolutionizing environmental monitoring, particularly for the detection of pharmaceutical contaminants in water. Traditional laboratory methods, such as high-performance liquid chromatography (HPLC) and liquid chromatography tandem mass spectrometry (LC-MS/MS), though highly precise, are time-consuming, require sophisticated equipment, and are unsuitable for rapid, on-site analysis [81]. Smartphone-based enzyme-linked immunosorbent assays (ELISAs) on microfluidic chips represent a transformative alternative, offering portability, cost-effectiveness, and the potential for real-time, decentralized testing [17].
This evolution is being accelerated by three key technological frontiers: the integration of AI for data analysis and system autonomy, the development of sophisticated multiplexing capabilities for simultaneous multi-analyte detection, and the advent of novel biosensor technologies with ultra-high sensitivity. These advancements are transitioning the "lab-on-a-chip" concept into an intelligent, field-deployable "expert-in-a-pocket" system. This article details the application notes and experimental protocols that underpin these innovations, providing researchers and drug development professionals with the tools to implement next-generation biosensing for pharmaceutical detection in water.
Technological Foundations and Enhanced Detection Modalities
The core of next-generation biosensing lies in moving beyond traditional colorimetric detection. While conventional ELISA provides a robust framework, its limitations in sensitivity and quantification are being overcome by advanced signal detection methods.
Table 1: Advanced Detection Modalities for Smartphone-Based ELISA
| Detection Method | Principle | Advantages for Pharmaceutical Detection | Reported Sensitivity (Example) |
|---|---|---|---|
| Chemiluminescence | Measurement of light emitted from a chemical reaction. | High sensitivity, wide dynamic range, low background signal [82]. | Sub-femtomolar detection limits for biomarkers [82]. |
| Electrochemiluminescence | Light emission triggered by an electrochemical reaction. | Exceptional sensitivity and quantification, ideal for multiplexing [82]. | Key driver for ultra-sensitive, quantitative assays [82]. |
| Fluorescence | Measurement of light emitted by a fluorophore after excitation. | High sensitivity, compatible with various labels and multiplexing [83]. | Detection of hepatitis B virus DNA down to 50 fM [83]. |
| Surface-Enhanced Raman Scattering (SERS) | Massive enhancement of Raman signal by noble metal nanostructures. | Provides unique molecular "fingerprints," minimal background, high multiplexing potential [84]. | Enables discrimination of diseases with overlapping symptoms [84]. |
These modalities are significantly enhanced by nanotechnology. Noble metal nanoparticles, such as gold and silver, exhibit localized surface plasmon resonance (LSPR), which can amplify optical signals through effects like metal-enhanced fluorescence (MEF), thereby dramatically improving the signal-to-noise ratio and detection sensitivity [83].
Protocol 1: Implementing a Magnetic Bead-Based Proximity Extension Assay (MagPEA) for Ultra-Sensitive Detection
The MagPEA platform combines the specificity of immunoassays with the sensitivity of nucleic acid amplification, achieving detection limits that are orders of magnitude lower than standard ELISA [85]. This protocol is adapted for detecting low-abundance pharmaceuticals in water samples.
Research Reagent Solutions
Table 2: Essential Reagents for MagPEA-POCT
| Item | Function | Specification/Example |
|---|---|---|
| Carboxyl-Functionalized Magnetic Beads | Solid-phase support for antibody immobilization and target capture/enrichment. | Dynabeads MyOne (Cat# 65011) [85]. |
| Sulfo-SMCC Crosslinker | Facilitates covalent conjugation between antibodies and oligonucleotide probes. | Sulfosuccinimidyl 4-(N-maleimidomethyl) cyclohexane-1-carboxylate [85]. |
| Oligonucleotide-Labeled Detection Antibodies | Bind target analyte; their proximity enables DNA polymerization to form a unique barcode. | Antibodies conjugated via thiol-maleimide chemistry [85]. |
| DNA Polymerase & dNTPs | Generates a unique, amplifiable DNA barcode from proximity-bound antibody pairs. | - |
| qPCR Master Mix | Amplifies and quantifies the DNA barcode for final readout. | Compatible with portable thermal cyclers [85]. |
| Disposable Microfluidic Cartridge | Integrates all fluidic handling, reactions, and washing steps automatically. | Contains pre-stored reagents for a "sample-in, answer-out" workflow [85]. |
Experimental Workflow
The following diagram illustrates the integrated MagPEA-POCT workflow, from sample input to result output.
Step-by-Step Protocol:
Chip Priming: Load the disposable microfluidic cartridge into the portable analyzer. The cartridge contains all necessary pre-stored reagents, including magnetic beads conjugated with capture antibodies and oligonucleotide-labeled detection antibodies [85].
Sample Introduction: Inject the prepared water sample (e.g., 50-100 µL) into the designated sample inlet on the cartridge. The system's magneto-fluidic manipulations will automatically draw the sample into the reaction chamber [85].
Target Capture and Proximity Extension:
- The target pharmaceutical analyte in the sample is captured by the antibody-coated magnetic beads.
- Two oligonucleotide-labeled detection antibodies bind to adjacent epitopes on the same target molecule, bringing their DNA strands into proximity.
- A DNA polymerase extends one oligonucleotide using the other as a template, generating a unique, double-stranded DNA barcode specific to the target analyte [85].
Magnetic Washing: The portable analyzer uses integrated magnets to immobilize the magnetic beads while performing multiple wash steps. This critical process removes unbound detection antibodies and other matrix components, drastically reducing non-specific background signals [85].
On-Chip qPCR Amplification and Detection: The synthesized DNA barcode is eluted and transferred to the on-chip qPCR chamber. The compact thermal cycler amplifies the barcode, and a multi-channel optical detector (e.g., fluorescence) monitors the reaction in real-time [85].
Smartphone Data Analysis: The smartphone application, connected to the analyzer via USB, controls the assay and collects the raw qPCR data. The integrated AI-driven software automatically performs baseline correction, threshold cycle (Ct) determination, and quantifies the target concentration based on a pre-loaded standard curve. The final result is displayed on the smartphone screen within 90 minutes of sample injection [85].
The Multiplexing Frontier: Simultaneous Multi-Pharmaceutical Analysis
Diagnosing water contamination often requires detecting multiple pharmaceuticals simultaneously, as they rarely occur in isolation. Multiplexed biosensing addresses this by enabling the parallel quantification of several analytes from a single, small-volume sample [83].
Strategies for Multiplexing
Spatial Multiplexing: This common approach uses an array of distinct detection zones on a microfluidic chip or paper-based device. Each zone is functionalized with a different capture element (antibody or aptamer) specific to a particular pharmaceutical. The smartphone camera captures the signal (colorimetric, fluorescent) from all zones simultaneously for analysis [17].
Spectral Multiplexing: This strategy uses multiple signaling labels with distinct optical properties, such as fluorescent dyes or SERS nanotags with different emission spectra. These are combined in a single reaction chamber, and the smartphone-based reader, coupled with spectral unmixing algorithms, deconvolutes the combined signal to quantify each analyte [83] [86].
Reagentless Multiplex SERS-biosensors: Emerging platforms use reagentless sensors designed for different targets in a one-pot assay. While spectra may overlap, machine learning models like Partial Least Squares Regression (PLSR) are key to independently quantifying each target in the mixture, as demonstrated for respiratory virus discrimination [84].
The following diagram outlines the logical workflow for developing and deploying a multiplexed biosensing assay.
Protocol 2: AI-Powered Spectral Unmixing for Multiplexed SERS Detection
SERS biosensors are ideal for multiplexing due to their narrow, fingerprint-like spectra. However, resolving overlapping signals from multiple tags requires sophisticated data analysis.
Research Reagent Solutions
- SERS Nanotags: Gold or silver nanoparticles encoded with unique Raman reporters (e.g., DTNB, 4-MBA, etc.) and functionalized with target-specific aptamers [83] [84].
- Microfluidic Mixing Chip: A chip designed to efficiently mix the water sample with the SERS nanotag mixture.
- Portable SERS Reader: A compact spectrometer that can be interfaced with a smartphone for spectral acquisition.
Experimental Workflow
Assay Setup: Incubate the pre-processed water sample with a mixture of SERS nanotags, each specific to a different target pharmaceutical. This can be done in a vial or directly within a microfluidic channel.
Spectral Acquisition: After incubation, flow the mixture through a detection cell or focus the smartphone-integrated SERS reader's laser onto the mixture. Collect the combined SERS spectrum.
AI-Driven Spectral Unmixing:
- Data Preprocessing: Smooth the raw spectrum and perform baseline correction.
- Machine Learning Model Application: Input the preprocessed spectrum into a pre-trained model, such as Partial Least Squares Regression (PLSR). The PLSR model has been trained on the pure spectra of each individual SERS nanotag and can predict the contribution (and thus concentration) of each tag in the unknown mixture [84].
- Result Interpretation: The model outputs the quantified concentration for each pharmaceutical target simultaneously.
Integration with AI and Autonomous Systems
AI integration is the cornerstone of next-generation biosensors, moving beyond simple data analysis to enable predictive and autonomous operations.
Intelligent Data Analysis: AI and machine learning algorithms are crucial for resolving complex datasets from multiplexed sensors [87] [84]. This includes spectral unmixing in SERS [84], analyzing cellular dynamics from multiplexed fluorescent biosensors [86], and classifying images from lateral flow assays with higher accuracy than the human eye.
Predictive Analytics and Autonomous Networks: In a broader environmental context, AI-driven biosensor networks can shift from reactive to prescriptive monitoring. As demonstrated in telecommunications, AI can use consolidated data to predict potential system failures or contamination events [88]. Translated to water monitoring, an AI could analyze continuous pharmaceutical detection data alongside other parameters, predict contamination trends, and automatically trigger alerts or mitigation protocols.
The architecture of such an intelligent, networked biosensing system is depicted below.
The integration of AI, multiplexing, and emerging biosensor technologies is paving the road ahead for smartphone-based ELISA, transforming it from a simple portable test into a powerful, intelligent diagnostic platform. The protocols outlined for MagPEA and AI-powered SERS multiplexing provide a tangible roadmap for researchers to achieve unprecedented sensitivity and multi-analyte capability in detecting pharmaceuticals in water.
Future developments will focus on further miniaturization and energy efficiency, the discovery of more robust recognition elements like aptamers and molecularly imprinted polymers (MIPs) to enhance stability and reduce costs [81], and the creation of large-scale, autonomous sensor networks. The convergence of these technologies promises a future where comprehensive water quality assessment is continuous, ubiquitous, and intelligent, ultimately leading to faster responses to environmental contamination and better protection of public health.
Conclusion
The integration of smartphone technology with microfluidic ELISA presents a paradigm shift for environmental monitoring, offering a powerful, accessible, and decentralized approach to detecting pharmaceutical contaminants in water. This synthesis has detailed a path from foundational principles through to validated application, demonstrating that these systems can achieve rapid, sensitive, and quantitative analysis critical for public and environmental health. Key takeaways include the demonstrated feasibility of sub-one-hour analyses with minimal sample volumes, the critical role of chip design and smartphone image analysis in performance, and the successful validation of these platforms against gold-standard methods. For researchers and professionals, the future direction is clear: advancing towards multiplexed detection of multiple pharmaceutical classes, integrating machine learning for smarter data interpretation, and fostering the development of truly automated, field-ready devices. This technology is poised to move from innovative prototypes to essential tools in the global effort to ensure water safety.
References
- 1. Cost analysis of ELISA , solid-phase extraction, and solid-phase... [https://pubmed.ncbi.nlm.nih.gov/15721895/]
- 2. Combining nanobody generation platform, 3D-printed ... [https://www.sciencedirect.com/science/article/pii/S0956566325008486]
- 3. Smartphone-based platforms implementing microfluidic ... [https://www.nature.com/articles/s41467-023-36017-x]
- 4. ELISA Assay Technique | Thermo Fisher Scientific - US [https://www.thermofisher.com/us/en/home/life-science/protein-biology/protein-biology-learning-center/protein-biology-resource-library/pierce-protein-methods/overview-elisa.html]
- 5. In-cell ELISA protocol [https://www.abcam.com/en-us/technical-resources/protocols/in-cell-elisa]
- 6. How to Analyze ELISA Data and Calculate Results [https://www.bosterbio.com/blog/post/how-to-analyze-elisa-data-and-calculate-results-step-by-step-guide-with-troubleshooting-tips?srsltid=AfmBOoq0ZjOZYHPwG8BGeUwHm2alVCn1LtzfmILVMBsU48jHPyH-ck05]
- 7. Data analysis for ELISA [https://www.abcam.com/en-us/technical-resources/guides/elisa-guide/calculating-elisa-data]
- 8. Comparative Analysis of Manual ELISA and Ella ... [https://pmc.ncbi.nlm.nih.gov/articles/PMC12523246/]
- 9. Fully integrated rapid microfluidic device translated from conventional 96-well ELISA kit | Scientific Reports [https://www.nature.com/articles/s41598-021-81433-y]
- 10. Implementation of Microfluidic Sandwich ELISA for Superior Detection of Plant Pathogens | PLOS One [https://journals.plos.org/plosone/article?id=10.1371/journal.pone.0083231]
- 11. Performance evaluation of microfluidic microplate-based ... [https://www.nature.com/articles/s41598-024-67977-9]
- 12. Development of microfluidic ELISA for measuring humoral ... [https://www.sciencedirect.com/science/article/pii/S0022175925001000]
- 13. A Microfluidic Paper-Based Lateral Flow Device for Quantitative ELISA [https://www.mdpi.com/2673-8023/4/2/22]
- 14. Automated, Deep Learning-Enabled Immunoassay Microfluidic Cartridge for Viral Pathogen Detection - PubMed [https://pubmed.ncbi.nlm.nih.gov/41050614/]
- 15. An All-in-One Sustainable Smartphone Paper Biosensor for ... [https://pmc.ncbi.nlm.nih.gov/articles/PMC12392259/]
- 16. Smartphones as a platform for molecular analysis [https://pubs.rsc.org/en/content/articlehtml/2025/lc/d4lc00966e]
- 17. Microfluidic Sensors Integrated with Smartphones for ... [https://pmc.ncbi.nlm.nih.gov/articles/PMC12298308/]
- 18. Recent Advances in Smart Phone-Based Biosensors for ... [https://www.mdpi.com/2227-9040/13/7/221]
- 19. Smartphone Application Processor Market Share Q1 2025 [https://www.techinsights.com/blog/narrative-smartphone-application-processor-market-share-q1-2025]
- 20. Development of a merry-go-round inspired automatic ... [https://www.sciencedirect.com/science/article/abs/pii/S0925400525013073]
- 21. Smartphone-interfaced lab-on-a-chip devices for field- ... [https://pmc.ncbi.nlm.nih.gov/articles/PMC4241779/]
- 22. A smartphone-integrated paper-based colorimetric sensor ... [https://www.sciencedirect.com/science/article/abs/pii/S003991402500520X]
- 23. Pilot study: a low-cost, point-of-care microfluidic chip for ... [https://link.springer.com/article/10.1007/s42452-025-06859-9]
- 24. Low-cost and sustainable smartphone-based tissue-on- ... [https://www.sciencedirect.com/science/article/pii/S0956566324004597]
- 25. Real-Time, Continuous Monitoring of Tissue Chips as an ... [https://www.mdpi.com/1424-8220/25/16/5153]
- 26. A smartphone serves as a data logger for a fully automated ... [https://pmc.ncbi.nlm.nih.gov/articles/PMC10837093/]
- 27. A portable microfluidic photometric detection method ... [https://www.sciencedirect.com/science/article/abs/pii/S0956566323007364]
- 28. Diagnostic Testing Market 2025 Driven by Early Diagnosis [https://www.towardshealthcare.com/insights/diagnostic-testing-market-sizing]
- 29. Diagnostic Labs Market Research and Forecast 2025-2030 [https://finance.yahoo.com/news/diagnostic-labs-market-research-forecast-100800370.html]
- 30. Next-Generation Cancer Diagnostics Market Size Worth ... [https://www.biospace.com/press-releases/next-generation-cancer-diagnostics-market-size-worth-usd-38-36-billion-by-2034]
- 31. 3D-printed capillaric ELISA-on-a-chip with aliquoting [https://pubs.rsc.org/en/content/articlehtml/2023/lc/d2lc00878e]
- 32. Development of an automated on-chip bead-based ELISA ... [https://pmc.ncbi.nlm.nih.gov/articles/PMC4627716/]
- 33. Lab on chip for medical and clinical applications [https://pubs.rsc.org/en/content/articlehtml/2025/sd/d5sd00096c]
- 34. Microfluidics chips fabrication techniques comparison [https://www.nature.com/articles/s41598-024-80332-2]
- 35. The application of microfluidic technology in allergen ... [https://pmc.ncbi.nlm.nih.gov/articles/PMC12150919/]
- 36. Polymer Microfluidic Chips for Pharmaceuticals Growth ... [https://www.marketreportanalytics.com/reports/polymer-microfluidic-chips-for-pharmaceuticals-376990]
- 37. A Review on 3D-Printed Miniaturized Devices for Point-of ... [https://pmc.ncbi.nlm.nih.gov/articles/PMC12191180/]
- 38. An open source platform to automate the design ... [https://www.nature.com/articles/s41598-025-15976-9]
- 39. advances in low-cost 3D printing for laboratory automation [https://pubs.rsc.org/en/content/articlehtml/2025/dd/d4dd00411f]
- 40. An integrated microfluidic device driven by an automated ... [https://www.sciencedirect.com/science/article/abs/pii/S0924424725002808]
- 41. Straight Channel Chip - Various channel depths Fluidic 625 [https://darwin-microfluidics.com/products/straight-channel-chip-various-channel-depths-fluidic-625/?srsltid=AfmBOopNZJnkkJsgQ0a7KElHWzCX186zlLr6ARhahOa_BjP9c3UAkvKK]
- 42. Accessible Telemedicine Diagnostics with ELISA in a 3D ... [https://pmc.ncbi.nlm.nih.gov/articles/PMC7158886/]
- 43. Antibody Tools for Target Identification and Validation [https://www.rapidnovor.com/antibody-tools-for-target-id-and-validation/]
- 44. The assay design used for measurement of therapeutic ... [https://pmc.ncbi.nlm.nih.gov/articles/PMC3499303/]
- 45. ELISA Development and Optimization [https://www.thermofisher.com/us/en/home/life-science/protein-biology/protein-biology-learning-center/protein-biology-resource-library/pierce-protein-methods/overview-elisa/elisa-development-optimization.html]
- 46. Coupling ELISA to smartphones for POCT of chronic and ... [https://www.sciencedirect.com/science/article/abs/pii/S0039914022010426]
- 47. Smartphone instrument for portable enzyme-linked ... [https://pmc.ncbi.nlm.nih.gov/articles/PMC4242018/]
- 48. How to Analyze ELISA Data and Calculate Results [https://www.bosterbio.com/blog/post/how-to-analyze-elisa-data-and-calculate-results-step-by-step-guide-with-troubleshooting-tips?srsltid=AfmBOor-DolQ1hh_SW1BwVD-KVFfaGCYlKV2snU_4llhOgQRNDNPTcYJ]
- 49. Quantitative Image Analysis - an overview [https://www.sciencedirect.com/topics/computer-science/quantitative-image-analysis]
- 50. Limit of detection and limit of quantification development ... [https://pmc.ncbi.nlm.nih.gov/articles/PMC3630005/]
- 51. Comprehensive review of emerging contaminants [https://www.sciencedirect.com/science/article/pii/S0147651324004962]
- 52. A fully automated paper-based smartphone-assisted ... [https://www.sciencedirect.com/science/article/abs/pii/S0003267025004076]
- 53. Advanced Strategies to Improve Detection Limits in ... [https://www.organomation.com/advanced-strategies-to-improve-detection-limits-in-chromatography-mass-spectrometry]
- 54. Recent Advances in Microfluidics-Based Monitoring of ... [https://www.mdpi.com/2072-666X/16/4/462]
- 55. Enhancing ELISA Sensitivity: From Surface Engineering to ... [https://pmc.ncbi.nlm.nih.gov/articles/PMC12293621/]
- 56. How to deal with high background in ELISA [https://www.abcam.com/en-us/technical-resources/troubleshooting/high-background-elisa]
- 57. How to Reduce Background Noise in ELISA Assays [https://synapse.patsnap.com/article/how-to-reduce-background-noise-in-elisa-assays]
- 58. ELISA Guide; Part 2: The ELISA Protocol [https://www.jacksonimmuno.com/secondary-antibody-resource/immuno-techniques/elisa-guide-part-2/]
- 59. Sandwich ELISA protocol [https://www.abcam.com/en-us/technical-resources/protocols/sandwich-elisa]
- 60. Microchip-based ELISA strategy for the detection of low- ... [https://www.sciencedirect.com/science/article/abs/pii/S0003267009008319]
- 61. ELISA optimization tips [https://www.berthold.com/en-us/bioanalytics/applications/elisa/optimization-tips/]
- 62. Incubation Times in Environmental Monitoring [https://www.bioprocessintl.com/qa-qc/a-case-study-in-environmental-monitoring-reviewing-incubation-times-upon-recovery-of-microorganisms]
- 63. Microfluidic ELISA Employing an Enzyme Substrate and ... [https://pmc.ncbi.nlm.nih.gov/articles/PMC5929976/]
- 64. A review of their detection and effects in the ecosystem [https://www.sciencedirect.com/science/article/pii/S0043135424015562]
- 65. Tracing Pharmaceuticals in Water Systems [https://pmc.ncbi.nlm.nih.gov/articles/PMC11586952/]
- 66. Why is ELISA lot-to-lot Reproducibility Critical for your Research? - Enzo [https://www.enzo.com/note/why-is-elisa-lot-to-lot-reproducibility-critical-for-your-research/]
- 67. ELISA Kit Lot-to-Lot Reproducibility [https://blog.cellsignal.com/elisa-kit-lot-to-lot-reproducibility]
- 68. An overview of ELISA: a review and update on best laboratory ... [https://pmc.ncbi.nlm.nih.gov/articles/PMC11808753/]
- 69. Unitech EA630Plus Rugged Smartphone │ ... [https://www.ute.com/us/products/detail/EA630Plus]
- 70. Tablets, Handhelds, Rugged Industrial Smartphones [https://www.ruggtek.com/en/]
- 71. A digital image colorimetry system based on smart devices ... [https://pmc.ncbi.nlm.nih.gov/articles/PMC10830485/]
- 72. Proof-of-Concept: Smartphone- and Cloud-Based Artificial ... [https://pmc.ncbi.nlm.nih.gov/articles/PMC10296264/]
- 73. Recent Advances in Microfluidics-Based Monitoring of ... [https://pmc.ncbi.nlm.nih.gov/articles/PMC12029729/]
- 74. How to Read and Analyze ELISA Data [https://www.rndsystems.com/resources/how-to-analyze-elisa-data]
- 75. Validation of HPLC and Enzyme-Linked Immunosorbent ... [https://pmc.ncbi.nlm.nih.gov/articles/PMC7278759/]
- 76. Comparative Evaluation of Three Commercial Elisa Kits ... [https://www.mdpi.com/2306-7381/9/3/104]
- 77. Comparison of ELISA and HPLC-MS methods for the ... [https://pmc.ncbi.nlm.nih.gov/articles/PMC6598173/]
- 78. Smartphone-based Ellman's colourimetric methods for the ... [https://www.sciencedirect.com/science/article/abs/pii/S0378517319300146]
- 79. Smartphone‐based clinical diagnostics - PubMed Central - NIH [https://pmc.ncbi.nlm.nih.gov/articles/PMC6334517/]
- 80. Combining nanobody generation platform, 3D-printed ... [https://pubmed.ncbi.nlm.nih.gov/40976104/]
- 81. a promising analytical tool for on-site detection of mycotoxins [https://www.nature.com/articles/s41538-025-00444-5]
- 82. Next-Generation ELISA (ELISA 2.0) Market Research ... [https://www.insightaceanalytic.com/report/next-generation-elisa-market/3241]
- 83. Multiplexed Optical Nanobiosensing Technologies for ... [https://pmc.ncbi.nlm.nih.gov/articles/PMC12562344/]
- 84. S2 - A Multiplexed SERS-biosensor Assay for the ... - SciX 2025 [https://scix2025.eventscribe.net/ajaxcalls/PresentationInfo.asp?PresentationID=1676287]
- 85. A Portable High-Sensitivity Multiplex Platform with ... [https://www.sciencedirect.com/science/article/abs/pii/S0956566325009479]
- 86. Decoding Molecular Network Dynamics in Cells: Advances ... [https://www.mdpi.com/2079-6374/15/9/614]
- 87. Exploring Biosensors: Distinctive Features and Emerging ... [https://www.sciencedirect.com/science/article/abs/pii/S0003269725002325]
- 88. Elisa Oyj and Google Cloud Expand Collaboration ... [https://www.googlecloudpresscorner.com/2025-06-17-Elisa-Oyj-and-Google-Cloud-Expand-Collaboration-to-Deliver-AI-Driven-Autonomous-Networks]