Smartphone-Integrated Lab-on-a-Chip Electrochemical Sensors for On-Site Drug Residue Analysis
This article explores the convergence of lab-on-a-chip (LoC) systems, electrochemical sensing, and smartphone technology for the rapid, on-site detection of drug residues.
Smartphone-Integrated Lab-on-a-Chip Electrochemical Sensors for On-Site Drug Residue Analysis
Abstract
This article explores the convergence of lab-on-a-chip (LoC) systems, electrochemical sensing, and smartphone technology for the rapid, on-site detection of drug residues. Aimed at researchers and drug development professionals, it covers the foundational principles of electrochemical biosensors and their components, details the methodology for building integrated smartphone-LoC platforms, addresses key optimization and troubleshooting challenges, and provides a comparative analysis of system performance against traditional techniques. The review synthesizes how these portable, cost-effective, and sensitive devices are poised to transform pharmaceutical monitoring, food safety, and clinical diagnostics by enabling decentralized, real-time analysis.
Core Principles and Components of LoC Electrochemical Sensors for Drug Detection
The global challenge of ensuring food safety and managing clinical drug use is intensifying due to the persistent issue of drug residues. These residues, originating from veterinary antibiotics, environmental contaminants, and improperly administered medications, pose significant threats to public health, including the development of antimicrobial resistance and toxic side effects. Traditional detection methods, while sensitive and reliable, are often confined to central laboratories, requiring sophisticated instrumentation, lengthy analysis times, and highly trained personnel, thus limiting their utility for rapid, on-site decision-making [1] [2].
This gap underscores the urgent need for portable, rapid, and cost-effective monitoring solutions. The convergence of Lab-on-a-Chip (LoC) microfluidics, advanced electrochemical sensing, and smartphone readout technology presents a transformative opportunity. These integrated systems automate complex laboratory procedures onto miniaturized platforms, enabling sensitive, specific, and quantitative detection of drug residues directly at the point of need—be it a farm, a food market, or a hospital bedside [1] [3]. This article details the performance benchmarks, application protocols, and core components of these emerging portable monitoring systems, framing them within a broader thesis on their potential to revolutionize drug residue surveillance.
Performance Comparison of Analytical Methods
The selection of a method for drug residue analysis involves a critical balance between sensitivity, portability, and operational complexity. Table 1 provides a comparative overview of traditional laboratory techniques versus modern portable sensing platforms.
Table 1: Comparison of Drug Residue Monitoring Methods
| Method | Typical Limit of Detection (LOD) | Analysis Time | Portability | Required Expertise | Key Applications |
|---|---|---|---|---|---|
| LC-MS/MS [4] | Low ng/g (ppb) to ppt | Hours to Days | Low | High | Regulatory compliance, confirmatory analysis |
| HPLC [5] | Similar to LC-MS/MS | Hours to Days | Low | High | Quantification of drug residues in various matrices |
| Conventional Immunoassay [6] | ~1 ng/cm² | 1-2 Hours | Medium | Medium | Screening for surface contamination (e.g., methotrexate) |
| Portable Electrochemical Sensor [5] [3] | ~46 nM (e.g., for CAP) | Minutes | High | Low to Medium | On-site screening of food, environmental, and clinical samples |
| Lateral Flow Immunoassay (LFIA) [6] | 0.93-4.65 ng/cm² | < 10 Minutes | High | Low | Rapid qualitative/quantitative screening for specific drugs |
Detailed Experimental Protocols for Portable Drug Residue Monitoring
This section outlines a standardized protocol for using a smartphone-integrated electrochemical LoC platform, drawing from validated research applications.
Protocol: On-Site Detection of Chloramphenicol using a Smartphone-Readout Electrochemical Sensor
This protocol is adapted from a study demonstrating the detection of the antibiotic chloramphenicol (CAP) in milk, water, and human serum [5].
1. Principle The assay is based on differential pulse voltammetry (DPV). A nanocomposite of graphene oxide and multi-walled carbon nanotubes (GO@MWCNT) coated on a screen-printed carbon electrode (SPCE) enhances the electrocatalytic reduction of CAP. The resulting current change is quantitatively measured by a portable potentiostat and transmitted via Bluetooth to a smartphone for analysis [5].
2. Apparatus and Reagents
- Portable Potentiostat: PalmSens EmStat Pico or MultiPalmSens4 with Bluetooth capability.
- Smartphone: Android or iOS device with dedicated app (e.g., PS Touch).
- Sensor Chips: Disposable SPCEs modified with GO@MWCNT nanocomposite.
- Standard Solutions: CAP stock solution (1 mM in methanol), phosphate buffer saline (PBS, 0.1 M, pH 7.4) as supporting electrolyte.
- Sample Vials and Micropipettes.
3. Procedure Step 1: Sample Preparation
- Milk: Dilute milk sample 1:5 with PBS and centrifuge at 10,000 rpm for 10 minutes. Use the supernatant for analysis.
- Water: Filter tap water through a 0.45 μm membrane and use directly.
- Blood Serum: Centrifuge whole blood at 3,500 rpm for 15 minutes; use the clear serum supernatant.
Step 2: System Setup and Calibration
- Insert a GO@MWCNT/SPCE sensor into the portable potentiostat's connector.
- Power on the potentiostat and pair it with the smartphone via Bluetooth.
- Launch the application on the smartphone and select the DPV method with pre-set parameters (e.g., potential range: -0.8 to 0 V; pulse amplitude: 50 mV; step potential: 10 mV).
- Apply a 20 μL drop of standard CAP solutions (0–600 μM) to the sensor surface to establish a calibration curve (Current vs. Concentration).
Step 3: Sample Measurement
- Apply a 20 μL drop of the prepared sample to a fresh GO@MWCNT/SPCE sensor.
- Initiate the DPV measurement from the smartphone interface. The voltammogram is recorded in real-time.
- The peak current at the characteristic potential for CAP (approximately -0.5 V vs. Ag/AgCl) is automatically quantified by the app.
Step 4: Data Analysis
- The smartphone application compares the sample's peak current to the stored calibration curve.
- The CAP concentration is calculated and displayed on the screen. Results can be saved locally or uploaded to cloud storage.
4. Performance Metrics
- Linear Range: 0 – 600 μM [5]
- Limit of Detection (LOD): 46 nM [5]
- Sensitivity: 1.71 μA μM⁻¹ cm⁻² [5]
- Analysis Time: < 5 minutes per sample [5]
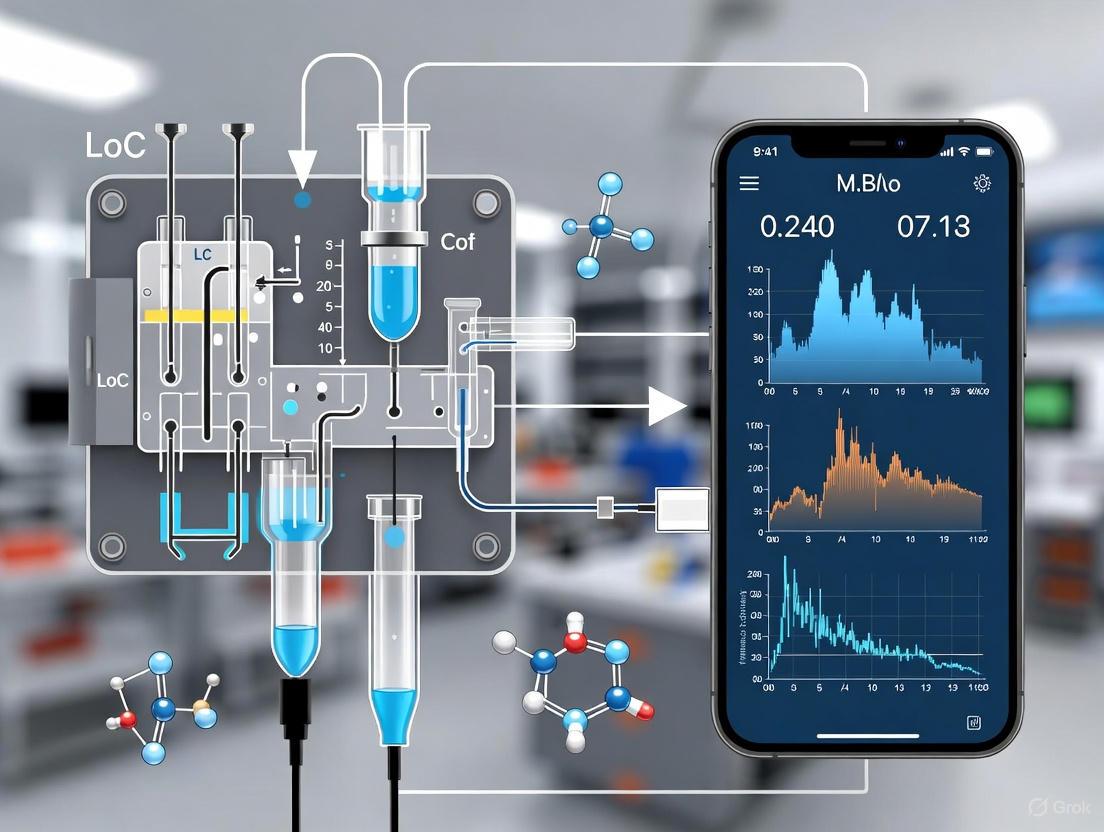
Workflow Visualization
The following diagram illustrates the integrated workflow of the smartphone-based LoC sensing platform.
Figure 1: Workflow of a smartphone-integrated LoC platform for on-site drug residue detection.
The Scientist's Toolkit: Key Research Reagent Solutions
The functionality of portable electrochemical sensors hinges on carefully selected materials and reagents. Table 2 catalogs the essential components for developing and deploying these systems.
Table 2: Essential Research Reagents and Materials for Portable Electrochemical Sensing
| Item | Function/Description | Example Application |
|---|---|---|
| Screen-Printed Electrodes (SPEs) [3] | Disposable, mass-producible electrodes (working, reference, counter) integral to LoC design. Enable miniaturization and ease of use. | Core sensing element in portable devices for drug detection. |
| Graphene Oxide (GO) & Carbon Nanotubes (MWCNTs) [5] [1] | Nanomaterials used to modify electrode surfaces. Provide high surface area, excellent electrical conductivity, and enhance electrocatalytic activity. | GO@MWCNT nanocomposite for sensitive CAP detection [5]. |
| Gold Nanoparticles (AuNPs) [1] [7] | Metallic nanomaterials that facilitate electron transfer, immobilize biomolecules, and act as catalytic labels for signal amplification. | Enhancing sensitivity in biosensors for toxins and pathogens. |
| Aptamers & Molecularly Imprinted Polymers (MIPs) [1] [2] | Synthetic biorecognition elements. Provide high specificity and stability for binding target drug molecules. | Creating selective sensing interfaces for controlled substances [3]. |
| Portable Potentiostat [5] [3] | Miniaturized instrument that applies potential and measures current. The core hardware for electrochemical readout. | PalmSens EmStat Pico for on-site voltammetry [3]. |
Signaling Pathway and Sensor Operation Logic
The core sensing mechanism involves a cascade of events from molecular recognition to signal transduction. The following diagram details this process for a nanomaterial-enhanced electrochemical sensor.
Figure 2: Signaling logic of a nanomaterial-enhanced electrochemical sensor for drug residues.
The integration of LoC technology with electrochemical sensors and smartphone readouts represents a paradigm shift in drug residue monitoring. The protocols and data presented herein demonstrate that these systems are no longer conceptual but are viable, high-performance tools capable of delivering laboratory-grade analytical results directly in the field. Their portability, speed, and ease of use address a critical unmet need across the food safety and clinical sectors. Future advancements in nanotechnology, artificial intelligence for data analysis, and IoT connectivity will further solidify the role of these decentralized platforms, enabling smarter surveillance networks and ensuring greater public health security.
The detection and monitoring of drug residues represent a critical challenge in pharmaceutical development, food safety, and clinical diagnostics. Traditional analytical methods, while sensitive, often require centralized laboratories, sophisticated instrumentation, and lengthy analysis times. The convergence of lab-on-a-chip (LoC) microfluidics, electrochemical biosensors, and smartphone-based readout has created a new paradigm for portable, rapid, and sensitive diagnostic platforms suitable for on-site drug residue analysis [8] [1].
This integrated system consolidates complete laboratory functions—including sample preparation, reaction, and detection—onto a single, miniaturized device. Electrochemical transducers offer advantages of high sensitivity, miniaturization compatibility, and low power consumption, while smartphones provide powerful computation, intuitive interfaces, and cloud connectivity [1] [5]. This combination facilitates real-time, point-of-need testing, which is particularly valuable for monitoring antibiotic residues like chloramphenicol, ensuring food safety, and enabling personalized therapeutic drug monitoring [1] [5].
System Components and Operating Principles
Lab-on-a-Chip Microfluidic Platforms
LoC devices perform complex chemical and biological analyses by manipulating small fluid volumes (nL to μL) within networks of microchannels [9]. Their operation is governed by microfluidics, where laminar flow and phenomena like surface tension and capillary forces dominate [9]. These devices are characterized by their minimal reagent consumption, rapid analysis, and potential for high-throughput processing [8] [9].
Material selection is critical for LoC performance and application suitability. The table below summarizes common materials and their properties.
Table 1: Common Materials for Microfluidic Device Fabrication
| Material | Key Advantages | Key Limitations | Example Applications |
|---|---|---|---|
| Polydimethylsiloxane (PDMS) | Biocompatible, gas-permeable, optically transparent, flexible [9] | Absorbs hydrophobic analytes, scalability challenges [9] | Organ-on-chip models, cell culture studies [9] |
| Glass | Low background fluorescence, chemically resistant, optically transparent [9] | High bonding temperature and voltage required [9] | POC diagnostics, nucleic acid analysis [9] |
| Polymers (e.g., PMMA) | Low cost, good optical clarity | Variable chemical resistance | Disposable cartridges, electrochemical sensor integration [5] [10] |
| Paper | Very low cost, capillary-driven flow, no external pumps required [9] | Limited complexity of flow control | Simple colorimetric diagnostic tests [9] |
| Silicon | High design flexibility, well-characterized surface chemistry [9] | Opaque, expensive, electrically conductive [9] | Nucleic acid detection arrays [9] |
Electrochemical Biosensors
Electrochemical biosensors are analytical devices that combine a biological recognition element with an electrochemical transducer. The transducer converts a biochemical interaction into a quantifiable electrical signal, such as current, potential, or impedance [1] [10]. A core component is the receptor, which provides specificity. The choice of receptor depends on the target analyte:
- Enzymes: Used for targets that are enzyme substrates (e.g., glucose oxidase for glucose detection) [10].
- Antibodies: Immunoproteins with high specificity and affinity for their antigens [1].
- Aptamers: Short, synthetic single-stranded DNA or RNA oligonucleotides selected for high affinity to specific targets, offering stability and design flexibility [1] [5].
- Peptide Nucleic Acids (PNAs): Synthetic DNA mimics with a neutral peptide backbone, conferring high resistance to enzymatic degradation and strong hybridization with DNA/RNA targets [11].
A critical advancement in sensor performance is the use of nanomaterials to modify electrode surfaces. Materials like graphene oxide (GO) and multi-walled carbon nanotubes (MWCNTs) provide a high surface area, enhance electron transfer rates, and allow for efficient immobilization of biological receptors, significantly boosting sensitivity and stability [1] [5].
The diagram below illustrates the general architecture and working principle of an integrated LoC-electrochemical system with smartphone readout.
Smartphone Integration and Readout
The smartphone serves as the system's brain, providing a user-friendly interface, data processing power, and connectivity [1]. It interfaces with the LoC device through a compact potentiostat, which applies the necessary electrical waveforms (e.g., for voltammetry) and measures the resulting current [5]. Data is transmitted via Bluetooth or USB, and a custom application on the smartphone controls the assay, processes the raw signal, and displays the concentration of the target analyte [5]. This enables wireless, real-time analysis and allows data to be stored or shared via cloud services, making it ideal for remote monitoring and point-of-care diagnostics [1] [5].
Experimental Protocols and Performance Data
Protocol: Detection of Chloramphenicol Using a Smartphone-Assisted Electrochemical LoC
The following protocol, adapted from a study on chloramphenicol (CAP) detection, details the steps for fabricating and operating an integrated sensing platform [5].
1. Electrode Modification and Sensor Fabrication:
- Materials:
- Graphene Oxide (GO) & MWCNTs: Form the nanocomposite for electrode modification, providing a high-surface-area, conductive scaffold [5].
- Screen-Printed Carbon Electrodes (SPCEs): Serve as a disposable, miniaturized electrochemical cell [5].
- Phosphate Buffered Saline (PBS): Used as the supporting electrolyte for electrochemical measurements.
- Procedure:
- Synthesize a GO@MWCNT nanocomposite.
- Drop-cast the GO@MWCNT suspension onto the working electrode surface of the SPCE and allow it to dry.
- The microfluidic component (e.g., a channel or chamber) is aligned and sealed over the modified SPCE to create the complete LoC cartridge.
2. Smartphone-Based Electrochemical Measurement:
- Materials:
- Procedure:
- Insert the prepared LoC cartridge into a holder that makes electrical contact with the potentiostat.
- Introduce the sample (e.g., milk, serum) containing CAP into the microfluidic inlet.
- Using the smartphone app, initiate Differential Pulse Voltammetry (DPV). This technique applies potential pulses and measures the faradaic current, which is directly related to CAP concentration as it oxidizes at the electrode surface.
- The current peak is recorded, and the smartphone app displays the concentration based on a pre-calibrated curve.
Table 2: Performance Metrics of a Smartphone-Integrated Platform for Chloramphenicol (CAP) Detection [5]
| Parameter | Value / Result |
|---|---|
| Detection Technique | Differential Pulse Voltammetry (DPV) |
| Linear Detection Range | 0 – 600 μM |
| Limit of Detection (LOD) | 46 nM |
| Sensitivity | 1.71 μA μM⁻¹ cm⁻² |
| Stability | ~90% signal retention after 21 days |
| Reproducibility | Relative Standard Deviation (RSD) < 3% |
| Validated in Matrices | Milk, tap water, human blood serum, eye drops |
Protocol: PKU Diagnosis via a Lab-on-a-CD System
This protocol outlines the use of a centrifugal microfluidic "Lab-on-a-CD" system for detecting phenylalanine (Phe), a marker for Phenylketonuria (PKU) [12].
1. System Setup and Cartridge Preparation:
- Materials:
- CD-shaped Cartridge: A disposable disk with microfluidic channels and reservoirs [12].
- Screen-Printed Gold Electrodes: Integrated into the cartridge for detection.
- Phenylalanine Dehydrogenase (PheDH): The enzyme used for specific recognition of Phe.
- Procedure:
- Modify the working electrode by electrochemically reducing graphene oxide (ERGO) to enhance sensitivity.
- Pre-load reagents, including the enzyme PheDH and co-factor NAD⁺, into specific reservoirs on the CD.
2. Centrifugal Operation and Amperometric Detection:
- Materials:
- Mini Centrifuge System: Spins the CD to control fluid movement via centrifugal force.
- Integrated Electrochemical Sensing Unit: Measures current on the spinning disk.
- Procedure:
- Apply a whole blood sample to the CD cartridge.
- Place the cartridge in the mini centrifuge. Controlled spinning moves the sample and reagents through the microfluidic channels for mixing and reaction.
- Phe is enzymatically converted by PheDH, producing NADH. The oxidation of NADH at the electrode surface generates a current.
- The system performs amperometric detection, measuring this current, which is proportional to the Phe concentration in the blood.
- Results are available in under 20 minutes [12].
Table 3: Analytical Performance of the Lab-on-a-CD System for Phenylalanine Detection [12]
| Parameter | Value / Result |
|---|---|
| Detection Technique | Amperometry |
| Measurement Range | 0 – 20 mg dL⁻¹ |
| Limit of Detection (LOD) | 0.0524 mg dL⁻¹ |
| Limit of Quantification (LOQ) | 0.1587 mg dL⁻¹ |
| Sensitivity | 0.3338 μA mg⁻¹ dL |
| Correlation Coefficient (R²) | 0.9955 |
| Accuracy | 84.1% (compared to HPLC) |
Essential Research Reagent Solutions
The table below catalogues key materials and reagents essential for developing and operating the described integrated systems.
Table 4: Key Research Reagents and Materials for LoC-Electrochemical-Smartphone Platforms
| Item | Function / Application | Justification for Use |
|---|---|---|
| Graphene Oxide (GO) & Carbon Nanotubes (MWCNTs) | Electrode surface modification | Enhances electron transfer, provides large surface area for bioreceptor immobilization, and improves sensitivity [1] [5]. |
| Screen-Printed Electrodes (SPCEs, Gold) | Disposable, miniaturized electrochemical cell | Enables mass production of low-cost, portable sensors ideal for single-use diagnostics [12] [5]. |
| Aptamers / Peptide Nucleic Acids (PNAs) | Biological recognition elements | Provide high specificity and stability; PNAs offer superior hybridization and nuclease resistance [1] [11]. |
| Enzymes (e.g., Phenylalanine Dehydrogenase) | Biological recognition and signal generation | Catalyzes specific reactions that produce electroactive species (e.g., NADH), enabling target quantification [12]. |
| Portable Potentiostat | Instrument for electrochemical measurement | Miniaturized hardware that applies potential and measures current, enabling smartphone integration for field use [5]. |
| PDMS / PMMA | Microfluidic device fabrication | PDMS is ideal for prototyping (gas-permeable, transparent); PMMA offers a robust material for cartridges [9] [10]. |
The integration of lab-on-a-chip technology, advanced electrochemical biosensors, and smartphone readout creates a powerful and transformative platform for drug residue research and diagnostics. These systems deliver high sensitivity, portability, and rapid analysis directly at the point of need, bypassing the limitations of conventional laboratory methods. As nanomaterials, microfluidic design, and connectivity continue to advance, these integrated platforms are poised to become indispensable tools for ensuring drug safety, advancing personalized medicine, and protecting public health.
Electrochemical biosensors have emerged as powerful analytical tools for the detection of drug residues, combining high sensitivity and selectivity with the potential for miniaturization and portability. These attributes are crucial for developing lab-on-a-chip (LoC) platforms with smartphone readout capabilities, which aim to transition analytical testing from centralized laboratories to the point of need. The core of any electrochemical sensor is its transduction mechanism, which converts a biochemical recognition event into a quantifiable electrical signal. This Application Note details the three principal electrochemical transduction techniques—voltammetry, amperometry, and electrochemical impedance spectroscopy (EIS)—within the context of a broader thesis on LoC systems for drug residue analysis. It provides researchers and drug development professionals with a foundational understanding of each mechanism's working principles, comparative strengths, and detailed experimental protocols for implementation in miniaturized sensing platforms.
Fundamental Principles and Comparative Analysis
The performance of an electrochemical sensor is governed by its transduction mechanism. The table below summarizes the core principles, key parameters, and output characteristics of voltammetry, amperometry, and impedance spectroscopy.
Table 1: Comparison of Key Electrochemical Transduction Mechanisms
| Feature | Voltammetry | Amperometry | Impedance Spectroscopy (EIS) |
|---|---|---|---|
| Core Principle | Measures current as a function of the applied potential. [13] [2] | Measures current as a function of time at a constant applied potential. [2] | Measures the impedance (resistance to current flow) of a system as a function of frequency of a small AC voltage. [14] |
| Excitation Signal | Linearly scanned or pulsed potential waveform. | Constant potential. | Sinusoidal AC potential (superimposed on a DC bias). |
| Key Measured Output | Current vs. Potential plot (Voltammogram). | Current vs. Time plot (Chronoamperogram). | Complex Impedance (Z) vs. Frequency. |
| Key Parameters | Scan rate, peak potential (Ep), peak current (ip). | Applied potential, steady-state current. | Charge transfer resistance (Rct), solution resistance (Rs), double-layer capacitance (Cdl). |
| Information Obtained | Qualitative (redox potential) and quantitative (analyte concentration) information. [2] | Quantitative analyte concentration; often used in enzyme-based sensors. [2] | Label-free monitoring of binding events, interfacial properties, and reaction kinetics. [13] [15] |
| Detection Limit | Very low (nanomolar to picomolar). | Very low (nanomolar to picomolar). | Can achieve very low detection limits (e.g., 10–11 M reported for some applications). [16] |
The following workflow outlines a generalized experimental procedure for developing an electrochemical LoC sensor, from bioreceptor immobilization to data acquisition via a smartphone.
Figure 1: Generalized Workflow for an Electrochemical LoC Sensor.
Detailed Experimental Protocols
Voltammetry
Principle: Voltammetry encompasses a suite of techniques where the current at a working electrode is measured while the potential between the working and reference electrodes is varied according to a specific waveform. The resulting voltammogram provides information on the redox characteristics of the electroactive species, with the peak current being proportional to the analyte concentration. Cyclic Voltammetry (CV) is a fundamental and widely used technique for characterizing sensor surfaces and studying redox mechanisms. [17]
Protocol: Cyclic Voltammetry for Sensor Characterization and Analyte Detection
- Sensor Preparation: Integrate a three-electrode system (working, counter, and reference electrodes) into a microfluidic chip. Functionalize the working electrode surface with suitable nanomaterials (e.g., graphene, gold nanoparticles) to enhance the electroactive surface area and facilitate bioreceptor immobilization. [13] [15]
- Bioreceptor Immobilization: Immobilize specific capture probes (e.g., antibodies, aptamers) onto the functionalized working electrode. Passivate the remaining surface with a blocking agent (e.g., Bovine Serum Albumin - BSA) to minimize non-specific binding.
- Baseline Measurement: Introduce a supporting electrolyte (e.g., phosphate buffer saline, PBS) into the microfluidic channel. Run a CV scan from a defined starting potential (Estart) to a switching potential (Eλ) and back to Estart at a selected scan rate (e.g., 50-100 mV/s). This provides a baseline signal.
- Analyte Detection: Introduce the sample containing the target drug residue into the microfluidic channel. Allow sufficient incubation time for the target to bind to the immobilized bioreceptor.
- Post-Binding Measurement: Wash the channel with buffer to remove unbound material. Perform a CV scan under identical conditions to the baseline measurement.
- Data Analysis:
- Sensor Characterization: A redox probe like [Fe(CN)6]3-/4- is used. A decrease in the peak current and/or a shift in the peak potential after bioreceptor immobilization and target binding indicates successful modification and increased electron transfer resistance.
- Quantitative Detection: For an electroactive drug residue, the appearance or change in the magnitude of a specific oxidation/reduction peak can be used for quantification by constructing a calibration curve of peak current versus analyte concentration.
Amperometry
Principle: In amperometry, a constant potential is applied to the working electrode, and the resulting Faradaic current is measured as a function of time. The applied potential is chosen to drive the oxidation or reduction of the target species at a diffusion-limited rate. The steady-state current achieved is directly proportional to the bulk concentration of the analyte. This technique is renowned for its high sensitivity and is frequently employed in enzyme-based biosensors. [2]
Protocol: Amperometric Detection of Enzyme-Catalyzed Products
- Sensor Design: Fabricate a microfluidic electrochemical cell with an integrated enzyme-linked bioreceptor on the working electrode. The enzyme (e.g., horseradish peroxidase, alkaline phosphatase) is chosen to catalyze a reaction that produces an electroactive product.
- Potential Optimization: Using a standard solution of the enzyme's electroactive product, perform a voltammetric scan (e.g., CV) to identify the optimal potential where the product is oxidized/reduced. This potential will be used for the amperometric measurement.
- Baseline Stabilization: Apply the selected constant potential to the working electrode. Flow a pure buffer solution through the microfluidic channel and allow the background current to stabilize.
- Sample Injection & Measurement: Introduce the sample containing the drug residue- enzyme conjugate (in a competitive assay format) or the target that triggers an enzymatic reaction. The enzyme catalyzes the conversion of a substrate into an electroactive product (e.g., H2O2).
- Real-Time Monitoring: Monitor the current in real-time. The generation and diffusion of the electroactive product to the electrode surface cause a step-change or a continuous increase in the measured current.
- Quantification: The rate of change of current or the magnitude of the steady-state current is correlated with the concentration of the enzyme, and thus, the target drug residue, via a pre-established calibration curve.
Electrochemical Impedance Spectroscopy (EIS)
Principle: EIS probes the dielectric and conductive properties of an electrochemical interface by applying a small amplitude sinusoidal AC voltage over a wide range of frequencies and measuring the current response. [14] The system's impedance, both magnitude and phase shift, is recorded. In biosensing, the binding of a target analyte to a bioreceptor on the electrode surface alters the interfacial properties, typically increasing the charge-transfer resistance (Rct), which can be sensitively measured. EIS is a powerful label-free technique. [13] [15]
Protocol: Label-Free EIS for Binding Detection
- Interface Preparation: Functionalize the working electrode within the LoC device as described in the voltammetry protocol.
- Initial Impedance Measurement: In the presence of a redox probe (e.g., [Fe(CN)6]3-/4-), measure the impedance spectrum. A typical measurement applies a 5-10 mV AC amplitude superimposed on a DC potential (often the formal potential of the redox couple) across a frequency range of 0.1 Hz to 100 kHz.
- Equivalent Circuit Modeling: Fit the obtained Nyquist plot (imaginary impedance, -Z'' vs. real impedance, Z') to an appropriate equivalent circuit model (e.g., the Randles circuit) to extract key parameters like the solution resistance (Rs), charge-transfer resistance (Rct), and double-layer capacitance (Cdl). [14]
- Target Incubation: Introduce the sample containing the drug residue into the microfluidic chamber and incubate.
- Post-Binding Impedance Measurement: After a wash step, record a new impedance spectrum under identical conditions.
- Data Analysis: The primary indicator of a binding event is a significant increase in the Rct value, as the bound biomolecules hinder the electron transfer of the redox probe to the electrode surface. The change in Rct (ΔRct) is used for quantitative analysis.
The Scientist's Toolkit: Essential Research Reagents and Materials
The fabrication and operation of high-performance electrochemical LoC sensors rely on a suite of specialized materials and reagents, as detailed below.
Table 2: Essential Research Reagents and Materials for Electrochemical LoC Development
| Category | Item | Function/Purpose |
|---|---|---|
| Electrode & Chip Materials | Gold, Carbon, Indium Tin Oxide (ITO) Electrodes | Serve as the conductive transduction platform; choice depends on required potential window, cost, and functionalization chemistry. [18] |
| Polydimethylsiloxane (PDMS), Polymethylmethacrylate (PMMA), Paper | Common substrates for fabricating microfluidic channels; selected for biocompatibility, optical properties, and fabrication ease. [19] [20] | |
| Nanomaterials | Gold Nanoparticles (AuNPs), Graphene/Graphene Oxide (GO), MXenes | Enhance electrode conductivity, provide high surface area for bioreceptor immobilization, and catalyze reactions, thereby boosting sensitivity. [13] [2] [15] |
| Biorecognition Elements | Antibodies, Aptamers, Peptide Nucleic Acids (PNA), Molecularly Imprinted Polymers (MIPs) | Provide high specificity for the target drug residue. PNAs offer superior stability and hybridization properties. [11] MIPs are synthetic, robust alternatives. [2] |
| Chemical Reagents | Redox Probes (e.g., [Fe(CN)₆]³⁻/⁴⁻) | Essential for EIS and some voltammetric measurements to probe interfacial changes and electron transfer kinetics. [14] |
| Blocking Agents (e.g., BSA, Casein) | Minimize non-specific adsorption of non-target molecules to the sensor surface, improving signal-to-noise ratio. [15] | |
| Coupling Agents (e.g., EDC/NHS) | Enable covalent immobilization of bioreceptors (like antibodies) onto functionalized (e.g., carboxylated) electrode surfaces. | |
| Instrumentation & Readout | Miniaturized Potentiostat | The core instrument for applying potentials and measuring currents in voltammetry, amperometry, and EIS. [2] |
| Smartphone with Custom App | Provides computational power, user interface, data visualization, and wireless connectivity for true point-of-care operation. [2] [20] |
The accurate detection of drug residues is paramount for ensuring public health, food safety, and environmental protection. Within the innovative framework of lab-on-a-chip (LoC) electrochemical sensors with smartphone readout, the biorecognition element serves as the critical component that dictates analytical performance by providing specificity towards the target analyte [21] [1]. These elements are responsible for the selective sequestration of drug residues, initiating a biochemical signal that is transduced into an electrical readout [21]. This application note details the essential characteristics, applications, and experimental protocols for four principal biorecognition elements—Enzymes, Antibodies, Aptamers, and Molecularly Imprinted Polymers (MIPs)—within the context of developing robust, portable, and highly sensitive sensors for drug residue analysis.
Characteristics and Comparative Analysis
The selection of an appropriate biorecognition element is a foundational step in biosensor design, influencing key performance parameters such as sensitivity, selectivity, stability, and cost-effectiveness [21]. The table below provides a structured comparison of these elements to guide researchers in the preliminary design phase.
Table 1: Comparative analysis of key biorecognition elements for electrochemical LoC sensors.
| Biorecognition Element | Type | Binding Mechanism | Key Advantages | Inherent Limitations | Typical Immobilization Methods on Electrodes |
|---|---|---|---|---|---|
| Enzymes [21] | Natural (Protein) | Biocatalytic conversion of analyte | High catalytic activity; Well-established immobilization protocols | Limited to substrates and inhibitors; Susceptible to denaturation | Adsorption; Encapsulation; Cross-linking; Covalent bonding |
| Antibodies [21] [22] | Natural (Protein) | Affinity-based immunocomplex formation | Very high specificity and low cross-reactivity | Sensitive to temperature/pH; Costly production; Short shelf-life | Covalent linkage; Physical adsorption |
| Aptamers [21] [1] [22] | Pseudo-natural (Oligonucleotide) | Folding into 3D structures for affinity binding | High chemical stability; Tunable affinity; Reusability | SELEX discovery process can be costly and time-consuming | Thiol-gold on AuNPs; Avidin-biotin; Adsorption |
| Molecularly Imprinted Polymers (MIPs) [23] [22] [24] | Synthetic (Polymer) | Shape-complementary cavities with chemical functionality | High durability & long shelf-life; Low-cost, relatively easy production; Reusable | Potential heterogeneity in binding sites; Challenges with aqueous phase imprinting | In-situ electropolymerization; Drop-casting of MIP nanoparticles |
Beyond these core characteristics, the integration of nanomaterials significantly enhances the performance of all biosensor types. Materials such as gold nanoparticles (AuNPs) and graphene oxide (GO) are frequently used to modify electrodes. They provide a high surface-to-volume ratio for increased bioreceptor immobilization, improve electrical conductivity for faster electron transfer, and possess inherent catalytic properties, collectively leading to significantly lower detection limits [1].
Experimental Protocols for Sensor Fabrication
This section outlines detailed methodologies for functionalizing electrodes with each type of biorecognition element, specifically tailored for integration into microfluidic LoC platforms.
Protocol for Antibody-Based Immunosensor Fabrication
This protocol describes the development of an electrochemical immunosensor for the detection of a target drug residue, such as an antibiotic.
Table 2: Key reagents and materials for antibody-based sensor fabrication.
| Reagent/Material | Function in the Protocol |
|---|---|
| Gold working electrode | Provides a clean, functionalizable surface for antibody immobilization. |
| Ethanol, 11-Mercaptoundecanoic acid (11-MUA) | Used for cleaning and forming a self-assembled monolayer (SAM) for covalent attachment. |
| N-(3-Dimethylaminopropyl)-N′-ethylcarbodiimide (EDC) / N-Hydroxysuccinimide (NHS) | Activates carboxyl groups on the SAM for covalent bonding with antibody amine groups. |
| Anti-target drug antibody (e.g., Anti-chloramphenicol) | The primary biorecognition element that specifically binds the target drug residue. |
| Ethanolamine | Blocks any remaining activated ester groups to prevent non-specific binding. |
| Phosphate Buffered Saline (PBS), pH 7.4 | Provides a physiologically compatible medium for all incubation and washing steps. |
Procedure:
- Electrode Pretreatment: Clean the gold working electrode with piranha solution (Caution: Highly corrosive) followed by successive polishing with alumina slurries and sonication in ethanol and deionized water. Dry under a stream of nitrogen gas.
- SAM Formation: Immerse the electrode in a 1 mM ethanolic solution of 11-Mercaptoundecanoic acid (11-MUA) for 12 hours to form a self-assembled monolayer.
- Antibody Immobilization: a. Rinse the SAM-modified electrode with ethanol and PBS. b. Activate the carboxyl terminal of the SAM by incubating with a fresh mixture of EDC (400 mM) and NHS (100 mM) in water for 1 hour. c. Rinse with PBS to remove excess EDC/NHS. d. Incubate the electrode with a 10 µg/mL solution of the specific anti-drug antibody in PBS for 2 hours at room temperature.
- Surface Blocking: Incubate the functionalized electrode with 1 M ethanolamine (pH 8.5) for 30 minutes to deactivate any remaining reactive groups.
- Storage: The immunosensor can be stored in PBS at 4°C until use. The stability of the antibody dictates the shelf life [22].
Protocol for Aptamer-Based Sensor Fabrication
This protocol leverages the stability and reusability of aptamers for detecting small-molecule drug residues.
Table 3: Key reagents and materials for aptamer-based sensor fabrication.
| Reagent/Material | Function in the Protocol |
|---|---|
| Gold nanoparticle (AuNP)-modified screen-printed carbon electrode (SPCE) | Increases surface area and provides thiol-reactive sites for aptamer immobilization. |
| Thiol-modified DNA aptamer | The synthetic biorecognition element; the thiol group allows for covalent attachment to gold. |
| 6-Mercapto-1-hexanol (MCH) | A spacer molecule that creates a well-oriented aptamer monolayer and minimizes non-specific adsorption. |
| Tris-EDTA (TE) buffer or PBS | Standard buffers for aptamer dilution and storage. |
| Target drug standard (e.g., cortisol, antibiotic) | The analyte of interest for sensor calibration and testing. |
Procedure:
- Aptamer Preparation: Dilute the thiol-modified aptamer to a 1 µM concentration in TE buffer. Reduce the thiol group by treating with Tris(2-carboxyethyl)phosphine (TCEP) for 1 hour prior to use.
- Aptamer Immobilization: Drop-cast 10 µL of the reduced aptamer solution onto the AuNP/SPCE surface and incubate in a humid chamber for 16 hours at room temperature.
- Surface Backfilling: Rinse the electrode gently with deionized water to remove physically adsorbed aptamers. Then, incubate with 1 mM 6-Mercapto-1-hexanol (MCH) for 1 hour to displace non-specifically bound aptamers and form a mixed monolayer.
- Equilibration and Use: The aptasensor is now ready for use. It should be equilibrated in the measurement buffer before electrochemical analysis. Signal generation can be based on a conformational change in the aptamer upon target binding (e.g., using a redox tag like Methylene Blue) [22] [24].
Protocol for MIP-Based Sensor Fabrication via Electropolymerization
This protocol describes the direct synthesis of a MIP receptor layer on the sensor surface, ideal for creating robust, low-cost sensors.
Table 4: Key reagents and materials for MIP-based sensor fabrication.
| Reagent/Material | Function in the Protocol |
|---|---|
| Target drug molecule (template) | The molecule to be detected; it shapes the specific cavities within the polymer. |
| Functional monomer (e.g., 3-aminophenol, pyrrole) | Forms interactions with the template; chosen based on template chemistry. |
| Cross-linker & Dopant | Provides structural rigidity to the polymer matrix (for some monomers). |
| Supporting electrolyte | Ensures conductivity during the electropolymerization process. |
| Acetic acid / Methanol mixture | Extraction solvent to remove the template molecules, leaving behind specific cavities. |
Procedure:
- Polymerization Solution Preparation: Prepare a solution containing the target drug (template), functional monomer, and supporting electrolyte in a suitable solvent (e.g., water or acetonitrile). The optimal molar ratio of template to monomer should be determined empirically.
- In-situ Electropolymerization: Place the working electrode (e.g., GCE or SPCE) into the polymerization solution. Using a potentiostat, perform electropolymerization via Cyclic Voltammetry (CV) by sweeping the potential between a predefined range (e.g., -0.2 V to +0.8 V vs. Ag/AgCl) for 10-20 cycles. This deposits a thin, controlled polymer film on the electrode surface.
- Template Extraction: Remove the MIP-modified electrode and immerse it in a stirring solution of acetic acid:methanol (e.g., 1:9 v/v) for 15-20 minutes to extract the embedded template molecules, leaving behind specific recognition cavities.
- Validation: The success of extraction and the binding capacity of the MIP film can be validated using Electrochemical Impedance Spectroscopy (EIS) or Differential Pulse Voltammetry (DPV) in a ferri/ferrocyanide solution, comparing the signal before and after extraction, and after rebinding with the target [22] [24].
Schematic Workflows and Signaling Pathways
The following diagrams, defined using the DOT language and adhering to the specified color palette and contrast rules, illustrate the core operational concepts of the featured biosensors.
MIP Fabrication and Sensing Mechanism
Title: MIP fabrication and sensing cycle on an electrode surface.
Smartphone-Integrated LoC for Drug Residue Detection
Title: Integrated workflow for smartphone-based LoC sensing.
The Scientist's Toolkit: Essential Research Reagent Solutions
Successful sensor development relies on a suite of specialized reagents and materials. The following table details key components for the featured protocols.
Table 5: Essential research reagents and materials for biosensor development.
| Item | Core Function | Key Considerations for Selection |
|---|---|---|
| Screen-Printed Electrodes (SPEs) | Disposable, miniaturized, and cost-effective sensing platform. | Choose carbon, gold, or platinum working electrodes based on the biorecognition element and detection method. |
| N-(3-Dimethylaminopropyl)-N′-ethylcarbodiimide (EDC) | Carboxyl group activator for covalent immobilization of antibodies/aptamers. | Always use fresh solutions; reacts rapidly with water. Used with NHS to form a stable amine-reactive ester. |
| N-Hydroxysuccinimide (NHS) | Stabilizes the EDC-activated intermediate, forming a more stable succinimide ester. | Combined with EDC for efficient amide bond formation in aqueous environments. |
| Thiol-Modified Aptamers | Enables covalent, oriented immobilization on gold surfaces via Au-S chemistry. | Requires a reducing step (TCEP) before use to break disulfide bonds and ensure free thiol availability. |
| 6-Mercapto-1-hexanol (MCH) | Alkanethiol used as a backfilling agent on gold surfaces. | Creates a hydrophilic monolayer, displaces non-specific adsorption, and forces aptamers into an upright orientation. |
| Gold Nanoparticles (AuNPs) | Nanomaterial for electrode modification. | Enhances surface area, improves electron transfer, and provides high density of thiol-binding sites. |
| Functional Monomers (e.g., 3-Aminophenol) | Building blocks for MIP synthesis that interact with the template. | Selection is critical; should form non-covalent interactions (H-bonding, electrostatic) with the target drug. |
In the evolving landscape of analytical chemistry, the detection of drug residues presents significant challenges for researchers and forensic professionals. The integration of Lab-on-a-Chip (LoC)-based electrochemical sensors with smartphone readouts represents a paradigm shift, moving complex analytical procedures from centralized laboratories to the point of need. Smartphones serve as the central hub for these portable sensing platforms, providing the computational power for data analysis, multiple connectivity options for data transfer, and intuitive user interfaces that enable operation by non-specialists. This convergence of microfluidic technology, electrochemical sensing, and consumer electronics has created powerful, field-deployable tools that are transforming drug residue research and monitoring capabilities across forensic, medical, and food safety sectors.
Technical Foundations of Smartphone-Integrated Electrochemical Sensing
Smartphone-integrated electrochemical biosensors function by converting specific biochemical interactions with drug residues into measurable electrical signals. The core system typically consists of a miniaturized potentiostat that interfaces with the sensor, connecting to a smartphone via Bluetooth or USB for power and data transmission [25] [26]. The smartphone provides the interface for initiating measurements, processing data, and displaying results.
The signaling interfaces in these systems have evolved significantly through advanced materials and engineering approaches. Laser-Induced Graphene (LIG) electrodes fabricated via CO₂ laser etching of polyimide films create porous, three-dimensional structures that offer enhanced electrochemical performance due to their high surface area and excellent conductivity [25] [27]. Similarly, nanomaterial-modified electrodes incorporating gold nanoparticles (AuNPs), multi-walled carbon nanotubes (MWCNTs), and graphene oxide (GO) significantly amplify detection signals by increasing the electroactive surface area and facilitating electron transfer processes [28] [26].
Recent innovations in soft and stretchable electrodes have enabled the development of conformable sensing platforms that maintain electrical conductivity even under mechanical deformation, opening possibilities for wearable monitoring applications [27]. Additionally, 3D-printed sensing platforms offer precise geometrical control and customizability for specific sensing applications, allowing researchers to create optimized architectures for particular drug detection scenarios [27].
Table 1: Advanced Signal Interface Technologies in Electrochemical Biosensors
| Technology | Key Features | Advantages for Drug Residue Detection | Representative Applications |
|---|---|---|---|
| Laser-Induced Graphene (LIG) | Porous 3D structure, high conductivity, flexible substrate compatibility | Enhanced sensitivity, rapid response (e.g., 10s), cost-effective fabrication | Sulfadimidine detection in food products [25] |
| Nanomaterial Composites (AuNPs, MWCNTs, GO) | Large surface area, excellent electron transfer, customizable functionalization | Lower detection limits, improved selectivity through surface modification | Chloramphenicol, paclitaxel detection [28] [26] |
| Soft/Stretchable Electrodes | Mechanical compliance, maintained conductivity under deformation | Wearable sensing capability, compatibility with irregular surfaces | Potential for continuous monitoring applications [27] |
| 3D-Printed Platforms | Precise geometrical control, rapid prototyping, multifunctional integration | Customizable sensor designs for specific drug targets | Emerging technology for point-of-care diagnostics [27] |
Applications in Drug Residue Detection and Monitoring
Smartphone-integrated electrochemical platforms have demonstrated remarkable capabilities in detecting various drug classes with high sensitivity and specificity, as evidenced by recent research applications.
Antibiotic Drug Residues
The detection of antibiotic residues represents a significant application area, with researchers developing increasingly sophisticated sensing approaches. A wireless smartphone-assisted electrochemical platform incorporating graphene oxide and multi-walled carbon nanotubes (GO@MWCNT) demonstrated excellent performance for chloramphenicol (CAP) detection [26]. This system achieved a linear detection range of 0-600 μM, with an impressive limit of detection (LOD) of 46 nM and sensitivity of 1.71 μA μM⁻¹ cm⁻². The platform maintained ∼90% signal retention after 21 days, demonstrating exceptional stability, and successfully detected CAP residues in milk, tap water, eye drops, capsules, and human blood serum with good recovery rates [26].
Similarly, a smartphone-based sensor for sulfadimidine (SM2) detection utilized a flexible three-electrode system based on laser-induced porous graphene [25]. This platform showed remarkable sensitivity—2.87 and 10.87-fold higher than conventional screen-printed carbon electrodes (SPCE) and glassy carbon electrodes (GCE), respectively. The sensor demonstrated excellent stability (RSD < 0.46% over 99 cycles) with a rapid 10-second response time, achieving a low LOD of 0.03 μM for SM2 in spiked beef and milk samples with recovery rates of 93.34%-103.70% [25].
Therapeutic Drug Monitoring
The application of these platforms extends to monitoring therapeutic drugs, enabling personalized treatment approaches. A smartphone-based portable electrochemical sensor was developed for ultrasensitive detection of paclitaxel (PTX), a chemotherapeutic agent, in human serum and injection solutions [28]. The sensor utilized screen-printed carbon electrodes modified with gold nanoparticles and multi-walled carbon nanotubes (AuNPs/MWCNTs), which increased the working electrode area by a factor of 1.46, significantly enhancing electrochemical performance [28].
This system demonstrated good linearity between current response and PTX concentration in the range of 0.05-10 μM in buffer and 0.5-30 μM in human serum, with detection limits of 1.7 nM and 3.6 nM, respectively. The sensor maintained excellent stability over 8 weeks and showed outstanding specificity and reproducibility toward PTX detection, making it suitable for therapeutic drug monitoring and drug quality control applications [28].
Illicit Substance Detection
While the search results did not provide extensive details on illicit drug detection, one commercial application demonstrates the potential of smartphone-based detection platforms. The MobileDetect system uses recognized National Institute of Justice chemical reagents to produce color reactions specific to different drugs, including fentanyl, heroin, cocaine, methamphetamine, and synthetic cannabinoids [29]. The accompanying smartphone app automates the detection process by analyzing color changes in test pouches, creating test reports with GPS mapping, and enabling instant sharing of results [29].
Table 2: Performance Metrics of Smartphone-Integrated Drug Detection Platforms
| Target Analyte | Sensor Platform | Linear Range | Limit of Detection (LOD) | Sample Matrix | Reference |
|---|---|---|---|---|---|
| Chloramphenicol | GO@MWCNT nanocomposite | 0-600 μM | 46 nM | Milk, tap water, eye drops, capsules, human serum | [26] |
| Sulfadimidine | Laser-induced porous graphene (LIPG) | 3-110 μM | 0.03 μM | Beef, milk | [25] |
| Paclitaxel | AuNPs/MWCNTs/SPCE | 0.05-10 μM (buffer), 0.5-30 μM (serum) | 1.7 nM (buffer), 3.6 nM (serum) | Human serum, injection solution | [28] |
| Cu²⁺ | F, N-CDs@Rh6G fluorescent probe | 0.061-35 μM | 61 nM | Environmental samples | [30] |
| Glyphosate | F, N-CDs@Rh6G fluorescent probe | 0.053-40 μM | 53 nM | Environmental samples | [30] |
Experimental Protocols
Protocol: Fabrication of Laser-Induced Graphene Electrodes for Sulfadimidine Detection
Principle: CO₂ laser etching of polyimide film generates porous graphene electrodes with enhanced electrochemical properties suitable for detecting antibiotic residues [25].
Materials and Equipment:
- Polyimide (PI) film (thickness: 0.1-0.2 mm)
- CO₂ laser etching system
- Electrochemical workstation (portable)
- Smartphone with Bluetooth connectivity
- Sulfadimidine standard solutions
- Phosphate buffer saline (PBS, 0.1 M, pH 7.4)
Procedure:
- Laser Parameter Optimization: Optimize laser power and etching depth to achieve optimal graphene porosity and conductivity. Typical parameters: 20-40% power, 5-20 cm/s scanning speed.
- Electrode Fabrication: Etch the three-electrode system (working, reference, counter electrodes) directly onto the polyimide film using the optimized laser parameters.
- Electrochemical Characterization: Perform cyclic voltammetry in standard redox probes (e.g., [Fe(CN)₆]³⁻/⁴⁻) to verify electrode performance.
- Sensor Calibration: Prepare sulfadimidine standard solutions (3-110 μM) in PBS and measure using square wave voltammetry.
- Sample Preparation: Extract sulfadimidine from beef or milk samples using appropriate solvent extraction.
- Measurement: Connect the LIG electrode to the portable potentiostat, pair with smartphone via Bluetooth, and perform measurements on prepared samples.
- Data Analysis: Use the smartphone application to calculate sulfadimidine concentration based on the calibration curve.
Protocol: Chloramphenicol Detection Using GO@MWCNT Nanocomposite
Principle: Graphene oxide and multi-walled carbon nanotube nanocomposite enhances electron transfer efficiency and provides large surface area for chloramphenicol detection [26].
Materials and Equipment:
- Screen-printed carbon electrodes (SPCEs)
- Graphene oxide (GO) dispersion
- Multi-walled carbon nanotubes (MWCNTs)
- Chloramphenicol standard
- Phosphate buffer (0.1 M, pH 7.0)
- Portable potentiostat with Bluetooth capability
- Smartphone with custom analysis application
Procedure:
- Nanocomposite Preparation: Prepare GO@MWCNT nanocomposite by mixing GO and MWCNTs in specific ratio (typically 1:1) using sonication.
- Electrode Modification: Drop-cast 5-10 μL of GO@MWCNT nanocomposite onto the working electrode of SPCE and dry at room temperature.
- Electrochemical Activation: Perform cyclic voltammetry scanning in blank phosphate buffer to activate and stabilize the modified electrode.
- Calibration Curve: Measure differential pulse voltammetry responses for chloramphenicol standards (0-600 μM) in PBS.
- Real Sample Analysis: Apply prepared milk, serum, or water samples to the modified electrode.
- Detection: Connect the modified SPCE to the portable potentiostat and initiate measurement via smartphone application.
- Quantification: Use the smartphone app to calculate chloramphenicol concentration based on the predetermined calibration curve, with automatic report generation including time, date, and GPS location.
Visualization Diagrams
Diagram 1: System Architecture of Smartphone-Integrated LoC Platform. This diagram illustrates the complete workflow from sample introduction to results visualization, highlighting the three core smartphone functionalities.
Diagram 2: Drug Residue Detection Workflow. This diagram details the molecular recognition and signal transduction processes within the LoC platform that enable specific drug detection.
The Scientist's Toolkit: Research Reagent Solutions
Table 3: Essential Materials for Smartphone-Integrated Electrochemical Sensing
| Material/Component | Function | Application Examples |
|---|---|---|
| Laser-Induced Graphene (LIG) | Flexible, porous electrode material with high conductivity | Sulfadimidine detection in food products [25] |
| Gold Nanoparticles (AuNPs) | Enhance electron transfer, increase electrode surface area | Paclitaxel sensor modification [28] |
| Multi-Walled Carbon Nanotubes (MWCNTs) | Improve sensitivity and selectivity through enhanced surface area | Chloramphenicol and paclitaxel detection [28] [26] |
| Graphene Oxide (GO) | Provide functional groups for biomolecule immobilization | Chloramphenicol sensor platform [26] |
| Screen-Printed Carbon Electrodes (SPCEs) | Disposable, cost-effective electrode platforms | Multiple drug detection applications [28] |
| Molecularly Imprinted Polymers (MIPs) | Synthetic recognition elements for specific analyte binding | Emerging technology for enhanced selectivity [2] |
| Portable Potentiostat | Miniaturized electrochemical measurement device | Field-deployable drug detection systems [31] [26] |
| Smartphone Application | Data processing, visualization, and result reporting | All integrated sensing platforms [25] [28] [26] |
Building and Deploying Integrated Smartphone-LoC Sensors: Materials, Assembly, and Real-World Applications
The development of effective lab-on-a-chip (LoC) platforms for the electrochemical detection of drug residues hinges on the strategic selection of substrate materials. The material dictates not only the fabrication workflow and cost but also critical performance parameters such as sensor sensitivity, device portability, and operational stability. Among the plethora of options, polydimethylsiloxane (PDMS), paper, and adhesive tape have emerged as prominent substrates, each offering a unique portfolio of advantages and challenges [19] [32]. This Application Note provides a comparative analysis of these three materials, framed within the context of developing electrochemical LoC sensors with smartphone readout for drug residue analysis. It includes structured quantitative data, detailed experimental protocols, and visual workflows to guide researchers and scientists in making informed material selections for their specific applications.
Material Comparison and Selection Guidelines
The choice between PDMS, paper, and adhesive tape is multifaceted, requiring a balance between material properties, fabrication capabilities, and the intended analytical function. The table below summarizes the key characteristics of these substrates to aid in the selection process.
Table 1: Comparative Analysis of PDMS, Paper, and Adhesive Tape for Microfluidics
| Feature | PDMS | Paper | Adhesive Tape |
|---|---|---|---|
| Primary Fabrication Method | Soft lithography [19] | Wax printing, roll-to-roll [33] [19] | Laser cutting, layer stacking [19] [32] |
| Cost per Device | Low (material), Moderate (fabrication) | Ultra-low (<$0.05) [33] | Very low [32] |
| Fluid Transport Mechanism | Capillary pumps, external pressure [19] | Passive capillary action [19] | Defined channels, often passive flow |
| Optical Transparency | High [34] | Opaque / Translucent | Varies (often transparent) |
| Biocompatibility | High [35] | High [33] | Good (depends on specific tape) |
| Surface Chemistry / Modification | Hydrophobic, prone to nonspecific adsorption; often requires plasma treatment [19] [34] | Hydrophilic, easy to functionalize with biomolecules [33] | Inert hydrophobic barriers; easy to define hydrophilic/hydrophobic regions [33] |
| Ease of Integration with Electrodes | Good; requires bonding step [36] | Excellent; electrodes can be pre-patterned via screen printing [33] | Excellent; simple layer stacking aligns channels with electrodes [19] |
| Key Advantages | Flexibility, high-fidelity micromolding, gas permeability suitable for cell cultures [35] | Extremely low cost, built-in filtration, no external pumps needed, foldable for 3D devices [33] [19] | Rapid, equipment-free fabrication, simple bonding, high-pressure tolerance in bonded devices [36] [32] |
| Key Limitations | Absorption of small hydrophobic molecules, complex multi-step fabrication [19] | Limited resolution of hydrophobic barriers, susceptible to pH and bleaching agents [19] | Potential for delamination under extreme temperatures, limited by laser spot size for miniaturization [19] |
For drug residue detection, which often requires high sensitivity and portability:
- PDMS is suited for complex, high-resolution channel networks that might integrate sample preparation steps.
- Paper is ideal for ultra-low-cost, disposable, and pump-free devices for use in resource-limited settings.
- Adhesive Tape offers a compelling middle ground with its rapid prototyping capabilities and robust, leak-free bonding, facilitating the creation of durable multi-layered LoC devices [33] [19] [32].
Experimental Protocols and Methodologies
Protocol 1: Roll-to-Roll Fabrication of Tape-Paper-Based Electrochemical Devices
This protocol describes a scalable mass production method for creating tape-paper-based electrochemical sensing devices, ideal for high-volume production of point-of-care tests [33].
Research Reagent Solutions & Materials
- Paper Substrate: Chromatography or filter paper.
- Adhesive Tape: Single-sided adhesive tape rolls for creating hydrophobic barriers.
- Electrode Inks: Carbon, Ag/AgCl, or other conductive inks for screen printing.
- Screen Mask: Containing the pre-designed pattern for the three-electrode system.
- Roll-to-Roll Apparatus: System comprising tape rolls, paper roll, and alignment rollers.
Table 2: Key Reagents for Tape-Paper Device Fabrication
| Item | Function in the Protocol |
|---|---|
| Screen-Printable Carbon Ink | Forms the working, counter, and reference electrodes for electrochemical detection. |
| Hydrophobic Adhesive Tape | Defines the microfluidic channel architecture and confines fluid flow. |
| Paper with Defined Porosity | Serves as the hydrophilic medium for passive fluid transport and reagent storage. |
| Nanomaterial Composites | Enhances electrochemical sensitivity and specificity for the target analyte. |
Step-by-Step Procedure
- Electrode Patterning: Pre-pattern the three-electrode system (working, counter, quasi-reference) onto a continuous paper roll using screen printing and conductive ink. Cure the ink as per manufacturer specifications [33].
- Tape Layer Preparation: Precisely cut the upper and lower adhesive tape rolls to form specific graphic cutouts that define the microfluidic channels and reaction zones.
- Roll-to-Roll Lamination: Feed the paper electrode roll and the pre-cut tape rolls through a series of clockwise-driven auxiliary rolls. The system simultaneously laminates the paper between the upper and lower tape layers, creating sealed devices with well-defined hydrophilic (paper) and hydrophobic (tape) regions.
- Individual Device Separation: The continuous roll of fabricated devices is then cut or torn at pre-defined perforations into individual, ready-to-use units.
The following workflow visualizes the roll-to-roll fabrication process:
Protocol 2: Reversible Bonding of PDMS Microfluidic Channels
This protocol outlines a touch-enabled, reversible bonding method for PDMS microfluidic substrates to SU-8 coated chips, enabling sensor regeneration and in-channel material sampling, which is valuable for assay development and validation [36].
Research Reagent Solutions & Materials
- PDMS Base and Curing Agent: Sylgard 184 kit or equivalent.
- SU-8 Coated Chip: The sensor chip with integrated electrodes.
- PDMS Mold: Fabricated via soft lithography with features for microchannels.
- Plasma Cleaner: (Optional, for irreversible bonding; not used in this reversible method).
Step-by-Step Procedure
- PDMS Substrate Fabrication: Mix PDMS base and curing agent (typically 10:1 ratio), degas the mixture in a vacuum desiccator, and pour it over a master mold. Cure at 65-80°C for 1-2 hours. Peel off the cured PDMS from the mold [19].
- Design for Reversibility: Design the PDMS substrate with fluid outlets located at the bottom (the bonding surface) rather than the top. This design is critical as it prevents the formation of a 'water column' that can weaken the bond and cause leakage [36].
- Manual Bonding: Simply place the PDMS substrate gently and manually onto the flat surface of the SU-8 coated sensor chip. No plasma treatment or chemical adhesives are required.
- Device Operation: The reversibly bonded device can withstand pressures of at least 5.1 MPa, allowing for long-term analyses and continuous flow operation [36].
- Disassembly and Reuse: After analysis, the PDMS substrate can be peeled off, allowing direct access to the sensor surface for characterization or regeneration. The same PDMS substrate can be rebonded multiple times (≥20 cycles) without significant loss of performance [36].
The decision logic for selecting a PDMS bonding strategy is summarized below:
Integration with Smartphone-Based Electrochemical Detection
Integrating these microfluidic substrates with a smartphone readout system creates a complete "sample-in, answer-out" platform for on-site drug residue testing. The general architecture involves:
- The Microfluidic Cartridge: A disposable device (fabricated from PDMS, paper, or tape) that handles the introduction of the sample (e.g., liquid food extract), its transport, and any necessary filtration or mixing with reagents.
- The Electrochemical Readout Circuit: A portable, handheld potentiostat that interfaces with the electrodes patterned within the microfluidic device. This potentiostat applies the necessary waveforms and measures the resulting electrochemical current.
- The Smartphone Interface: The potentiostat transmits data to a smartphone via Bluetooth or a direct audio/USB connection. A dedicated smartphone application controls the measurement parameters, processes the received data (e.g., calculating analyte concentration), and displays the result in a user-friendly format.
This integrated system aligns with the REASSURED criteria (Real-time connectivity, Ease of specimen collection, Affordable, Sensitive, Specific, User-friendly, Rapid and robust, Equipment-free, and Deliverable to end-users) for modern point-of-care diagnostics [19].
The quantitative detection of pharmaceuticals, including drug residues, is crucial for effective therapeutic drug monitoring, environmental conservation, and understanding complex biological mechanisms [37]. Electrochemical sensors have emerged as a powerful alternative to conventional techniques like chromatography and spectroscopy due to their affordability, rapid analysis, portability, and capacity to analyze complex physiological fluids such as serum, urine, and sweat [38]. The integration of advanced nanomaterials into these sensors is pivotal for enhancing their analytical performance. Nanomaterials, such as graphene oxide, carbon nanotubes, and gold nanoparticles, provide exceptional thermal, mechanical, optical, and electrical properties [39]. Their high surface area, exceptional electron transfer capabilities, and tunable surface chemistry significantly improve the sensitivity, selectivity, and overall functionality of electrochemical sensors, making them ideal for integration into Lab-on-Chip (LoC) platforms with smartphone readout for on-site drug residue analysis [39] [40] [38].
Performance of Nanomaterial-Based Electrodes
The modification of electrode surfaces with nanomaterials dramatically enhances sensor performance. The table below summarizes the detection capabilities of various nanomaterial-modified electrodes for different pharmaceutical compounds, demonstrating the low detection limits and wide linear ranges achievable.
Table 1: Performance of Nanomaterial-Modified Electrodes in Pharmaceutical Analysis
| Electrode Material | Analyte | Matrix | Method | Linear Dynamic Range | Limit of Detection (LOD) | Ref. |
|---|---|---|---|---|---|---|
| poly(EBT)/CPE[a] | Methdilazine HCl | Human Urine | SWV[b] | 0.1 - 50 µM | 25.7 nM | [38] |
| AgNPs[c]/CPE | Metronidazole | Milk, Tap Water | SWV | 1 - 1000 µM | 206 nM | [38] |
| [10%FG[d]/5%MW[e]] CPE | Ofloxacin | Urine, Tablets | SW-AdAS[f] | 0.60 - 15.0 nM | 0.18 nM | [38] |
| MIP[g]/CP ECL[h] Sensor | Azithromycin | Urine, Serum | ECL | 0.10 - 400 nM | 23 pM | [38] |
| Ce-MOF[i]/IL[j]/CPE | Ketoconazole | Pharmaceutical, Urine | DPV[k] | 0.1 - 110.0 µM | 40 nM | [38] |
| Fe₃O₄/ZIF-67[l]/ILCPE | Sulfamethoxazole | Urine, Water | DPV | 0.01 - 520.0 µM | 5.0 nM | [38] |
| Polydopamine/MWCNTs/GCE[m] | Metronidazole | - | DPV | - | Low nM range | [41] |
Footnotes: [a] CPE: Carbon Paste Electrode; [b] SWV: Square Wave Voltammetry; [c] AgNPs: Silver Nanoparticles; [d] FG: Flake Graphite; [e] MW: Multi-Walled Carbon Nanotubes; [f] SW-AdAS: Square Wave Adsorptive Anodic Stripping; [g] MIP: Molecularly Imprinted Polymer; [h] ECL: Electrochemiluminescence; [i] Ce-MOF: Cerium Metal-Organic Framework; [j] IL: Ionic Liquid; [k] DPV: Differential Pulse Voltammetry; [l] ZIF-67: Zeolitic Imidazolate Framework-67; [m] GCE: Glassy Carbon Electrode.
Properties and Functions of Key Nanomaterials
Different classes of nanomaterials offer distinct advantages for sensor design. Their unique properties can be leveraged to optimize electron transfer, increase surface area, and provide specific binding sites.
Table 2: Key Nanomaterial Classes and Their Functional Properties in Electrochemical Sensors
| Nanomaterial Class | Key Properties | Role in Electrochemical Sensing |
|---|---|---|
| Carbon Nanotubes (CNTs) | High electrical conductivity, large specific surface area, excellent mechanical strength, high porosity [38] [41]. | Facilitate electron transfer, increase electroactive surface area, adsorb analytes, can be functionalized with -COOH groups for biomolecule binding [38] [41]. |
| Graphene & Graphene Oxide | Exceptional electron transfer due to σ and π bonds, large potential window, high surface-to-volume ratio, tunable surface chemistry [38]. | Enhance sensitivity and selectivity, provide planar sites for redox reactions, serve as a scaffold for other nanomaterials [38]. |
| Metal Nanoparticles (e.g., Au, Ag) | High catalytic activity, good biocompatibility, high conductivity, surface plasmon resonance, ease of functionalization [38]. | Catalyze electrochemical reactions, lower overpotential, act as a platform for immobilizing biomolecules (aptamers, antibodies) [40] [38]. |
| Metal-Organic Frameworks (MOFs) | Extremely high surface area, tunable porosity, catalytic properties, and well-defined structures [39] [41]. | Pre-concentrate analytes, provide selective pores/sites for recognition, enhance stability and sensitivity when combined with electrodes [38]. |
| Metal Oxide Nanomaterials (e.g., CuO, ZrO₂) | High chemical stability, semiconductor properties, low-cost, ease of preparation [41]. | Catalyze specific reactions (e.g., for organophosphorus pesticides), improve sensor stability and selectivity [41]. |
Experimental Protocols
Protocol: Fabrication of a Nanocomposite-Modified Screen-Printed Electrode (SPE) for LoC Integration
This protocol details the preparation of a high-performance electrode suitable for integration into a microfluidic LoC device.
4.1.1. Reagents and Materials
- Screen-printed carbon electrodes (SPCEs)
- Functionalized multi-walled carbon nanotubes (MWCNTs-COOH)
- Graphene oxide (GO) dispersion in water (1 mg/mL)
- Hydrogen tetrachloroaurate(III) trihydrate (HAuCl₄·3H₂O)
- Phosphate buffer saline (PBS, 0.1 M, pH 7.4) as a supporting electrolyte
- Target drug standard (e.g., antibiotic or anticancer drug)
- Deionized water
4.1.2. Procedure
- Pre-treatment of SPCE: Activate the commercial SPCE by cycling the potential between 0 and +1.0 V (vs. internal Ag/AgCl reference) in 0.1 M PBS at a scan rate of 100 mV/s for 10 cycles.
- Electrodeposition of Gold Nanoparticles (AuNPs):
- Prepare a 0.5 mM HAuCl₄ solution in 0.1 M KCl.
- Using the pre-treated SPCE as the working electrode, perform amperometry at a constant potential of -0.4 V for 60 seconds under gentle stirring to deposit AuNPs onto the carbon surface.
- Rinse the modified electrode (now AuNPs/SPCE) thoroughly with deionized water.
- Drop-casting of MWCNT-GO Nanocomposite:
- Mix the MWCNT-COOH and GO dispersions in a 1:1 volume ratio and sonicate for 30 minutes to form a homogeneous nanocomposite.
- Pipette 5 µL of the nanocomposite dispersion directly onto the AuNPs/SPCE surface.
- Allow the electrode to dry under ambient conditions for 1 hour. The final sensor is designated as MWCNT-GO/AuNPs/SPCE.
Protocol: Electrochemical Detection of Drug Residues using DPV
This protocol describes the standard operation for quantifying drug concentrations using the modified sensor, a process that can be automated within an LoC system.
4.2.1. Reagents and Materials
- Fabricated MWCNT-GO/AuNPs/SPCE sensor
- Standard solutions of the target drug (e.g., antibiotic) at known concentrations
- Acetate buffer (0.1 M, pH 5.0) or PBS (0.1 M, pH 7.4) as measurement buffer
- Real samples (e.g., diluted serum, urine, or water samples)
4.2.2. Procedure
- Measurement Setup: Connect the modified SPCE to the potentiostat. Place a 50 µL droplet of the measurement buffer onto the sensor's three-electrode cell.
- Calibration Curve:
- Measure the standard solutions of the target drug in increasing concentration.
- For each measurement, using Differential Pulse Voltammetry (DPV), apply the following typical parameters: potential window from 0 to +1.0 V, pulse amplitude of 50 mV, pulse width of 50 ms, and scan rate of 20 mV/s.
- Record the DPV peak current response for each concentration.
- Plot the peak current (µA) versus drug concentration (nM or µM) to establish a calibration curve.
- Sample Analysis:
- Place a 50 µL droplet of the prepared real sample onto the sensor.
- Run the DPV measurement under the same optimized parameters.
- Use the calibration curve to determine the concentration of the target drug in the real sample based on the measured peak current.
Workflow Diagram: From Sensor Fabrication to Smartphone Readout
The following diagram illustrates the integrated workflow for an LoC-based electrochemical sensor with smartphone readout, incorporating the protocols above.
The Scientist's Toolkit: Essential Research Reagent Solutions
This table lists critical reagents and materials required for developing and operating nanomaterial-enhanced electrochemical sensors for drug monitoring.
Table 3: Essential Research Reagents and Materials for Sensor Development
| Reagent/Material | Function/Application | Key Characteristics |
|---|---|---|
| Screen-Printed Electrodes (SPEs) | Disposable, portable, and miniaturizable sensor platform. Ideal for LoC and on-site analysis [42] [38]. | Typically feature integrated working, reference, and counter electrodes. Carbon-based are common; gold and platinum also available. |
| Carbon Nanotubes (CNTs) | Enhance electron transfer and provide a high-surface-area scaffold for analyte adsorption and nanomaterial integration [38] [41]. | Functionalized (e.g., -COOH) versions improve dispersion and biomolecule immobilization. |
| Graphene Oxide (GO) | Increases the electroactive surface area and facilitates further modification due to its oxygen-containing functional groups [38]. | Can be chemically reduced to rGO (reduced GO) to further enhance conductivity. |
| Gold Nanoparticles (AuNPs) | Catalyze electrochemical reactions, improve conductivity, and serve as a platform for immobilizing recognition elements like aptamers [40] [38]. | Biocompatible and easily synthesized or electrodeposited. |
| Molecularly Imprinted Polymers (MIPs) | Synthetic receptors that provide high selectivity for a specific target drug molecule [39] [38]. | Create specific cavities complementary to the target analyte's shape, size, and functional groups. |
| Aptamers (DNA/RNA) | Biological recognition elements that bind to specific targets (antibiotics, cancer drugs) with high affinity [39]. | Offer high stability and selectivity for biosensor (aptasensor) configurations. |
| Ionic Liquids (ILs) | Used as binders/modifiers in carbon paste electrodes to enhance conductivity and stability [38]. | Provide a wide electrochemical window and low volatility. |
| Phosphate Buffer Saline (PBS) | A common supporting electrolyte that maintains a stable pH during electrochemical measurements, mimicking physiological conditions [42]. | Typically used at 0.1 M concentration, with pH adjusted to 7.4. |
The integration of nanomaterials like graphene oxide, carbon nanotubes, and gold nanoparticles into electrochemical sensors decisively enhances their sensitivity and selectivity for detecting drug residues. The structured protocols and performance data provided here serve as a foundation for developing robust sensing platforms. When combined with LoC architectures and smartphone readout systems, these nanomaterial-based sensors pave the way for decentralized, rapid, and on-site drug monitoring. Future directions in this field point towards the creation of fully integrated, multiplexed LoC devices for simultaneous multi-drug analysis, the incorporation of artificial intelligence for data analysis and prediction [43], and the continued development of novel nanocomposites and highly selective synthetic receptors to further push the limits of detection in complex biological and environmental matrices.
This application note provides a detailed protocol for the fabrication of an electrochemical Lab-on-a-Chip (LoC) device with integrated smartphone readout, specifically tailored for the detection of drug residues. The convergence of electrochemistry, microfluidics, and mobile technology enables powerful, portable, and cost-effective analytical tools for pharmaceutical and biomedical research [44] [45]. The system described herein leverages the principles of electrochemical sensing to quantify redox-active drug molecules, with the smartphone serving as both a potentiostat for controlling the electrochemical analysis and a data processor for presenting results [46] [47]. This guide is structured to lead researchers through a complete workflow, from initial chip design and electrode modification to the final integration with a custom smartphone application.
The diagram below illustrates the complete, end-to-end fabrication and operational workflow for the smartphone-integrated electrochemical LoC.
Research Reagent Solutions and Essential Materials
The following table catalogues the key reagents, materials, and instruments required for the fabrication and operation of the sensor system.
Table 1: Essential Materials and Reagents for Sensor Fabrication and Analysis
| Item Name | Function/Application | Example Specifications |
|---|---|---|
| Screen-Printed Electrodes (SPEs) | Disposable, low-cost electrochemical cell platform [44] [48]. | Three-electrode system: Carbon, Silver, or Gold working electrode; Carbon counter electrode; Silver/Silver Chloride reference electrode. |
| Nanomaterials (for Modification) | Enhance electrode surface area, electron transfer kinetics, and sensitivity [44] [48]. | Metal Nanoparticles (e.g., Au, Pt), Carbon Nanotubes (CNTs), Graphene, MXenes (Ti₃C₂Tₓ). |
| Biorecognition Elements | Provide high specificity for the target drug analyte [45]. | DNA aptamers, molecularly imprinted polymers (MIPs), or enzymes. |
| Electrochemical Probe | Generate measurable electrochemical signal. | Redox agents like [Fe(CN)₆]³⁻/⁴⁻ or Methylene Blue (MB). |
| Smartphone & Microcontroller | System control, data acquisition, and analysis [46] [47]. | Android or iOS smartphone with Bluetooth Low Energy (BLE) and an OTG-capable microcontroller (e.g., Arduino Nano). |
| Smartphone Application | User interface for initiating tests, visualizing data, and reporting results [46]. | Custom app developed in Android Studio (Kotlin/Java) or Xcode (Swift). |
Protocols for Chip Fabrication and Electrode Modification
Protocol: Fabrication of Low-Cost Sensor Chips
Objective: To fabricate a disposable, screen-printed electrochemical cell or a laser-induced graphene (LIG) electrode chip.
Materials: Conductive carbon ink, silver/silver chloride ink, polyimide or ceramic substrate, screen printer or CO₂ laser engraver.
Step-by-Step Procedure:
- Design and Mask Preparation: Design the three-electrode layout (working, counter, reference) using computer-aided design (CAD) software. For screen printing, convert the design into a stainless-steel or polyester mesh screen.
- Substrate Preparation: Clean the substrate (e.g., polyimide sheet) with ethanol and deionized water to ensure it is free of dust and organic contaminants.
- Screen Printing: a. Secure the substrate beneath the screen. b. Apply the conductive carbon ink and use a squeegee to spread it uniformly, forcing ink through the mesh onto the substrate. c. Cure the printed electrodes in an oven at 60-80°C for 30 minutes. d. Repeat the process with Ag/AgCl ink to print the reference electrode. e. Apply an insulating dielectric layer to define the exact electrode area and electrical contacts.
- Laser-Induced Graphene (LIG) Alternative: a. Place the polyimide film in the laser engraver. b. Use a CO₂ laser (e.g., 10-20 W power) to directly write the electrode pattern onto the film. The laser irradiation converts the polymer surface into porous graphene. c. Clean the resulting LIG electrodes with deionized water to remove any debris [18].
- Quality Control: Inspect the printed electrodes under a microscope for any discontinuities or shorts. Validate performance by running a cyclic voltammetry (CV) scan in a 5 mM [Fe(CN)₆]³⁻/⁴⁻ solution. A well-functioning electrode will show a characteristic, reversible redox peak pair.
Protocol: Nanomaterial-based Electrode Modification
Objective: To modify the working electrode surface with nanomaterials to significantly enhance its electrochemical performance for drug detection.
Materials: Graphene dispersion, carbon nanotube suspension, gold nanoparticle solution, phosphate buffer saline (PBS, 0.1 M, pH 7.4).
Step-by-Step Procedure:
- Electrode Pre-treatment: Clean the working electrode by performing 10 cycles of CV in 0.5 M H₂SO₄ (scan range: -0.5 V to +1.0 V vs. Ag/AgCl) to activate the surface. Rinse thoroughly with deionized water.
- Modification via Drop-Casting: a. Prepare a homogeneous dispersion of the nanomaterial (e.g., 1 mg/mL MXene in deionized water) [44] [48]. b. Pipette a precise volume (e.g., 5-10 µL) of the dispersion directly onto the active surface of the working electrode. c. Allow the electrode to dry under ambient conditions or in an incubator at 40°C for 30-60 minutes.
- Electrodeposition (for Metal NPs): a. Immerse the electrode in a solution containing metal ions (e.g., 1 mM HAuCl₄ in 0.1 M KCl). b. Apply a constant potential (e.g., -0.4 V for AuNPs) for a fixed duration (e.g., 60 seconds) to reduce the ions and deposit nanoparticles onto the electrode surface. c. Rise the modified electrode gently with deionized water to remove loosely bound particles.
- Characterization: Characterize the modified electrode using CV and electrochemical impedance spectroscopy (EIS) in a standard redox probe solution. A successful modification is indicated by a significant increase in peak current (CV) and a decrease in electron-transfer resistance (EIS).
Smartphone Integration and Data Analysis
System Architecture and Data Flow
The logical relationship and data flow between the LoC, external hardware, and the smartphone application is depicted below.
Protocol: Developing the Smartphone Application
Objective: To create a smartphone application that controls the electrochemical hardware, acquires data, and performs quantitative analysis.
Materials: Smartphone (Android/iOS), computer with development environment (Android Studio/Xcode), BLE-enabled microcontroller (e.g., Arduino Nano 33 BLE).
Step-by-Step Procedure:
- Establish Hardware Communication: a. Program the microcontroller to function as a simple potentiostat, capable of applying predefined potentials and measuring current. b. Implement a BLE service on the microcontroller to advertise itself and send/receive data packets. c. In the smartphone app, code a BLE manager to scan for, connect to, and communicate with the microcontroller.
- Design the User Interface (UI): a. Create a simple UI with buttons to select the electrochemical technique (e.g., DPV, CV). b. Include input fields for key parameters (e.g., initial/final potential, pulse amplitude for DPV). c. Design a view (e.g., a chart/graph) to display the resulting voltammogram in real-time.
- Implement Data Analysis Algorithms: a. Develop an algorithm (e.g., in C++ or Java) for peak detection in the voltammogram. b. Integrate a calibration model that converts the peak current (or charge) into a drug concentration. This can be a simple linear regression or a more complex machine learning model [47]. c. Code the functionality to save results, along with metadata (timestamp, sample ID), and generate reports that can be shared via email or cloud services [46].
Performance Evaluation and Analytical Validation
The analytical performance of the fabricated sensor for drug detection should be rigorously validated against standard methods. The following table summarizes typical target performance metrics for such a system.
Table 2: Key Analytical Performance Metrics for Drug Residue Detection
| Performance Parameter | Target Value / Typical Result | Experimental Protocol |
|---|---|---|
| Limit of Detection (LOD) | Sub-micromolar to nanomolar range [48]. | Measure the response for blank and low-concentration samples. LOD = 3.3 × (Standard Deviation of Blank / Slope of Calibration Curve). |
| Linear Dynamic Range | 2-3 orders of magnitude [48]. | Analyze a series of standard solutions with known concentrations. Plot signal (e.g., peak current) vs. concentration and perform linear regression. |
| Selectivity | >80% recovery in the presence of interferents. | Test the sensor response in the presence of common interferents (e.g., ascorbic acid, uric acid, structurally similar drugs). |
| Reproducibility (RSD) | <5% (Intra-assay), <10% (Inter-assay) [46]. | Perform repeated measurements (n≥3) on the same day (intra-) and over different days (inter-) using independently fabricated sensor chips. |
| Analysis Time | Seconds to a few minutes [44]. | Time the duration from sample application to result display on the smartphone. |
Troubleshooting Guide
Table 3: Common Fabrication and Integration Challenges
| Problem | Possible Cause | Solution |
|---|---|---|
| High background noise in signal. | Unstable electrical connections; contaminated electrodes. | Check all wiring and contacts. Re-clean the electrode surface. |
| Poor reproducibility between sensors. | Inconsistent electrode modification; variations in drop-casted volume. | Standardize the modification protocol; use a precision micropipette. |
| No signal/BLE connection failure. | Incorrect wiring; dead battery; software bugs. | Verify the circuit; charge the devices; debug the app and microcontroller code. |
| Low sensitivity. | Inadequate nanomaterial coverage; passivation of electrode surface. | Optimize the modification procedure; incorporate more effective signal amplification strategies. |
The detection of antibiotic residues, such as chloramphenicol (CAP), in complex biological and food matrices is a critical challenge in food safety, environmental monitoring, and clinical diagnostics. CAP is a broad-spectrum antibiotic whose use in food-producing animals is banned in many regions due to serious toxicological effects, including dose-dependent bone marrow suppression, aplastic anemia, and gray baby syndrome in neonates [49]. Despite these bans, its low cost and high efficacy lead to ongoing illicit use, creating a pressing need for highly sensitive and selective detection methods to monitor CAP residues at trace levels [5] [50].
Traditional analytical techniques for CAP detection, including high-performance liquid chromatography (HPLC) and liquid chromatography-tandem mass spectrometry (LC-MS/MS), are highly sensitive but are also time-consuming, expensive, and require complex sample preparation and centralized laboratory facilities [49] [5]. These limitations restrict their utility for rapid, on-site screening. In contrast, electrochemical biosensors, particularly when integrated into lab-on-a-chip (LoC) systems with smartphone readout, present a promising alternative. These systems merge the high sensitivity and selectivity of electrochemical detection with the portability, data processing power, and connectivity of smartphones, enabling decentralized, user-friendly, and real-time point-of-care testing (POCT) [1] [51].
This case study focuses on the application of a smartphone-powered electrochemical platform for detecting CAP in complex matrices like milk and human blood serum, framed within broader research on LoC sensors for drug residue analysis. It details the working principles, experimental protocols, and performance data of a specific sensor utilizing a graphene oxide and multi-walled carbon nanotube (GO@MWCNT) nanocomposite [5].
Working Principle and Sensor Design
Electrochemical Detection Mechanism
Chloramphenicol is an electroactive molecule due to the presence of a nitro group (-NO₂) in its structure. The fundamental detection principle relies on the electro-reduction of this nitro group to a hydroxylamine group on the surface of the modified working electrode. This reduction reaction involves a transfer of electrons, generating a measurable change in current [5] [52]. The general reaction scheme is:
CAP-NO₂ + 4e⁻ + 4H⁺ → CAP-NHOH + H₂O
The magnitude of the resulting reduction current, typically quantified using techniques like Differential Pulse Voltammetry (DPV), is directly proportional to the concentration of CAP in the sample [5].
The Role of Nanomaterial Modification
A bare glassy carbon electrode (GCE) exhibits a poor electrochemical response to CAP. To enhance sensitivity and selectivity, the electrode surface is modified with a nanocomposite. The GO@MWCNT nanocomposite is highly effective for this purpose [5]:
- Graphene Oxide (GO): Provides a large surface area with abundant oxygen-containing functional groups (e.g., -COOH, -OH) that facilitate the stable immobilization of the composite and enhance the pre-concentration of the analyte near the electrode surface.
- Multi-Walled Carbon Nanotubes (MWCNTs): Offer excellent electrical conductivity, high mechanical strength, and a network that prevents the restacking of GO sheets. This combination significantly improves the electron transfer kinetics of the electrochemical reaction.
The synergistic effect between GO and MWCNTs results in superior electrocatalytic activity towards the reduction of CAP, leading to a lower detection limit and higher sensitivity [5].
System Integration: From LoC to Smartphone
The complete sensing platform integrates the biochemical sensor with a miniaturized electronic readout and a smartphone, creating a portable lab-on-a-chip system.
Diagram 1: Workflow of the smartphone-integrated electrochemical sensing platform.
The core of the system is a disposable screen-printed carbon electrode (SPCE) or a modified GCE, which is part of a miniaturized electrochemical cell. This cell is connected to a pocket-sized potentiostat (e.g., PalmSens) that controls the applied voltage and measures the resulting current. The potentiostat communicates wirelessly via Bluetooth with a smartphone running a dedicated application. The app controls the experiment parameters, displays the results in real-time, and can further process the data, store it, or transmit it to the cloud [5] [26]. This integration transforms the smartphone into a powerful, portable analytical device.
Experimental Protocols
Synthesis of GO@MWCNT Nanocomposite
The following protocol is adapted from Dogra et al. [5]:
- Purification of MWCNTs: Disperse 100 mg of pristine MWCNTs in 50 mL of a 3:1 mixture of concentrated H₂SO₄ and HNO₃. Sonicate the mixture for 4 hours at 60°C to remove metallic impurities and introduce carboxylic acid groups. Cool to room temperature, dilute with deionized (DI) water, and vacuum-filter through a 0.22 μm polycarbonate membrane. Wash the residue thoroughly with DI water until the filtrate reaches neutral pH. Dry the purified MWCNTs in a vacuum oven at 60°C overnight.
- Preparation of GO: Synthesize graphene oxide from graphite powder using a modified Hummers' method.
- Nanocomposite Formation: Dispense 5 mg of purified MWCNTs and 5 mg of GO into 10 mL of DI water. Sonicate the mixture for 1 hour to achieve a homogeneous black dispersion. The strong π-π stacking interactions between the MWCNTs and GO sheets facilitate the formation of a stable GO@MWCNT nanocomposite.
Electrode Modification
- Electrode Pretreatment: Polish a glassy carbon electrode (GCE, 3 mm diameter) successively with 1.0, 0.3, and 0.05 μm alumina slurry on a microcloth. Rinse thoroughly with DI water and ethanol between each polishing step. Perform electrochemical cleaning by cycling the electrode in 0.5 M H₂SO₄ via cyclic voltammetry (CV) until a stable voltammogram is obtained.
- Modification with GO@MWCNT: Deposit 5 μL of the freshly prepared GO@MWCNT dispersion onto the clean, polished surface of the GCE. Allow it to dry under an infrared lamp or at room temperature to form a uniform film. The modified electrode is denoted as GO@MWCNT/GCE. For field deployment, disposable screen-printed carbon electrodes (SPCEs) can be modified using the same drop-casting method.
Sample Preparation
- Milk Samples: Spiked milk samples are prepared by adding a known volume of standard CAP solution to drug-free milk. To remove proteins and fats, the samples are centrifuged at 10,000 rpm for 10 minutes. The supernatant is then filtered through a 0.22 μm membrane filter and diluted with the supporting electrolyte (0.2 M phosphate buffer saline, PBS, pH 7.0) before analysis [5] [50].
- Human Blood Serum: Commercial human serum samples are used without further purification. The samples are spiked with known concentrations of CAP and diluted 1:1 with 0.2 M PBS (pH 7.0) to minimize matrix effects [5].
Electrochemical Measurement and On-Site Analysis
- Setup Assembly: Connect the GO@MWCNT/GCE (or modified SPCE) to the portable potentiostat as the working electrode, along with an Ag/AgCl reference electrode and a platinum wire counter electrode (if using a traditional three-electrode system). For SPCEs, all three electrodes are integrated on the same chip.
- Smartphone Connection: Power on the PalmSens potentiostat and enable Bluetooth on the smartphone. Launch the dedicated application (e.g., PS Touch) and pair the device.
- Data Acquisition: Immerse the electrode system in an electrochemical cell containing 10 mL of the prepared sample in 0.2 M PBS (pH 7.0). Through the smartphone app, initiate the Differential Pulse Voltammetry (DPV) measurement with the following typical parameters:
- Potential window: -0.2 V to -0.8 V (vs. Ag/AgCl)
- Modulation amplitude: 50 mV
- Step potential: 4 mV
- Pulse width: 0.05 s
- Result Interpretation: The smartphone app records and displays the DPV curve in real-time. The characteristic cathodic peak for CAP reduction appears around -0.6 V. The app can automatically plot a calibration curve (peak current vs. concentration) and calculate the unknown concentration of CAP in the sample.
Results and Data Analysis
Analytical Performance of the GO@MWCNT Sensor
The performance of the smartphone-integrated GO@MWCNT sensor for CAP detection is summarized in the table below, which consolidates data from recent studies.
Table 1: Analytical performance of the smartphone-assisted electrochemical sensor for CAP detection.
| Performance Parameter | GO@MWCNT/GCE [5] | C-BN/GCE [52] | Aptamer-SPR [50] |
|---|---|---|---|
| Detection Principle | Electrochemical Reduction | Electrochemical Reduction | Surface Plasmon Resonance |
| Linear Range (μM) | 0 - 600 | 0.1 - 200 & 200 - 700 | Not Specified |
| Limit of Detection (LOD) | 46 nM | 35 nM | Low nM range (inferred) |
| Sensitivity | 1.71 μA μM⁻¹ cm⁻² | Not Specified | Not Specified |
| Stability | ~90% signal retention after 21 days | Desired stability reported | Good |
| Reproducibility (RSD) | < 3% | Not Specified | Good |
| Tested Matrices | Milk, tap water, eye drops, capsules, human serum | Human serum, eye drops | Milk |
The data demonstrates that the GO@MWCNT sensor offers a wide linear range, a low detection limit, and excellent stability and reproducibility. The LOD of 46 nM is well below the required regulatory limits for CAP, which often call for zero tolerance [5].
Selectivity, Real-Sample Analysis, and Validation
A critical aspect of sensor performance is its ability to function accurately in complex, real-world samples.
- Selectivity: The GO@MWCNT sensor showed excellent anti-interference properties. The DPV response for CAP remained unaffected by the presence of common interfering substances such as ascorbic acid, glucose, uric acid, cysteine, and metal ions (Fe²⁺, Cu²⁺) [5].
- Recovery in Real Samples: The sensor was successfully applied to detect CAP in spiked milk and human serum samples. Recovery rates were consistently in the range of 95–105%, indicating high accuracy and minimal matrix effect when proper sample preparation (dilution) is employed [5].
- Validation: The results obtained from the smartphone-assisted pocket potentiostat showed a strong correlation with those from a conventional, laboratory-grade Autolab potentiostat, validating the reliability of the portable platform for quantitative analysis [5].
The Scientist's Toolkit: Essential Research Reagents and Materials
Table 2: Key reagents and materials for fabricating and operating the electrochemical CAP sensor.
| Item | Function / Role in the Experiment |
|---|---|
| Chloramphenicol (CAP) | Target analyte; standard solutions are used for calibration and spiking experiments. |
| Graphene Oxide (GO) | Nanomaterial for electrode modification; provides a large surface area and functional groups for enhanced sensing. |
| Multi-Walled Carbon Nanutbes (MWCNTs) | Nanomaterial for electrode modification; improves electrical conductivity and electron transfer kinetics. |
| Glassy Carbon Electrode (GCE) | A conventional working electrode substrate that provides a clean, reproducible surface for modification. |
| Screen-Printed Carbon Electrode (SPCE) | Disposable, miniaturized, and integrated electrode system ideal for portable, single-use field testing. |
| Phosphate Buffered Saline (PBS) | Supporting electrolyte; provides a stable ionic strength and pH (typically 7.0) for the electrochemical reaction. |
| Portable Potentiostat (e.g., PalmSens) | Miniaturized electronic instrument that applies potential and measures current; enables portability. |
| Smartphone with Dedicated App | Serves as the user interface, data processor, and display unit; enables wireless control and result visualization. |
This case study demonstrates the successful development and application of a wireless, portable, and smartphone-assisted electrochemical platform for the on-site detection of chloramphenicol. The integration of a highly electrocatalytic GO@MWCNT nanocomposite with a pocket-sized potentiostat and smartphone readout addresses the critical need for rapid, sensitive, and user-friendly monitoring of antibiotic residues.
The platform's excellent analytical performance in complex matrices like milk and human serum, coupled with its cost-effectiveness and portability, underscores its significant potential as a point-of-care diagnostic tool. This system embodies the core objectives of modern sensing: moving analysis from the central laboratory directly to the field, farm, or clinic. It provides a robust model for the future development of LoC electrochemical sensors for a wide array of drug residues and other contaminants, ultimately contributing to enhanced food safety, public health, and regulatory compliance.
This application note details a standardized protocol for the on-site operation of a Lab-on-a-Chip (LoC) electrochemical sensor integrated with a smartphone readout, specifically developed for the detection of drug residues. The miniaturization and automation of analytical processes onto a single microfluidic platform enable precise, rapid, and sensitive analysis directly in the field, moving beyond traditional, laboratory-bound methods [1]. These systems are particularly valuable for ensuring food safety and regulatory compliance, providing a cost-effective and user-friendly solution for on-site monitoring [1] [53].
The core of this technology combines the portability and computational power of smartphones with the high sensitivity of electrochemical biosensors. Smartphones serve as controllers, analyzers, and display units, significantly streamlining the design and reducing the overall cost of the sensing system [54]. This protocol covers the critical operational stages: sample introduction into the microfluidic LoC, automated electrochemical analysis, and subsequent data interpretation via the smartphone application, providing a complete framework for reliable on-site drug residue analysis.
Materials and Reagent Solutions
Key Research Reagent Solutions
The following reagents and materials are essential for the fabrication and operation of the smartphone-based electrochemical LoC for drug residue analysis.
Table 1: Essential Research Reagents and Materials
| Item | Function/Description |
|---|---|
| Gold Nanoparticles (AuNPs) | Nanomaterial used to modify electrodes; provides a large surface area for immobilizing biological recognition elements (e.g., aptamers, antibodies) and enhances electrical conductivity for superior signal amplification [1]. |
| Graphene Oxide (GO) & Reduced GO (rGO) | A two-dimensional nanomaterial with a high surface area and oxygen-containing functional groups for stable probe immobilization. rGO offers restored conductivity, accelerating electron transfer and increasing sensor sensitivity [1]. |
| Aptamers | Single-stranded DNA or RNA oligonucleotides that serve as synthetic recognition elements; selected for high specificity and affinity to target drug residues. They are often immobilized on the electrode surface [1]. |
| Electrochemical Redox Probes | Molecules such as ferricyanide/ferrocyanide used in solution to facilitate electron transfer in voltammetric measurements, enabling the quantification of the binding event on the sensor surface. |
| Phosphate Buffered Saline (PBS) | A common buffer solution used to maintain a stable pH and ionic strength during electrochemical analysis, ensuring consistent and reliable sensor performance. |
| Calcium Alginate Hydrogel | A biocompatible matrix used in some LoC designs for enzyme immobilization (e.g., horseradish peroxidase) and to retain cellular fractions in complex samples like whole blood, allowing for selective analyte detection [55]. |
Instrumentation and Hardware
- Smartphone-based µPotentiostat: A compact, printed circuit board (PCB) that provides the necessary circuitry for potentiostatic control and signal digitization. It is typically powered and controlled via a smartphone's USB port [55].
- Lab-on-a-Chip (LoC) Device: A disposable or reusable microfluidic chip integrating microfabricated electrodes (e.g., Pt, Au) and fluidic channels for sample handling and analysis [1] [55].
- Smartphone: Runs the custom application for device control, data acquisition, and analysis. It provides computational power, a user-friendly interface, and wireless connectivity for data transmission [1] [54].
Experimental Protocol
The following diagram illustrates the complete operational workflow for on-site analysis, from sample collection to result interpretation.
Step-by-Step Procedure
- Sample Collection: Collect the target sample (e.g., liquid food extract, environmental swab eluent, or whole blood) using an appropriate method. For surfaces, use a cotton swab for sampling [56].
- Sample Loading: Using a micropipette, introduce a precise volume of the sample (typically 40 µL or as optimized for the specific LoC design) into the sample inlet port of the disposable LoC device [55].
- Microfluidic Handling: Upon loading, the microfluidic structures within the LoC, often made of polymers like methacrylate, manage fluid transport via capillary action or externally applied pressure [55]. The sample automatically flows to the electrochemical detection chamber, which may incorporate membranes (e.g., calcium alginate hydrogel) to filter out interfering components like cells in whole blood [55].
Step 2: Automated Electrochemical Analysis
- System Connection: Connect the smartphone-integrated µPotentiostat to the smartphone via USB. Ensure the LoC device is securely inserted into the potentiostat's docking port.
- Initiate Analysis: Launch the dedicated smartphone application. Select the pre-programmed electrochemical technique:
- Automated Measurement: The application sends instructions to the µPotentiostat, which applies the appropriate potential sequence to the working electrode in the LoC. The subsequent electrochemical current is measured, digitized by the compact PCB circuitry and the smartphone's resources, and recorded by the application [55]. This process is fully automated and requires no further user intervention.
Step 3: Data Interpretation and Reporting
- Signal Processing: The smartphone application processes the raw digital signal (e.g., the current transient in chronoamperometry). It performs smoothing and baseline correction to enhance the signal-to-noise ratio.
- Quantification: The processed signal (e.g., steady-state current) is automatically compared against a stored calibration curve (Analyte Concentration vs. Current). This curve, previously established using standard solutions, allows the application to calculate and display the concentration of the target drug residue in the sample.
- Result Display and Storage: The quantitative result is clearly displayed on the smartphone screen. The application can also generate a brief report, which can be stored locally on the device or transmitted wirelessly to a cloud database for further analysis and record-keeping [1] [54].
Data Analysis and Presentation
Key Analytical Performance Metrics
The performance of the LoC-sensor system is evaluated against standard validation parameters. The following table summarizes typical target performance characteristics for a robust on-site sensor.
Table 2: Key Performance Metrics for On-Site Drug Residue Sensor
| Parameter | Target Performance | Method of Calculation/Explanation |
|---|---|---|
| Limit of Detection (LoD) | < 1 ng/cm² or µg/L | Determined from the calibration curve as 3.3 × σ/S, where σ is the standard deviation of the blank and S is the slope of the calibration curve [56]. |
| Limit of Quantification (LoQ) | < 5 ng/cm² or µg/L | Determined from the calibration curve as 10 × σ/S, representing the lowest concentration that can be quantitatively measured with acceptable precision and accuracy [56]. |
| Linear Dynamic Range | 2-3 orders of magnitude | The concentration range over which the sensor response is linearly proportional to the analyte concentration, verified by a high coefficient of determination (R² > 0.99). |
| Intra-day Precision (Repeatability) | RSD < 10% [56] | Relative Standard Deviation (RSD) of multiple measurements (n ≥ 3) performed on the same day and with the same device. |
| Inter-day Precision (Reproducibility) | RSD < 15% [56] | RSD of measurements performed on different days and/or with different devices to assess long-term stability. |
| Accuracy (Recovery) | 80-125% [56] | Evaluated by spiking a known amount of analyte into a real sample matrix and measuring the recovery percentage. |
| Analysis Time | < 10 minutes | Total time from sample introduction to final result display. |
Data Flow and Interpretation Logic
The internal logic for converting a raw electrochemical signal into a quantitative result and an actionable decision is outlined below.
Troubleshooting and Optimization
- Low Signal-to-Noise Ratio: Ensure all electrical connections are secure. Verify the freshness and activity of the biological recognition elements (aptamers/antibodies) immobilized on the electrode. Check the integrity of the nanomaterial modification on the electrode surface [1].
- Poor Reproducibility: Standardize the sample preparation and introduction protocol to minimize variations. Confirm consistent microfluidic filling. Check for bubbles trapped in the microchannels and ensure the LoC is stored and used within its shelf life.
- High Background Signal: This may indicate non-specific adsorption or fouling of the electrode surface, a known challenge with electrochemical detection [1]. Optimize the composition of the sample dilution buffer (e.g., add blocking agents like BSA) to minimize non-specific binding.
- Device Connection Failure: Restart the smartphone application and reconnect the µPotentiostat. Inspect the USB port and cable for physical damage. Ensure the smartphone provides adequate power output.
Overcoming Practical Hurdles: Sensitivity, Selectivity, and Real-World Reliability
Mitigating Biofouling and Non-Specific Adsorption in Complex Samples
Biofouling and non-specific adsorption (NSA) present significant challenges in the development of robust electrochemical Lab-on-a-Chip (LoC) platforms, particularly for the detection of drug residues in complex matrices such as food, environmental, and biological samples. These phenomena lead to the undesirable accumulation of non-target molecules (e.g., proteins, lipids, carbohydrates) on sensor surfaces, causing increased background noise, signal suppression, decreased sensitivity, and poor reproducibility [57] [58]. For electrochemical biosensors, which are highly susceptible to surface fouling due to direct interaction with the sample, mitigating NSA is crucial for achieving reliable on-site analysis [2]. This document outlines practical strategies and detailed protocols to suppress interfacial fouling, enabling the development of high-fidelity, smartphone-integrated electrochemical sensors for drug residue monitoring.
Strategies to combat biofouling and NSA can be broadly classified into two categories: passive methods (surface coatings that prevent adhesion) and active methods (applying external energy or forces to remove adsorbed species) [57]. The choice of strategy depends on the sensor platform, sample matrix, and required operational lifetime. The table below summarizes the primary methods.
Table 1: Strategies for Mitigating Biofouling and Non-Specific Adsorption
| Method Category | Specific Technique | Mechanism of Action | Ideal Use Case | Key Considerations |
|---|---|---|---|---|
| Passive (Surface Coatings) | Protein Blockers (e.g., BSA, Casein) | Adsorbs to vacant surface sites, preventing further non-specific binding [57]. | Rapid, simple blocking for single-use sensors (e.g., paper-based devices) [57]. | Can be susceptible to displacement; may not be suitable for long-term assays. |
| Polymer Brushes (e.g., PEG, Zwitterions) | Creates a hydrated, steric, and energetic barrier that repels biomolecules [58]. | Creating non-fouling surfaces on reusable or implantable sensors. | Requires chemical grafting; performance depends on chain length and density. | |
| Hydrogels & Sol-Gels | Forms a physical porous barrier that limits diffusion of large fouling agents to the electrode surface [58]. | Protecting underlying electrode catalysis in complex media. | Can increase response time due to diffusion limitations; requires optimization of porosity. | |
| Molecularly Imprinted Polymers (MIPs) | Provides synthetic cavities with high shape and chemical complementarity to the target analyte, enhancing selectivity [59] [60]. | Selective extraction and sensing of specific drug residues in complex samples. | Non-specific binding can occur on external polymer surfaces; requires surfactant treatment for optimal performance [60]. | |
| Active (Removal Methods) | Electrochemical Cleaning | Application of cathodic/anodic potentials or pulses to desorb foulants via electrostatic repulsion or gas bubble formation [58]. | In-situ regeneration of electrode surfaces between measurements. | Risk of damaging sensitive surface modifications or electrocatalysts. |
| Hydrodynamic Removal | Uses fluid flow in microchannels to generate shear forces that shear away weakly adhered molecules [57]. | Integrated cleaning within microfluidic LoC devices. | Requires integrated microfluidic pumps and channels. |
The following workflow diagram illustrates the decision-making process for selecting and implementing an appropriate mitigation strategy.
Experimental Protocols
Protocol 1: Silicate Sol-Gel Anti-Fouling Coating for Long-Term Stability
This protocol describes the application of a silicate sol-gel layer, which was identified as one of the most effective coatings for sustaining sensor performance during prolonged incubation in complex media, with signals still detectable after 6 weeks [58].
Research Reagent Solutions:
- Precursor Solution: Tetraethoxysilane (TEOS) in ethanol.
- Catalyst Solution: Hydrochloric acid (HCl) or ammonium hydroxide (NH₄OH) in water/ethanol.
- Solvent: Absolute ethanol.
Procedure:
- Electrode Pretreatment: Clean and polish the working electrode (e.g., glassy carbon, screen-printed carbon) according to standard procedures. For pencil lead electrodes, polish on sandpaper followed by an alumina slurry [58].
- Sol Preparation: Mix the precursor solution, solvent, and catalyst solution in a molar ratio optimized for your application (e.g., 1:4:0.01 TEOS:EtOH:HCl). Vortex the mixture thoroughly.
- Hydrolysis and Condensation: Allow the sol mixture to hydrolyze under constant stirring for 1 hour at room temperature.
- Coating Deposition: Deposit a small, controlled volume (e.g., 5-10 µL) of the prepared sol onto the active surface of the working electrode.
- Gelation and Aging: Allow the deposited sol to gel and age at room temperature for 24 hours in a sealed container to prevent rapid solvent evaporation and crack formation.
- Drying and Curing: Gradually dry the coated electrode at an elevated temperature (e.g., 50-80°C) for 2-4 hours to complete the polycondensation process and form a robust, porous silicate network.
- Validation: Validate the coating's performance and its impact on the sensor's electrochemical properties using a redox mediator, such as syringaldazine, in buffer and complex media over time [58].
Protocol 2: Surfactant Modification of Molecularly Imprinted Polymers (MIPs) to Eliminate NSA
This protocol details the electrostatic modification of MIPs with surfactants to suppress non-specific binding on the polymer's external surface, dramatically enhancing selectivity for the target analyte [60].
Research Reagent Solutions:
- MIP Particles: Synthesized for your target drug residue (e.g., Sulfamethoxazole) via bulk or precipitation polymerization.
- Surfactant Solutions: 1% (w/v) Sodium Dodecyl Sulfate (SDS) for positively charged MIPs or 1% (w/v) Cetyl Trimethyl Ammonium Bromide (CTAB) for negatively charged MIPs in deionized water.
- Washing Buffer: A mild buffer such as phosphate-buffered saline (PBS), pH 7.4.
Procedure:
- MIP Preparation: Synthesize and wash your MIP particles as required, ensuring complete template molecule removal.
- Surfactant Incubation: Incubate the MIP particles in the appropriate surfactant solution (SDS or CTAB) for 1-2 hours with gentle agitation. The surfactant concentration should be optimized to ensure complete reaction with external functional groups without disrupting the specific imprinted cavities [60].
- Washing: Centrifuge the MIP suspension and carefully remove the supernatant. Wash the pellet with washing buffer 2-3 times to remove any unbound surfactant.
- Sensor Integration: Immobilize the surfactant-modified MIPs (MIP±-SDS/CTAB) onto your electrochemical transducer. This can be achieved by drop-casting a MIP suspension onto a screen-printed electrode or embedding MIPs within an ink.
- Performance Evaluation: Analyze the binding isotherms and adsorption kinetics of the target molecule on the modified sensor. The calibration should show a significant reduction in signal from non-specific components compared to an unmodified MIP [60].
The Scientist's Toolkit
Table 2: Essential Reagents and Materials for Anti-Fouling Sensor Development
| Item | Function/Benefit | Example Application in Protocols |
|---|---|---|
| Bovine Serum Albumin (BSA) | A common blocker protein that passively adsorbs to hydrophobic surfaces, reducing NSA [57]. | Used in rapid, single-use sensor preparation to block vacant sites on electrodes or paper substrates. |
| Poly(Ethylene Glycol) (PEG) | Forms a hydrated polymer brush that creates a steric and energetic barrier to protein adsorption [58]. | Grafted onto electrode surfaces to create a non-fouling background for biorecognition elements. |
| Tetraethoxysilane (TEOS) | A key precursor for forming silicate sol-gel layers that act as protective, porous physical barriers [58]. | Primary reagent in Protocol 1 for creating a long-term stable anti-fouling coating. |
| Molecularly Imprinted Polymer (MIP) | Synthetic polymer with high-affinity cavities for a specific target, providing superior selectivity [59] [60]. | The core recognition element in Protocol 2, modified with surfactants to eliminate NSA. |
| Sodium Dodecyl Sulfate (SDS) | Anionic surfactant used to react with and block positively charged functional groups on MIPs outside the imprinted cavities [60]. | Key reagent in Protocol 2 for modifying MIPs to suppress non-specific binding. |
| Cetyl Trimethyl Ammonium Bromide (CTAB) | Cationic surfactant used to react with and block negatively charged external functional groups on MIPs [60]. | Key reagent in Protocol 2 for modifying certain types of MIPs. |
| Syringaldazine | A redox mediator that easily adsorbs onto carbon surfaces and is sensitive to surface fouling, serving as a model catalyst for testing anti-fouling coatings [58]. | Used for validating the protective effect of coatings in Protocol 1 without damaging the catalyst. |
Integration with Smartphone LoC Platform
The ultimate goal is to deploy these mitigation strategies within a portable, self-contained analysis system. Lab-on-PCB technology provides an ideal platform for this integration, offering a cost-effective and scalable substrate for seamlessly combining microfluidics, electrodes, and electronic components [61]. The workflow for an integrated device is as follows:
The smartphone serves as the user interface, providing power management, data processing, and result visualization. It can run a custom application that not only displays the concentration of the target drug residue but can also trigger integrated active cleaning protocols (e.g., applying a cleaning potential) between measurements to ensure sensor regenerability [26] [2]. This integrated approach, combining advanced anti-fouling materials with a portable, intelligent platform, enables reliable and sensitive on-site detection of drug residues in agri-food and environmental samples.
Strategies for Enhancing Sensor Stability and Reproducibility
For researchers developing electrochemical Lab-on-a-Chip (LoC) platforms with smartphone readouts for detecting drug residues, the journey from a proof-of-concept in the laboratory to a reliable, field-deployable tool is fraught with challenges related to sensor stability and reproducibility. These parameters are critical for generating trustworthy data that can be used in drug development and forensic analysis, where quantitative accuracy is paramount. Instability, often observed as signal drift, and poor reproducibility, manifesting as significant device-to-device variation, can undermine the analytical performance of even the most sensitive sensors [62] [63]. This document outlines targeted strategies, from nanomaterial selection to data processing, to overcome these hurdles and enhance the robustness of your electrochemical sensing systems.
Material and Nanocomposite Strategies
The foundation of a stable and reproducible sensor is a carefully engineered sensing interface. The choice and integration of nanomaterials directly influence key performance metrics, including electron transfer kinetics, active surface area, and the stability of the immobilized recognition elements.
Table 1: Nanomaterial Strategies for Enhanced Sensor Performance
| Strategy | Key Materials | Impact on Stability & Reproducibility | Exemplary Performance |
|---|---|---|---|
| Carbon Nanomaterial Hybrids | Graphene Oxide (GO) & Multi-Walled Carbon Nanotubes (MWCNTs) | π-π stacking between GO and MWCNTs enables stable, homogeneous dispersion. Synergistic effect improves electrocatalytic activity and electrical conductivity [5]. | ~90% signal retention after 21 days; RSD <3% for reproducibility [5]. |
| Conductive Composites | Graphitic Carbon Nitride (g-C₃N₄) with CNTs | CNTs mitigate the poor inherent conductivity of g-C₃N₄. The composite provides a high surface area and abundant active sites, enhancing sensitivity and stability [64]. | Effective simultaneous detection of morphine and methadone in urine with RSD of 3.71-5.26% [64]. |
| Nanomaterial Networks | Single-Walled Carbon Nanotube (SWCNT) Networks | Using networks of SWCNTs, rather than individual nanotubes, averages out the global properties of many nanotubes, leading to higher uniformity, larger sensing area, and better reproducibility [62]. | Improved device-to-device uniformity and error tolerance compared to single-NT devices [62]. |
Experimental Protocols for Characterization and Validation
Rigorous and standardized experimental protocols are essential for accurately assessing and ensuring the stability and reproducibility of fabricated sensors.
Protocol for Assessing Sensor Reproducibility
Objective: To quantify the device-to-device and run-to-run variation of the sensor response.
- Sensor Fabrication: Fabricate a minimum of five (n≥5) independent sensors (e.g., screen-printed electrodes modified with the nanocomposite) following the identical procedure.
- Standard Solution Preparation: Prepare a fresh standard solution of the target analyte (e.g., Chloramphenicol at 100 µM) in a suitable buffer (e.g., 0.1 M PBS, pH 7.4).
- Electrochemical Measurement: Using each sensor, perform the quantitative technique (e.g., Differential Pulse Voltammetry (DPV) or Cyclic Voltammetry (CV)) with the standard solution. Use the same potentiostat and smartphone readout system (e.g., PalmSens with PS Touch app) for all measurements [5].
- Data Analysis: Record the peak current or charge transfer for each sensor.
Protocol for Evaluating Sensor Stability
Objective: To determine the sensor's ability to maintain its response over time.
- Initial Measurement: Measure the electrochemical response (e.g., DPV peak current) of a freshly prepared sensor to a standard analyte solution.
- Storage: Store the sensor under defined conditions (e.g., dry, at 4°C in a desiccator).
- Long-Term Stability Test: At regular intervals (e.g., every 7 days), take the sensor out of storage and measure its response to the same standard solution under identical experimental conditions.
- Data Analysis: Express the signal at each time point as a percentage of the initial signal.
- A common benchmark is ~90% signal retention after 21 days [5].
- Short-Term Instability Mitigation: For short-term drift during a measurement session, employ internal normalization techniques. For example, express the sensor's response as a ratio to a stable internal standard or a reference feature in the voltammogram to minimize the impact of minor fluctuations [63].
Computational and Data Analysis Approaches
Advanced data processing can overcome limitations arising from physical sensor variation or signal overlap.
Multivariate Calibration with Machine Learning
Challenge: Simultaneous detection of multiple analytes with overlapping signals or dealing with complex matrices like urine or blood serum. Solution: Use machine learning models to deconvolute complex data.
- Protocol:
- Data Collection: Use a technique like Fast Fourier Transform Square-Wave Voltammetry (FFT-SWV) to obtain rich, information-dense response profiles from a training set of samples with known analyte concentrations [64].
- Model Training: Employ a linear method like Partial Least Squares (PLS) regression to build a predictive model that correlates the full voltammetric profile with the analyte concentration [64].
- Validation: Validate the model using a separate test set of samples. Evaluate performance using metrics like Root Mean Square Error of Prediction (RMSEP).
- Benefit: This method utilizes the entire response profile, mitigates interference effects, and can provide accurate quantitative results even when individual sensor signals overlap or vary slightly between devices [64].
Data Processing Workflow for Multi-Analyte Detection
System Integration and Workflow Design
A holistic approach that considers the entire system—from sample introduction to data readout—is crucial for achieving reliable performance in real-world applications.
Integrated LoC Sensor System Workflow
The Scientist's Toolkit: Research Reagent Solutions
Table 2: Essential Materials for Sensor Development and Testing
| Item | Function / Rationale | Example |
|---|---|---|
| Graphene Oxide (GO) | Provides a 2D scaffold with oxygen-rich functional groups for stable biomolecule immobilization and enhanced dispersion in aqueous media [5] [1]. | GO dispersions in water. |
| Multi-Walled Carbon Nanotubes (MWCNTs) | Imparts high electrical conductivity and mechanical strength to nanocomposites, improving electron transfer rates and sensor durability [5]. | Acid-functionalized MWCNTs. |
| Screen-Printed Electrodes (SPCEs) | Disposable, mass-producible electrodes that form the basis for portable, single-use sensors, enhancing reproducibility by minimizing manual electrode preparation [5]. | Commercial carbon or gold SPCEs. |
| Pocket Potentiostat | Portable instrument that, when paired with a smartphone, enables wireless, on-site electrochemical measurements, which is critical for field-deployable POC diagnostics [5] [1]. | PalmSens potentiostat. |
| Phosphate Buffered Saline (PBS) | A standard buffer system for maintaining a stable pH during electrochemical measurements, as pH can significantly affect analyte reactivity and sensor performance. | 0.1 M PBS, pH 7.4. |
| Standard Analytic Solutions | Used for calibration curves, reproducibility tests, and stability assessments. Preparing these with high-purity reagents is essential for accurate quantification. | e.g., Chloramphenicol, Morphine, Methadone standards. |
Within the development of modern lab-on-a-chip (LoC) platforms for electrochemical sensing, the elimination of bulky, power-intensive external pumps is a critical step toward creating truly portable and user-friendly point-of-care (POC) diagnostic devices. Passive micropumping provides a promising solution, offering fluid control through intrinsic forces such as capillary action and gravity, thereby achieving simplicity, ease of use, and low cost [65]. For a device targeting the detection of drug residues in the field, these attributes are indispensable. The core challenge lies in designing microchannel networks that generate and maintain stable, predictable flow rates without active external control, which is essential for the reproducibility of electrochemical assays. This document outlines the fundamental principles and practical protocols for implementing passive, pump-free flow, specifically contextualized for an integrated electrochemical LoC with smartphone readout for detecting illicit drugs and other residual contaminants.
The applicability of various passive flow strategies depends heavily on the specific requirements of the sensing platform. The following table summarizes the primary techniques, their mechanisms, and key performance considerations.
Table 1: Comparison of Primary Passive Flow Generation Strategies
| Strategy | Fundamental Principle | Typical Flow Rate Range | Key Advantages | Key Limitations |
|---|---|---|---|---|
| Capillary Action (Solid Substrates) [65] | Spontaneous wicking of liquid into a hydrophilic microchannel due to surface tension. | Varies with time (Q ~ t^(-1/2)) |
Low dead volume; minimal contamination in closed channels; highly reproducible flow [65]. | Requires hydrophilic surfaces; flow rate is not constant and is built-in upon device fabrication [65]. |
| Capillary Action (Porous Materials) [65] | Liquid transport through porous matrices like paper or cotton yarn. | Varies with time (Q ~ t^(-1/2)) |
Extremely simple and low-cost; widely used in lateral flow assays. | Flow rate is susceptible to material porosity variations and environmental conditions [65]. |
| Gravity Perfusion [66] | Flow driven by hydrostatic pressure difference from the height between inlet and outlet reservoirs. | Adjustable via height difference Δh |
Can generate continuous flow; flow rate is tunable by adjusting reservoir height [66]. | Requires a constant height difference; not suitable for all device orientations. |
| Siphon-Based Flow [67] | A specific gravity-driven configuration where a U-shaped channel primed with liquid initiates flow once the outlet reservoir is positioned below the inlet. | Adjustable via height difference Δh |
Power-free; zero dead volume; prevents reagent overlap [67]. | Requires precise priming of the siphon channel. |
Core Principles and Key Design Considerations
The Challenge of Pressure Imbalance in Passive Networks
A significant hurdle in implementing passive flow for complex LoCs, such as those requiring concentration gradients, is maintaining pressure equilibrium between multiple inlet streams. A pressure imbalance can disrupt the formation of a stable, linear concentration gradient, which is vital for certain assays [68]. To overcome this, a fluidic circuit with a balance zone and an equilibrium zone can be incorporated upstream. The balance zone consists of two long, high-flow-resistance serpentine channels (counter-pressure-difference channels) that diminish the effect of any initial pressure difference (P_A - P_B) between the two inlets. The two fluid streams then meet at a contact zone (equilibrium zone) where their pressures are equalized [68]. This design principle, analogous to an electric circuit, ensures that the flow rates from both inlets are nearly identical, which is a prerequisite for the downstream formation of a stable gradient in a pyramidal mixing network.
Fluidic Resistance and Capillary Valves
Passive flow control can be enhanced by strategically designing the geometry of the microchannels. The flow resistance (R_fluidic) of a channel is a function of its cross-sectional area and length. By designing channels with varying resistances, a desired flow rate or pressure drop can be engineered directly into the device [68]. Furthermore, capillary action can be used to create passive "limit valves." In a gravity-driven system, when the advancing liquid meniscus reaches a hydrophobic barrier or a sudden expansion in channel geometry, the capillary force that was pulling the liquid forward ceases, and the flow passively stops without user intervention [66]. This feature is invaluable for sequential reagent loading and timing of reactions on-chip.
Experimental Protocols
Protocol 1: Fabrication of a Thin, Gravity-Perfused Flow Cell
This protocol details the construction of a thin, optically transparent flow cell ideal for high-resolution microscopy, adaptable as a chamber for an electrochemical LoC [66].
- Objective: To fabricate a pump-free microfluidic flow cell with a controlled, gravity-driven flow rate and minimal dead volume.
- Primary Applications: Cell culture observation, single-molecule assays, and as a perfusion chamber for electrochemical sensors.
Table 2: Research Reagent Solutions & Essential Materials
| Item Name | Function/Description | Critical Specifications |
|---|---|---|
| Glass Coverslips | Forms the top and bottom of the flow channel, providing an optically clear and rigid structure. | No. 1 thickness (≈150 µm) for high-numerical-aperture microscopy. |
| Double-Sided Adhesive Tape | Defines the height and geometry of the microfluidic channel. | Various thicknesses (e.g., 25-100 µm); silicone-based adhesive for PDMS bonding. |
| Polydimethylsiloxane (PDMS) | Used to form sealed, hydrophobic inlet barriers and outlet tubing connectors. | Sylgard 184 kit (base and curing agent, 10:1 mixing ratio). |
| Programmable Cutter | Precisely cuts channel designs into the adhesive tape layer. | e.g., Cricut Explore or similar craft cutter/laser cutter. |
| Oxygen Plasma Treater | Activates PDMS and glass surfaces for irreversible bonding. | - |
| Tubing | Connects the outlet of the flow cell to the waste reservoir. | e.g., Tygon or silicone tubing, 1.5 mm outer diameter. |
Step-by-Step Procedure:
- Channel Patterning: Use a programmable cutter or scalpel to cut the desired channel pattern (e.g., a single straight channel or a more complex network) into the double-sided adhesive tape.
- Assembly: Affix the patterned tape to a shorter top coverslip. Carefully align and bond this assembly to a longer bottom coverslip, ensuring a complete seal around the channel edges. Apply even pressure on a flat surface.
- Inlet/Outlet Construction:
- Inlet: Manually apply a small amount of uncured, partially polymerized (slightly viscous) PDMS around the channel's inlet opening on the top coverslip. Surface tension will prevent it from flowing into the channel. Cure to form a hydrophobic barrier that also serves as a reservoir.
- Outlet: Punch a 1.5 mm hole in a small section of double-sided tape and align it over the channel's exit port. Seal a pre-punched PDMS block over this hole. Insert tubing into the PDMS block for a press-fit seal.
- Bonding (Optional): For permanent sealing of glass-PDMS interfaces, treat the surfaces with oxygen plasma for 30-60 seconds before bonding.
- Flow Control: Place the device on a microscope stage. Connect the outlet tubing to a waste reservoir. Adjust the height (
Δh) of this reservoir relative to the device inlet to control the flow rate (Q) according toQ = ρgΔh / R_fluidic, whereρis fluid density,gis gravity, andR_fluidicis the total fluidic resistance [66].
Protocol 2: Implementing a Pressure-Balanced Passive Gradient Generator
This protocol describes the creation of a compact, passive microfluidic device that generates a stable, linear concentration gradient for chemotaxis or sensor calibration studies, without external pumps [68].
- Objective: To generate a stable molecular concentration gradient using passive pumping and a fluidic circuit designed to offset pressure imbalances.
- Primary Applications: Chemotaxis studies, high-resolution live-cell imaging, and calibration of concentration-dependent sensors.
Step-by-Step Procedure:
- Device Fabrication: Fabricate the PDMS microfluidic device using standard soft-lithography techniques. The mold is created with a photoresist (e.g., SU-8 2025) on a silicon wafer. Pour a 10:1 mixture of PDMS pre-polymer and curing agent over the mold, cure at 70°C for 2 hours, and peel off the solidified layer. Punch holes for the inlet and outlet reservoirs [68].
- Device Bonding: Treat the PDMS layer and a glass slide or coverslip with oxygen plasma and bond them together permanently.
- Principle of Operation: The device features an upstream fluidic circuit. Two inlet reservoirs are loaded with culture media containing different concentrations of a chemotactic agent. Each stream first passes through a long, high-resistance serpentine channel (balance zone) to minimize flow rate differences. The streams then meet at a contact zone (equilibrium zone) to equalize pressure before entering the downstream pyramidal gradient-generation network [68].
- Operation: Using a pipette, load approximately the same volume of the two solutions into the respective inlet reservoirs. The passive pumping action, driven by capillary and gravity forces, will pull the liquids through the circuit. A linear concentration gradient will be automatically established in the observation zone downstream.
Integration with Smartphone-Based Electrochemical Sensing
The ultimate goal of a portable drug-residue detection platform is the full integration of passive fluidics with electrochemical sensing and smartphone readout. Recent advancements demonstrate this synergy.
- Electrochemical Biosensors: These sensors convert specific biochemical reactions into electrical signals, ensuring highly sensitive and selective detection of targets like drug residues [1]. Techniques such as voltammetry and amperometry are employed for quantification.
- Smartphone as a Potentiostat and Interface: Smartphones provide computational power, wireless connectivity, and high-resolution displays, making them ideal for POC testing. Portable potentiostats (e.g., PalmSens) can connect to a smartphone via Bluetooth, with custom applications (e.g., PS Touch) to control experiments, display results in real-time, and transmit data [5] [69].
- Material Enhancements: Nanomaterials like graphene oxide (GO) and multi-walled carbon nanotubes (MWCNTs) are used to modify electrodes. They enhance sensitivity by providing a high surface area, excellent electrical conductivity, and stable sites for immobilizing biological recognition elements like antibodies or aptamers [5].
Table 3: Performance of a Smartphone-Integrated Sensor for Drug Detection
| Parameter | Reported Performance | Context |
|---|---|---|
| Target Analyte | Chloramphenicol (CAP) [5] | A broad-spectrum antibiotic, representative of a drug residue. |
| Sensor Platform | GO@MWCNT / Glassy Carbon Electrode (GCE) [5] | Nanocomposite-modified electrode. |
| Detection Method | Differential Pulse Voltammetry (DPV) [5] | A highly sensitive electrochemical technique. |
| Linear Range | 0–600 µM [5] | The concentration range over which the sensor response is linear. |
| Limit of Detection (LOD) | 46 nM [5] | The lowest concentration that can be reliably detected. |
| Potentiostat | PalmSens pocket potentiostat [5] | A portable, smartphone-integrated device. |
A practical example is a multiplex laser-scribed graphene (LSG) sensing platform for the simultaneous detection of amphetamine, cocaine, and benzodiazepine in saliva. This system integrates a custom-made potentiostat and a smartphone application for a complete POC platform, demonstrating the powerful convergence of passive microfluidics (for sample handling), advanced electrochemistry, and consumer electronics [69].
Visualization of Core Concepts
Passive Gradient Generator Workflow
The following diagram illustrates the fluidic path and principle of a pressure-balanced, passive gradient generator.
Smartphone-Integrated LoC System Architecture
This diagram outlines the information flow and components of a fully integrated smartphone-based electrochemical LoC for on-site drug residue detection.
Improving Limit of Detection (LOD) through Nanomaterial Engineering and Surface Chemistry
The detection and quantification of drug residues in biological and environmental samples represent a significant challenge in pharmaceutical and forensic sciences. Electrochemical sensors integrated into Lab-on-a-Chip (LoC) platforms with smartphone readout offer a promising path toward rapid, on-site analysis. The critical performance parameter for these systems, the Limit of Detection (LOD), defines the lowest concentration of an analyte that can be reliably distinguished from a blank sample. Advancements in nanomaterial engineering and surface chemistry are pivotal in pushing the LOD of these sensors to clinically and forensically relevant levels, enabling the detection of trace substances such as illicit drugs and pharmaceuticals at nanomolar and picomolar concentrations [70] [71]. This document details practical protocols and application notes for leveraging these technologies to enhance sensor performance, specifically within the context of a miniaturized, smartphone-compatible electrochemical LoC system.
Nanomaterial Engineering for Enhanced Signal Transduction
The integration of nanomaterials into electrochemical sensors significantly boosts signal strength by increasing the active surface area, improving electron transfer kinetics, and introducing catalytic properties. The following table summarizes key nanomaterials and their roles in improving LOD for drug detection.
Table 1: Nanomaterials for Electrochemical Sensor Enhancement
| Nanomaterial Class | Example Materials | Key Properties | Impact on LOD | Demonstrated Application |
|---|---|---|---|---|
| Carbon-Based | Graphene, Carbon Nanotubes (CNTs), Reduced Graphene Oxide (rGO) | High surface area, excellent conductivity, functionalization sites | Increases active area, enhances electron transfer, preconcentrates analyte | rGO/Ag nanocomposite for morphine (LOD: 1.8 pg/mL) [70] |
| Noble Metal Nanoparticles | Gold (Au), Silver (Ag) | Surface Plasmon Resonance (SPR), high conductivity, catalytic activity | Amplifies electrochemical and optical signals | Au NPs in SERS for fentanyl [71] |
| Magnetic Nanoparticles | Fe₃O₄ NPs | Superparamagnetism, high surface area | Enables magnetic separation and pre-concentration | MSPE for illicit drugs in urine [70] |
| Two-Dimensional (2D) MXenes | Ti₃C₂Tₓ | Metallic conductivity, hydrophilic surface, tunable chemistry | Enhances electron transfer, biocompatible interface | Detection of antibiotics and NSAIDs [48] |
| Molecularly Imprinted Polymers (MIPs/NanoMIPs) | Polymer nanoMIPs | Synthetic, antibody-like recognition sites | High selectivity in complex matrices, reduces fouling | Selective amphetamine detection [71] |
Application Note: Signal Amplification with Nanocomposites
Background: Combining different nanomaterials into a single nanocomposite can create synergistic effects. For instance, a hybrid of rGO and silver nanocubes provides a massive, conductive surface area for aptamer immobilization and enhances local electromagnetic fields, leading to superior signal amplification [70].
Protocol: Synthesis of rGO/Ag Nanocomposite for Electrode Modification
Preparation of rGO Dispersion:
- Disperse 50 mg of graphene oxide (GO) powder in 100 mL deionized water.
- Sonicate the mixture for 2 hours using a probe sonicator (500 W) to achieve a homogeneous yellow-brown dispersion.
- Add 1 mL of hydrazine hydrate and 2 mL of ammonia solution (28%) to the GO dispersion.
- Heat the mixture at 95°C for 1.5 hours under constant stirring, observing a color change to black, indicating reduction to rGO.
- Cool to room temperature and filter the rGO through a 0.22 µm membrane. Wash thoroughly with deionized water and re-disperse in 50 mL water.
In-situ Synthesis of Silver Nanocubes on rGO:
- Add 50 mL of the prepared rGO dispersion to a 250 mL round-bottom flask.
- Under vigorous stirring, add 5 mL of a 30 mM silver nitrate (AgNO₃) solution.
- Heat the mixture to 60°C and then add 5 mL of a 100 mM sodium citrate solution dropwise.
- Continue stirring and heating for 1 hour. The formation of silver nanocubes on the rGO sheets will be evident by a color shift to grey-green.
- Centrifuge the resulting rGO/Ag nanocomposite at 10,000 rpm for 15 minutes, discard the supernatant, and re-disperse the pellet in deionized water to a final volume of 10 mL.
Electrode Modification:
- Prepare a screen-printed carbon electrode (SPCE) by cleaning its surface with PBS (pH 7.4).
- Drop-cast 5 µL of the rGO/Ag nanocomposite suspension onto the working electrode area.
- Allow the electrode to dry overnight at room temperature in a desiccator.
- The modified SPCE is now ready for further functionalization with biorecognition elements (e.g., aptamers, antibodies).
Advanced Surface Chemistry for Selective Analyte Capture
Precise control over the sensor surface chemistry is essential to ensure that target molecules bind specifically and efficiently to the transducer's most sensitive regions, thereby minimizing non-specific adsorption and improving the signal-to-noise ratio.
Protocol: Polydopamine-Mediated Universal Surface Functionalization
Polydopamine (pD) coating, inspired by mussel adhesion, provides a simple, material-independent method for creating a robust, functional layer on virtually any surface [72].
Procedure:
Solution Preparation: Prepare a 10 mM Tris-HCl buffer (pH 8.5). Dissolve dopamine-hydrochloride in this buffer to a final concentration of 2 mg/mL. The solution will initially be clear but will gradually turn pink and then dark brown as polymerization begins.
Substrate Preparation: Clean the sensor substrate (e.g., gold, ITO, polymer-based LoC). For gold surfaces, perform oxygen plasma treatment for 2 minutes to ensure a hydrophilic surface.
Co-functionalization: To immobilize a specific biorecognition element (e.g., an anti-cocaine aptamer) during the coating process, dissolve the aptamer (e.g., 5'-HS(CH₂)₆-TTTTTGGGAGTCAAGAACGAA-3') directly into the dopamine solution at a concentration of 1 µM [70] [72].
Coating Process: Immerse the clean sensor substrate into the dopamine/aptamer solution. Allow the reaction to proceed for 4-6 hours at room temperature with gentle shaking.
Rinsing and Storage: After coating, remove the substrate and rinse it thoroughly with deionized water to remove any loosely bound particles. Dry under a stream of nitrogen gas. The pD+aptamer functionalized sensor can be stored at 4°C until use. The immobilized aptamer retains its functionality, selectively capturing target analytes like cocaine from complex samples [72].
Application Note: Topographically Selective Functionalization
For nanoscale sensors where the active sensing region is topographically distinct (e.g., nanoholes, pillars, waveguides), confining probe molecules to these high-sensitivity areas can drastically improve the LOD by preventing target depletion on non-sensing regions [73] [74].
Background: A study using nanoplasmonic templates with ~150 nm diameter holes demonstrated that restricting NeutrAvidin binding solely to the gold regions within the holes, instead of the entire surface, increased the initial time-resolved response by a factor of almost 20 under mass-transport limited conditions [73].
Workflow Diagram: Topographically Selective Functionalization
Diagram 1: Selective surface functionalization workflow.
Protocol: Hydrogel Nanoparticle Masking for Selective Functionalization [74]
Synthesis of PNIPAM Hydrogel Nanoparticles:
- Dissolve 0.76 g of N-isopropylacrylamide (NIPAM) and 0.013 g of N,N'-methylenebis(acrylamide) (BIS) crosslinker in 50 mL of deoxygenated ddH₂O in a three-neck flask.
- Add 0.34 mL of 1% sodium dodecyl sulfate (SDS) solution.
- Bubble nitrogen gas through the solution for 45 minutes to remove oxygen.
- Heat the mixture to 60°C under constant stirring and nitrogen atmosphere.
- Initiate polymerization by adding 0.5 mL of an aqueous ammonium persulfate (APS) solution (33.2 mg/mL).
- React for 5 hours until the solution becomes turbid. Filter the resulting PNIPAM nanoparticle suspension through a 1.2 µm syringe filter.
Dip-Coating of PNIPAM Mask:
- Use a programmable syringe pump for controlled dip-coating.
- Dilute the PNIPAM nanoparticle solution 1:100 (v/v) in ddH₂O.
- Submerge the nanostructured sensor chip vertically into the dilution at a speed of 500 µm/min.
- Hold the chip submerged for 30 seconds.
- Withdraw the chip at a constant speed of 1000 µm/min. The nanoparticles will preferentially assemble on the topographical features, masking the active sensing regions.
Functionalization of Non-Sensing Areas:
- With the active regions masked, expose the entire chip to a solution of a passivating agent (e.g., 1 mM hexa(ethylene glycol) in ethanol) for 1 hour. This functionalizes only the exposed non-sensing areas, rendering them non-fouling.
Mask Removal and Probe Immobilization:
- Remove the PNIPAM mask by gently rinsing the chip with cold (4°C) deionized water. The hydrogel particles shrink and detach at lower temperatures.
- The active sensing regions are now exposed and pristine. Proceed to immobilize your specific capture probe (e.g., antibodies, aptamers) using a standard coupling chemistry (e.g., EDC-NHS, gold-thiol) exclusively on these high-sensitivity areas.
The Scientist's Toolkit: Essential Research Reagents
Table 2: Key Reagents for Sensor Functionalization and Detection
| Reagent / Material | Function | Example Use Case |
|---|---|---|
| Dopamine-Hydrochloride | Forms a universal, adhesive polydopamine coating for probe immobilization on any substrate [72]. | One-pot functionalization of LoC electrodes with aptamers. |
| (3-Aminopropyl)dimethylethoxysilane | Silane coupling agent for introducing amine groups onto oxide surfaces (e.g., glass, ITO) [74]. | Priming surfaces for glutaraldehyde crosslinking. |
| Poly(N-isopropylacrylamide) Microgels | Thermally responsive hydrogel for topographically selective masking [74]. | Confining probe molecules to nanoscale active sensor areas. |
| Screen-Printed Carbon Electrodes (SPCEs) | Disposable, miniaturized electrode platform ideal for LoC and point-of-care devices [48]. | Base transducer for smartphone-based readout systems. |
| Locked Nucleic Acid (LNA) / DNA Aptamers | High-affinity, synthetic biorecognition elements for specific molecular targets [70]. | Selective capture of drug residues like cocaine or methamphetamine. |
| N-Hydroxysuccinimide (NHS) / EDC | Crosslinking chemistry for covalent immobilization of biomolecules via amine groups. | Conjugating antibodies to carboxylated nanostructures on the sensor. |
The strategic integration of advanced nanomaterials with precision surface chemistry is a powerful approach for developing next-generation electrochemical LoC sensors with smartphone readout. By employing nanocomposites to amplify signals and sophisticated functionalization techniques like pD coating and topographic masking to direct binding, researchers can achieve unprecedented low limits of detection. The protocols and application notes provided here offer a practical roadmap for implementing these strategies, paving the way for highly sensitive, portable, and robust analytical devices for monitoring drug residues in various settings.
The accurate detection of drug residues in complex matrices such as biological fluids and food samples is paramount for ensuring public health, food safety, and effective therapeutic drug monitoring. Electrochemical sensors, particularly when integrated into Lab-on-Chip (LoC) platforms with smartphone readout, offer a promising solution for rapid, on-site analysis. However, a significant challenge persists: the presence of endogenous electroactive species and complex matrix components that can severely compromise analytical specificity and lead to false-positive or false-negative results. This Application Note provides a detailed examination of the primary sources of interference and outlines validated protocols to mitigate their effects, ensuring reliable data within the framework of advanced electrochemical LoC systems.
Understanding and Classifying Interferences
In electrochemical sensing, interferences are typically categorized based on their mechanism of action. The table below summarizes the primary types of interferences encountered in biological and food samples.
Table 1: Common Interferences in Electrochemical Sensing of Drug Residues.
| Interference Category | Source Examples | Impact on Sensor Performance |
|---|---|---|
| Electroactive Species | Ascorbic Acid, Uric Acid, Acetaminophen [75] [76] | Oxidized at similar potentials as the target analyte, generating a non-specific faradaic current that inflates the signal. |
| Fouling Agents | Proteins (Albumin), Lipids, Cells [76] | Adsorb non-specifically onto the electrode surface, blocking active sites and reducing electron transfer, leading to signal suppression. |
| Complex Matrix Effects | Viscosity of whole blood, cutting agents in seized drugs [3] [76] | Hinder mass transport of the analyte to the electrode surface and can cause non-specific binding, affecting sensitivity and specificity. |
Strategies for Mitigating Interferences
Several strategies can be employed at the sensor design and assay protocol levels to enhance specificity.
Physical Barriers: Permselective Membranes
Coating the electrode with a permselective membrane, such as Nafion or cellulose acetate, is a highly effective strategy. These membranes act as molecular sieves, selectively allowing the target analyte to pass through while excluding larger, charged, or neutral interferents based on size and charge [75]. For instance, the negatively charged sulfonic groups in Nafion repel ascorbic acid (also negatively charged at physiological pH) and uric acid, while allowing neutral targets like hydrogen peroxide—a common enzymatic reaction product—to pass [75].
Chemical Specificity: Affinity-Based Recognition
Incorporating biorecognition elements is the most direct path to specificity. Affinity-based sensors use antibodies, antigens, nucleic acids, or aptamers immobilized on the electrode to selectively capture the target drug molecule [76]. This specific binding event is then transduced into an electrochemical signal. This method significantly reduces interference from molecules that do not bind to the recognition element.
Sample Purification: On-Chip Processing
For highly complex matrices like whole blood, integrating on-chip sample purification is a powerful approach. This eliminates the need for bulky centrifuges and manual preprocessing.
- Filtration-based Plasma Separation: A whole blood sample is applied to a commercially available plasma separation membrane (e.g., Vivid GX membrane). Blood cells and platelets are trapped, allowing purified plasma to wick through to the detection chamber via capillary action [76]. This process efficiently removes cellular components that could foul the electrode.
Signal Enhancement: Mediators and Nanomaterials
The use of electron mediators shuttles electrons from the redox center of an enzyme to the electrode, allowing the sensor to operate at a much lower potential where common interferents are not oxidized [75]. Furthermore, nanomaterials like graphene oxide (GO) and multi-walled carbon nanotubes (MWCNTs) can enhance electrocatalytic activity and sensitivity, improving the signal-to-noise ratio [26].
The following diagram illustrates the core strategies integrated into an experimental workflow for a LoC device.
Diagram 1: Integrated strategies for interference mitigation in an electrochemical LoC system.
Experimental Protocols
Protocol: On-Chip Plasma Separation and Detection
This protocol details the integration of a filtration membrane for the detection of a target analyte in whole blood [76].
1. Device Fabrication:
- Materials: Vivid GX plasma separation membrane, double-sided adhesive (DSA) film, polyester film, screen-printed carbon electrode (SPE), nitrocellulose membrane.
- Procedure: a. Use a laser cutter to create microfluidic channels in the DSA and polyester layers. b. Stack the layers in the following order from bottom to top: nitrocellulose membrane with integrated SPE, DSA layer with cut channel, polyester layer, plasma separation membrane. c. Laminate the layers together to form a sealed capillary-driven microfluidic device.
2. Assay Execution: a. Apply 20 µL of whole blood sample directly onto the inlet of the plasma separation membrane. b. Allow the sample to wick through the membrane and microfluidic circuit via capillary action (approximately 2-5 minutes). c. The purified plasma will reach the detection zone containing the functionalized SPE. d. Perform chronoamperometric or voltammetric measurement using the integrated smartphone potentiostat.
Protocol: Specific Detection Using Square Wave Voltammetry with a Smartphone Potentiostat
This protocol is adapted from methods used for the detection of controlled substances in seized samples and is applicable to drug residues [3].
1. Sensor and Solution Preparation:
- Materials: Commercial carbon SPEs (3 mm graphite working electrode), portable potentiostat (e.g., EmStat Pico, MultiPalmSens4) with Bluetooth, buffer solutions (e.g., pH 12 PBS, pH 7 PBS with formaldehyde).
- Procedure: a. Turn on the portable potentiostat and connect it to the smartphone via Bluetooth. b. Launch the controlling application (e.g., PSTrace) on the smartphone. c. Insert a new, clean SPE into the potentiostat's connector. d. Prepare the sample by extracting the drug residue from the food or biological matrix into an appropriate buffer. For solid samples, a simple solvent extraction and dilution in the measurement buffer is sufficient.
2. Measurement and Data Analysis: a. Deposit a 50 µL drop of the prepared sample solution directly onto the working electrode of the SPE. b. Initiate the pre-loaded Square Wave Voltammetry (SWV) method from the smartphone app. Typical parameters: Potential window: 0 to +1.5 V (vs. Ag/AgCl pseudo-reference); Frequency: 25 Hz; Amplitude: 50 mV. c. The application will run the experiment and display the voltammogram in real-time. d. Identify the target analyte by comparing the peak potential(s) in the sample's "electrochemical profile" to a pre-established library of profiles for pure compounds. e. For quantification, use the standard addition method or a pre-calibrated curve based on peak current.
The Scientist's Toolkit: Essential Research Reagents and Materials
Table 2: Key research reagents and materials for developing interference-resistant electrochemical sensors.
| Item Name | Function / Application | Justification for Use |
|---|---|---|
| Screen-Printed Electrodes (SPEs) | Disposable, miniaturized electrochemical cell. | Foundation for low-cost, portable sensors; compatible with commercial portable potentiostats [3]. |
| Vivid GX Plasma Separation Membrane | On-chip separation of plasma from whole blood. | Removes >99% of blood cells, simplifying sample prep and reducing fouling without centrifugation [76]. |
| Nafion | Permselective membrane coating. | Effective barrier against anionic interferents like ascorbate and urate; enhances selectivity [75]. |
| Graphene Oxide (GO) / Multi-Walled Carbon Nanotubes (MWCNTs) | Nanomaterial for electrode modification. | Enhances electrocatalytic activity, increases surface area, and improves sensitivity and lower detection limits [26]. |
| Specific Antibodies / Aptamers | Biorecognition elements. | Provide high specificity for the target analyte, forming the basis of affinity-based sensors (immunosensors/aptasensors) [76]. |
Achieving high specificity in the electrochemical detection of drug residues within complex matrices is a multi-faceted challenge that requires a combination of strategic approaches. By integrating physical barriers like permselective membranes, employing highly specific biorecognition elements, implementing on-chip sample purification, and leveraging the signal enhancement properties of nanomaterials, researchers can effectively mitigate interferences. The protocols outlined herein, utilizing commercially available SPEs and smartphone-based potentiostats, provide a robust framework for developing reliable, portable, and user-friendly LoC sensors for application in food safety, environmental monitoring, and clinical diagnostics.
Benchmarking Performance: Validation Against Gold Standards and Market Analysis
The integration of smartphone-based sensors with Lab-on-a-Chip (LoC) platforms represents a significant advancement in the development of portable, user-friendly tools for the detection of drug residues. These systems combine the computational power, connectivity, and interface capabilities of smartphones with the analytical precision of electrochemical sensing [1]. For researchers and professionals in drug development, validating the performance of these emerging smartphone-based platforms against established traditional potentiostats is a critical step in ensuring data reliability and methodological acceptance [5]. This application note provides structured protocols and comparative data to facilitate such correlation studies, framed within the context of electrochemical sensor research on an LoC platform with smartphone readout.
Experimental Design and Workflow
A robust correlation study involves the parallel analysis of identical samples using both a smartphone-based sensor system and a reference benchtop potentiostat. The core of the system is the potentiostat, which may be a commercial benchtop unit, a portable commercial device, or an open-source prototype [77] [5] [78]. This device applies specific electrical potentials to the electrochemical cell and measures the resulting current. For smartphone systems, a communication module (typically Bluetooth Low Energy) relays commands from the smartphone to the potentiostat and streams the acquired data back to the phone [77] [79]. The smartphone hosts a custom application that controls the experiment, visualizes data in real-time, and can perform initial data processing or cloud transmission [79] [5].
The following diagram illustrates the core architecture and workflow for a typical correlation study.
Research Reagent Solutions and Materials
The table below lists the essential materials and reagents commonly used in the development and validation of smartphone-LoC platforms for drug residue analysis.
Table 1: Key Research Reagents and Materials for Sensor Development and Analysis
| Item Name | Function/Application | Key Characteristics & Examples |
|---|---|---|
| Electrode Nanomaterials | Enhance electrode sensitivity and selectivity [1] [44]. | Graphene Oxide (GO), Multi-Walled Carbon Nanotubes (MWCNTs), Gold Nanoparticles (AuNPs), Laser-Induced Graphene (LIG) [1] [5] [80]. |
| Conductive Polymers | Improve selectivity and stability of the sensing layer [79] [80]. | Poly(3,4-ethylenedioxythiophene) (PEDOT), often with polystyrenesulfonate (PSS) [79]. |
| Biological Recognition Elements | Provide high specificity for target analytes [1]. | Enzymes, antibodies, aptamers, molecularly imprinted polymers (MIPs) [1]. |
| Screen-Printed Electrodes (SPEs) | Disposable, mass-producible sensors for portable systems [79] [5]. | Integrated three-electrode systems printed on plastic or ceramic substrates [79]. |
| Electrochemical Potentiostats | Instrument for applying potential and measuring current [77] [78]. | Benchtop (e.g., Autolab), portable commercial (e.g., Palmsens), or open-source (e.g., UWED, We-VoltamoStat) [77] [5] [78]. |
| Smartphone & Application | Device control, data visualization, and analysis [1] [79]. | Custom app (e.g., PS Touch) for parameter setting and real-time data plotting [79] [5]. |
| Buffer Solutions | Provide a stable ionic strength and pH for electrochemical reactions [79]. | Phosphate Buffered Saline (PBS, 0.1 M, pH 7.4) is commonly used [79]. |
Detailed Experimental Protocols
Protocol 1: System Calibration and Ferricyanide Validation
This foundational protocol validates the basic operational performance of the smartphone-potentiostat system against a benchtop unit using a standard redox probe [77].
Materials:
- Smartphone-potentiostat system (e.g., UWED, Palmsens with PS Touch app).
- Benchtop potentiostat (e.g., Autolab PGSTAT).
- Screen-printed electrodes (SPEs) or glassy carbon electrodes (GCEs).
- Potassium ferricyanide (K₃[Fe(CN)₆]) solution in PBS (1 mM).
- Potassium chloride (KCl, 0.1 M) as supporting electrolyte.
Procedure:
- Solution Preparation: Prepare a 1 mM solution of K₃[Fe(CN)₆] in 0.1 M KCl/PBS.
- Instrument Connection: For the smartphone system, pair the potentiostat with the smartphone via Bluetooth and launch the control application.
- Experiment Setup: On both systems, configure the parameters for Cyclic Voltammetry (CV):
- Initial Potential: 0 V
- Vertex Potential 1: +0.5 V
- Vertex Potential 2: -0.2 V
- Scan Rate: 50 mV/s
- Number of Scans: 3
- Data Acquisition: Drop 50-100 µL of the ferricyanide solution onto the electrode. Run the CV experiment simultaneously on both systems (using identical electrode batches if not the same physical electrode).
- Data Analysis: For both datasets, extract the peak current (Ipa for oxidation, Ipc for reduction) and peak potential (Epa, Epc) from the CV curves. Calculate the average peak current and standard deviation from multiple scans.
Protocol 2: Cross-Platform Detection of a Target Drug Residue
This protocol outlines the steps for a correlation study using a specific drug residue, such as Chloramphenicol (CAP) or Dopamine (DA), which are common model analytes [79] [5].
Materials:
- All materials from Protocol 1.
- Target drug (e.g., Chloramphenicol, Dopamine).
- Modified working electrode (e.g., GCE/SPE coated with GO-MWCNT nanocomposite for CAP, or PEDOT/CS/Graphene for DA) [79] [5].
- Real-world sample matrices (e.g., milk, serum, tap water).
Procedure:
- Sensor Preparation: Modify the working electrodes according to published procedures (e.g., drop-casting of GO@MWCNT nanocomposite for CAP detection) [5].
- Calibration Curve Generation:
- Prepare a series of standard solutions of the target drug in PBS across a defined concentration range (e.g., 0–600 µM for CAP [5]).
- Using Differential Pulse Voltammetry (DPV), analyze each standard concentration in triplicate on both the smartphone system and the benchtop potentiostat. Typical DPV parameters: potential window specific to the drug, pulse amplitude 50 mV, step potential 10 mV.
- Data Analysis:
- Plot the peak current from the DPV measurements against the drug concentration for both datasets.
- Perform linear regression analysis to determine the sensitivity (slope), linear range, Limit of Detection (LOD = 3.3σ/slope, where σ is the standard deviation of the blank), and the coefficient of determination (R²) for each system.
- Correlation Analysis:
- Create a scatter plot of the DPV peak currents (or calculated concentrations) obtained from the smartphone system (y-axis) against those from the benchtop system (x-axis).
- Perform a linear regression on this scatter plot. A strong correlation is indicated by a slope close to 1, an intercept close to 0, and an R² value > 0.99 [5].
The workflow for this quantitative analysis is detailed below.
Protocol 3: Real Sample Analysis and Recovery Study
To validate method accuracy in complex matrices, a recovery study is essential.
Materials:
- Pre-analyzed real samples (e.g., milk, human serum).
- Standard solutions of the target drug at known concentrations.
Procedure:
- Sample Preparation: Dilute the real sample with an appropriate buffer. Split into three aliquots: one for baseline measurement, and two for spiking.
- Standard Addition: Spike the aliquots with two different known concentrations of the drug standard.
- Analysis: Analyze the original and spiked samples using the DPV protocol on both the smartphone and benchtop systems.
- Recovery Calculation:
- Calculate the concentration of the drug in the spiked samples using the calibration curve from Protocol 2.
- Calculate the percentage recovery for each spike level using the formula:
- Recovery (%) = (Measured Concentration - Baseline Concentration) / Spiked Concentration × 100%
- Compare the recovery percentages obtained from both systems. Acceptable recovery typically falls between 85-115%, demonstrating the accuracy and lack of matrix interference in the smartphone-based method [5] [80].
Data Presentation and Comparative Analysis
The following tables summarize quantitative data from published correlation studies, providing benchmarks for expected performance.
Table 2: Performance Comparison for Chloramphenicol (CAP) Detection [5]
| Parameter | Benchtop Potentiostat (Autolab) | Smartphone Potentiostat (Palmsens) |
|---|---|---|
| Linear Detection Range | 0 – 600 µM | 0 – 600 µM |
| Sensitivity | 1.71 µA µM⁻¹ cm⁻² | 1.71 µA µM⁻¹ cm⁻² (Correlated) |
| Limit of Detection (LOD) | 46 nM | 46 nM (Correlated) |
| Reproducibility (RSD) | < 3% | < 3% |
| Correlation (R²) | - | > 0.99 (vs. Benchtop) |
Table 3: Performance Comparison for Dopamine (DA) Detection [79]
| Parameter | Smartphone-Based System | Comparable Benchtop Performance |
|---|---|---|
| Linear Detection Range | 0.05 – 70 µM | Not Specified |
| Sensitivity | 0.52 ± 0.01 µA/µM | Not Specified |
| Limit of Detection (LOD) | 0.29 µM | Not Specified |
| Selectivity | Achieved in presence of Ascorbic Acid (AA) and Uric Acid (UA) | Achieved |
Table 4: General Performance Metrics of Potentiostat Systems [77] [78]
| Parameter | Benchtop Potentiostat | Open-Source UWED [77] | Wearable We-VoltamoStat [78] |
|---|---|---|---|
| Operating Voltage | Typically ±10V or more | ±1.5 V | Not Specified |
| Current Range | Several mA | ±180 µA | nA to mA (R²=0.99) |
| Portability | Low | High | High (Wearable) |
| Connectivity | USB to PC | Wireless (BLE) to Smartphone | Wireless to Smartphone |
| Typical Cost | $$$ (Thousands of USD) | $ (Low Cost, Open-Source) | ~$120 USD |
Troubleshooting and Technical Notes
- Signal Discrepancies: If the current measured by the smartphone system is consistently lower, check the specified current range of the portable potentiostat, as it is often more limited (±180 μA for UWED) than that of benchtop systems [77]. Ensure all connections are secure.
- Bluetooth Connectivity Issues: Ensure the potentiostat is sufficiently charged. Close and reopen the smartphone application, and re-pair the device if necessary.
- High Background Noise: For open-source systems, noise can be minimized by using a well-designed printed circuit board (PCB) with proper grounding and shielding. Performing experiments in a Faraday cage is recommended for low-current measurements [77].
- Data Correlation Deviations: Ensure that the exact same electrode is used for both measurements, or that electrodes from the same batch show high reproducibility. Confirm that experimental parameters (scan rate, pulse amplitude, etc.) are identical between the two systems.
For researchers developing electrochemical sensors with smartphone readouts for drug residue analysis, a thorough understanding of core analytical performance metrics is non-negotiable. These metrics—Limit of Detection (LOD), Linear Range, and Sensitivity—form the universal language of method validation and provide the benchmark against which any new analytical technology must be evaluated [81] [82].
This document provides detailed application notes and experimental protocols to guide the characterization of these critical parameters. The content is specifically framed within the context of validating a novel electrochemical sensor on a Lab-on-Chip (LoC) platform, providing a clear pathway for comparing its performance against established techniques like High-Performance Liquid Chromatography (HPLC) and Liquid Chromatography-Tandem Mass Spectrometry (LC-MS/MS). A robust comparison enables researchers to convincingly demonstrate the capability of their sensing systems for applications such as on-site screening of drug residues.
Core Definitions and Theoretical Framework
A precise understanding of key terms is fundamental to method validation and performance reporting. The following table summarizes the critical definitions and their significance for your sensor development.
Table 1: Foundational Definitions of Key Analytical Performance Metrics
| Term | Formal Definition | Significance in Sensor Development |
|---|---|---|
| Sensitivity | The slope of the analytical calibration curve ((S = dy/dx)), representing the change in instrument response per unit change in analyte concentration [81]. | A steeper slope indicates that your sensor's signal (e.g., current, voltage) changes significantly with small concentration changes, which is crucial for detecting low drug residue levels. |
| Limit of Detection (LOD) | The lowest concentration of an analyte that can be reliably distinguished from a blank sample, with a specified degree of certainty [81] [83]. It is a function of both the blank signal's variability and the method's sensitivity. | Determines the smallest amount of drug residue your sensor can "detect." This is a key metric for ensuring the sensor is fit-for-purpose in trace analysis. |
| Limit of Quantification (LOQ) | The lowest concentration at which the analyte can not only be detected but also quantified with acceptable accuracy and precision (bias and imprecision) [83] [84]. | Defines the lower limit for generating reliable, quantitative data on drug residue concentration, which is more stringent than the LOD. |
| Linear Range | The concentration interval over which the analytical response is a linear function of analyte concentration, typically bounded by the LOQ at the lower end and the Upper Limit of Quantification (ULOQ) at the high end [85]. | Establishes the working range where your sensor provides accurate quantitative results without requiring sample dilution or concentration. |
The relationship between the blank, the LOD, and the LOQ is a statistical one, grounded in the probability distributions of the signals from blank and low-concentration samples. The following diagram illustrates this conceptual and statistical relationship.
Diagram 1: Statistical Relationship of LoB, LOD, and LOQ. The Limit of Blank (LoB) is the highest apparent signal from a blank sample. The LOD is the lowest concentration where the signal can be reliably distinguished from the LoB. The LOQ is a higher concentration where quantification meets predefined precision and accuracy goals [83].
Experimental Protocols for Determining Key Metrics
This section provides step-by-step protocols for the experimental determination of sensitivity, LOD, LOQ, and linear range. These protocols are designed to be adaptable for electrochemical sensor characterization.
Protocol for Calibration Curve Generation
Objective: To generate a calibration curve for determining sensitivity and the linear range of the analytical method.
- Preparation of Calibration Standards: Prepare a series of standard solutions across the expected concentration range (e.g., from blank to a concentration expected to be above the sensor's upper limit). For drug residue analysis, prepare these standards in a matrix that mimics the real sample (e.g., buffer, diluted serum, processed food extract) to account for matrix effects [86].
- Measurement: Analyze each calibration standard in a randomized order, using a minimum of three independent replicates per concentration level.
- Data Analysis: Plot the mean analytical response (e.g., sensor current, peak area) against the known concentration of each standard.
- Linear Regression: Perform a least-squares linear regression on the data points within the visually linear region to obtain the equation ( y = mx + b ), where ( m ) is the slope and ( b ) is the y-intercept.
- Calculation of Sensitivity: The sensitivity of the method is directly given by the slope (( m )) of the linear regression line [81].
Protocol for Determining LOD and LOQ
Objective: To statistically determine the Limit of Detection (LOD) and Limit of Quantification (LOQ) of the electrochemical sensor.
Two common approaches are outlined below. The statistical approach (A) is generally preferred, while the signal-to-noise approach (B) is more practical for instrumental analysis.
A. Statistical Approach (Based on Blank and Calibration Curve Statistics) [83] [84]
- Measure the Blank: Analyze at least 10-20 independent replicates of a blank sample (matrix without the analyte).
- Calculate Mean and SD: Calculate the mean (( \bar{x}{blank} )) and standard deviation (( SD{blank} )) of the blank responses.
- Determine Limit of Blank (LoB): ( LoB = \bar{x}{blank} + 1.645 \times SD{blank} ) (for a one-sided 95% confidence level) [83].
- Prepare a Low-Concentration Sample: Prepare and analyze at least 10-20 replicates of a sample containing the analyte at a concentration near the expected LOD.
- Calculate the LOD: ( LOD = LoB + 1.645 \times SD_{low\,concentration\,sample} ) [83].
- Determine the LOQ: The LOQ is the lowest concentration that can be quantified with predefined precision and accuracy (e.g., ≤20% relative standard deviation (RSD) and 80-120% accuracy). This is determined by analyzing multiple low-concentration samples and identifying the lowest concentration that meets these criteria [83] [85]. It can also be estimated from the calibration curve as ( LOQ = 10 \times (SD_{blank}/Sensitivity) ) [84].
B. Signal-to-Noise Ratio Approach
- Record Baseline Noise: Record the sensor's signal output for the blank over a representative time period.
- Measure the Peak-to-Peak Noise: Determine the average peak-to-peak noise level (( N )) from the baseline.
- Calculate LOD and LOQ: Analyze a low-concentration standard and measure the analyte signal (( S )). The LOD is generally accepted as a concentration that yields ( S/N \geq 3 ). The LOQ is the concentration that yields ( S/N \geq 10 ) [84].
The overall workflow for the full characterization of an analytical method, integrating these protocols, is depicted below.
Diagram 2: Method Characterization Workflow. A sequential protocol for determining the key performance metrics of an analytical method, from initial calibration to final range definition.
Comparative Analysis: HPLC vs. LC-MS vs. Electrochemical Sensors
Understanding the performance landscape of established techniques is critical for positioning a new sensor technology. The following table provides a general comparison of these methods, with data drawn from the literature and contextualized for drug residue analysis.
Table 2: Performance Comparison of HPLC, LC-MS, and Electrochemical Sensors
| Parameter | HPLC (with UV/Vis) | LC-MS/MS | Electrochemical Sensor (LoC/Smartphone) |
|---|---|---|---|
| Typical LOD | ~1-10 ng/mL [87] | ~0.1-1 ng/mL or lower [87] [88] | Target: Sub-ng/mL to low ng/mL (highly method-dependent) |
| Linear Dynamic Range | ~2-3 orders of magnitude [86] | ~4-6 orders of magnitude [86] | Typically 2-3 orders of magnitude |
| Sensitivity | Good, depends on detector and analyte's molar absorptivity. | Excellent, due to high signal amplification of the MS detector. | Can be very high, as small redox events produce measurable currents. |
| Selectivity/Specificity | Moderate; relies on chromatographic separation and UV spectrum. Can be insufficient for complex matrices [88]. | Very High; combines chromatographic separation with unique mass-to-charge ratio identification [88]. | Moderate to High; relies on electrode functionalization (e.g., antibodies, aptamers) and applied potential. |
| Key Advantages | Robust, widely available, cost-effective for routine analysis. | Superior specificity, very low LODs, can identify unknown compounds. | Portability, rapid analysis, low cost, potential for real-time, on-site detection. |
| Key Limitations for Drug Residue Analysis | Higher LOD than LC-MS; poor identification confidence in complex matrices. | High instrument cost, requires skilled operators, complex sample prep. | Susceptible to matrix fouling; requires careful calibration and stability validation. |
Contextual Analysis of Performance: A study directly comparing HPLC and LC-MS/MS for quantifying 25-hydroxyvitamin D3 in plasma clearly demonstrated the performance gap: the LC-MS/MS method achieved an LOD of 1.6 ng/mL, compared to 5.1 ng/mL for the HPLC method [87]. Furthermore, the correlation between the two methods was poor for samples with concentrations below 10 ng/mL, highlighting HPLC's limitations at very low concentrations [87]. For electrochemical sensors, the primary advantage is not necessarily beating the LOD of LC-MS, but providing a "fit-for-purpose" tool that offers sufficient sensitivity (e.g., meeting regulatory limits for drug residues) with unparalleled speed and portability for on-site analysis.
The Scientist's Toolkit: Essential Reagents and Materials
The following table lists key reagents, materials, and instruments required for the validation of analytical methods, adaptable for both chromatography and sensor development.
Table 3: Essential Research Reagent Solutions and Materials
| Item | Function/Application |
|---|---|
| Certified Reference Materials (CRMs) | Provides the gold standard for analyte identity and concentration, used for accurate calibration standard preparation [89]. |
| Chromatography Columns (e.g., C18) | The stationary phase for HPLC/LC-MS that separates analytes based on chemical properties [88]. |
| Mass Spectrometry Grade Solvents & Volatile Buffers | Essential for LC-MS mobile phases to prevent ion suppression and instrument contamination [88]. |
| Electrode Functionalization Reagents (e.g., Aptamers, Antibodies) | Biorecognition elements immobilized on the sensor surface to provide specificity for the target drug residue. |
| Redox Mediators (e.g., Ferrocene, Methylene Blue) | Molecules that shuttle electrons, enhancing the electrochemical signal and improving sensitivity in sensors. |
| Quality Control (QC) Samples | Samples with known concentrations analyzed alongside unknowns to verify the method's accuracy and precision during a run [89]. |
Method Selection and Application Strategy
Choosing the right analytical method depends on the specific requirements of the drug residue analysis. The following decision diagram outlines a logical workflow for method selection based on key application needs.
Diagram 3: Analytical Method Selection Logic. A decision tree to guide the choice of technique based on the requirements for portability, sensitivity, and specificity.
Assessing Recovery Rates and Accuracy in Real Samples (e.g., Blood, Milk, Water)
The integration of electrochemical sensors into lab-on-a-chip (LoC) platforms with smartphone readout represents a transformative advancement for the detection of drug residues in complex sample matrices. These systems combine the high sensitivity of electrochemical detection with the portability, connectivity, and computational power of smartphones, creating powerful tools for on-site analysis [2]. A critical validation step for these emerging technologies is the rigorous assessment of their recovery rates and accuracy when analyzing real-world samples, which contain interfering substances that can complicate detection [48]. This document provides detailed application notes and protocols for evaluating the analytical performance of smartphone-integrated electrochemical LoC devices, with a focus on experiments involving blood, milk, and water samples.
The following tables summarize key performance metrics for electrochemical sensors applied to real samples, as reported in recent literature.
Table 1: Recovery Rates of Chloramphenicol in Real Samples Using a Smartphone-Assisted Electrochemical Sensor
| Sample Matrix | Spiked Concentration | Recovery Rate (%) | Relative Standard Deviation (RSD, %) | Citation |
|---|---|---|---|---|
| Milk | Not Specified | 97.8 - 103.2 | < 3.0 | [26] |
| Tap Water | Not Specified | 97.5 - 102.5 | < 3.0 | [26] |
| Human Blood Serum | Not Specified | 98.2 - 101.8 | < 3.0 | [26] |
| Eye Drops | Not Specified | 98.5 - 102.1 | < 3.0 | [26] |
Table 2: General Analytical Performance of Electrochemical Sensors for Drug Detection
| Analytical Parameter | Typical Performance | Key Influencing Factors |
|---|---|---|
| Limit of Detection (LOD) | Sub-micromolar to nanomolar range [48] | Electrode material, nanomaterial enhancement, detection technique [2] [48] |
| Linearity | Wide linear range (e.g., 0–600 μM for CAP) [26] | Surface homogeneity, binding affinity of recognition element [2] |
| Stability | ~90% signal retention after 21 days [26] | Sensor fouling, degradation of biological recognition elements [2] |
| Reproducibility | RSD < 3% [26] | Fabrication consistency, sample preparation uniformity [26] |
Detailed Experimental Protocols
Protocol for Sensor Fabrication and Modification
This protocol outlines the development of a nanomaterial-modified electrode for enhanced sensitivity, as used in the detection of chloramphenicol [26].
- Objective: To fabricate a graphene oxide and multi-walled carbon nanotube (GO@MWCNT) nanocomposite-based working electrode for a smartphone-integrated electrochemical platform.
Materials:
- Screen-printed carbon electrode (SPCE) or similar
- Graphene Oxide (GO) dispersion
- Multi-walled carbon nanotubes (MWCNTs)
- Suitable solvent (e.g., distilled water, ethanol)
- Ultrasonic bath
Procedure:
- Nanocomposite Preparation: Disperse calculated amounts of GO and MWCNTs in a solvent mixture. Subject the mixture to vigorous stirring and ultrasonication for a defined period (e.g., 30-60 minutes) to achieve a homogeneous suspension.
- Electrode Modification: Deposit a precise volume (e.g., 5-10 µL) of the GO@MWCNT suspension onto the working electrode surface of the SPCE.
- Drying and Stabilization: Allow the modified electrode to dry under ambient conditions or under an infrared lamp. The drying process forms a stable, thin film of the nanocomposite on the electrode surface.
Validation: Characterize the modified electrode using cyclic voltammetry (CV) in a standard redox probe (e.g., [Fe(CN)₆]³⁻/⁴⁻) to confirm enhanced electrocatalytic activity and electroactive surface area compared to an unmodified electrode [26].
Protocol for Sample Preparation and Recovery Analysis
This protocol details the standard addition method for determining recovery rates in complex matrices like milk, blood, and water.
- Objective: To quantify the concentration of a target drug (e.g., chloramphenicol) in a real sample and determine the method's accuracy via recovery rate calculation.
Materials:
- Real samples (raw milk, blood serum, tap water)
- Standard solution of the target analyte
- Sample-specific preparation reagents (e.g., buffers, precipitants)
- Centrifuge and vortex mixer
Procedure:
- Sample Pre-treatment:
- Milk: Centrifuge milk samples to remove fat and proteins. Dilute the clarified supernatant with a supporting electrolyte [26].
- Blood Serum: Centrifuge blood samples to obtain clear serum. Dilute the serum with an appropriate buffer solution [26].
- Water: Filter water samples to remove particulate matter. Adjust the pH if necessary.
- Standard Addition:
- Divide each pre-treated sample into several aliquots.
- Spike these aliquots with known, varying concentrations of the target drug standard.
- Include one unspiked aliquot as a control.
- Analysis:
- Calculation:
- Recovery Rate (%) = (Measured Concentration in Spiked Sample – Measured Concentration in Unspiked Sample) / Known Spiked Concentration × 100%
- The measured concentrations are determined from a calibration curve prepared with standard solutions.
- Sample Pre-treatment:
The Scientist's Toolkit: Key Research Reagent Solutions
Table 3: Essential Materials and Reagents for Sensor Development and Validation
| Item | Function / Role | Example Use Case |
|---|---|---|
| Graphene Oxide (GO) & Carbon Nanotubes (CNTs) | Nanomaterials that enhance electron transfer and provide a large surface area for probe immobilization, lowering the detection limit [2] [26]. | Signal amplification in chloramphenicol sensor [26]. |
| Screen-Printed Electrodes (SPEs) | Disposable, miniaturized, and mass-producible electrochemical cells ideal for portable LoC devices [48]. | Base transducer in portable smartphone-based platforms [26]. |
| Specific Recognition Elements (Aptamers, Antibodies, MIPs) | Provide high selectivity by binding specifically to the target analyte [2]. | Molecularly Imprinted Polymers (MIPs) used in antibiotic sensors [48]. |
| Sodium Lauryl Sulfate (SLS) | A denaturing and hemolyzing agent used to process blood-containing samples for spectrophotometric analysis [90]. | Quantifying hemoglobin in raw milk for objective blood-milk detection [90]. |
Workflow and Signaling Visualization
The following diagram illustrates the complete experimental workflow for assessing recovery rates and accuracy using a smartphone-integrated LoC platform.
Diagram 1: Workflow for accuracy and recovery assessment.
The core signaling transduction principle in these electrochemical sensors is summarized below.
Diagram 2: Signaling pathway in electrochemical biosensors.
Evaluating Portability, Cost-Effectiveness, and Analysis Time Against Laboratory Methods
The detection and monitoring of drug residues in agricultural and food products are critical for ensuring public health and compliance with food safety regulations. Traditional laboratory-based methods, while sensitive and reliable, are often time-consuming, expensive, and impractical for rapid, on-site testing. The integration of electrochemical sensors into lab-on-a-chip (LoC) platforms with smartphone readout presents a transformative approach, offering a viable alternative that emphasizes portability, cost-effectiveness, and rapid analysis. This paradigm shift supports the broader thesis that such integrated systems are poised to revolutionize drug residue monitoring by bridging the gap between sophisticated laboratory analysis and the pressing need for field-deployable tools. This document provides a detailed evaluation and protocol for employing these systems, focusing on their performance relative to conventional methods.
Comparative Analysis: Integrated LoC Systems vs. Laboratory Methods
The following tables provide a quantitative and qualitative comparison between smartphone-integrated electrochemical LoC systems and traditional laboratory techniques for drug residue analysis.
Table 1: Performance and Operational Comparison
| Parameter | Smartphone/LoC Electrochemical Systems | Traditional Laboratory Methods (HPLC, MS) |
|---|---|---|
| Analysis Time | Minutes to a few hours [2] [59] | Several hours to days [2] [59] |
| Portability | High; portable and field-deployable [2] [91] | Low; confined to laboratory settings [92] |
| Equipment Cost | Low-cost; affordable components and fabrication [2] [18] | High; expensive instrumentation [59] [92] |
| Sample Volume | Low (microliters) [2] [93] | High (milliliters) |
| User Skill Level | Minimal training required [2] [91] | Requires specialized technical expertise [59] [92] |
| Data Connectivity | Built-in wireless connectivity and cloud data transmission [2] [26] | Manual data transfer and processing |
Table 2: Analytical Performance for Specific Drug Residues
| Target Analyte | Detection Platform | Limit of Detection (LOD) | Linear Range | Sample Matrix | Reference |
|---|---|---|---|---|---|
| Chloramphenicol (CAP) | Smartphone/Wireless Potentiostat with GO@MWCNT | 46 nM | 0-600 µM | Milk, water, serum [26] | |
| Diclofenac Sodium (DFS) | Smartphone/MIP Paper-based Sensor | 0.007 µM | Not Specified | Milk, beef, water [59] | |
| DNA | LoC with Electrochemical Detection | Qualitative (Yes/No) | N/A | Amplified DNA samples [93] |
Key Technological Components and Workflow
The superior portability and cost profile of these systems are enabled by key technological advancements.
The Scientist's Toolkit: Essential Research Reagents and Materials
Table 3: Key Reagents and Materials for Sensor Fabrication and Operation
| Item | Function | Example |
|---|---|---|
| Nanomaterials | Enhance electrode conductivity and sensitivity; provide a large surface area for biorecognition element immobilization. | Graphene Oxide (GO), Multi-walled Carbon Nanotubes (MWCNTs) [2] [26], Gold Nanoparticles (AuNPs) [2] |
| Biorecognition Elements | Provide high specificity and selectivity for the target drug residue. | Enzymes, Antibodies, Aptamers, Molecularly Imprinted Polymers (MIPs) [2] [59] |
| Electrode Materials | Serve as the transducer for the electrochemical signal. | Screen-printed electrodes (SPEs), interdigitated electrodes (IDEs) made from gold, carbon, or copper [92] [94] |
| Portable Potentiostat | A compact electronic unit that applies potential and measures current. | PalmSens potentiostat, other custom-built systems [93] [26] |
| Microfluidic LabCard | A disposable chip that integrates sample preparation, mixing, separation, and detection. | Polymer-based cartridges with micro-channels and chambers [93] |
System Architecture and Workflow
The operational workflow of an integrated smartphone-LoC device for drug residue detection involves a seamless process from sample introduction to result visualization. The following diagram illustrates the core architecture and signaling pathway.
Detailed Experimental Protocols
Protocol 1: On-site Detection of Chloramphenicol using a Smartphone-based Wireless Potentiostat
This protocol is adapted from the work on monitoring chloramphenicol (CAP) in food and clinical samples [26].
1. Sensor Fabrication and Modification
- Materials: Graphene oxide (GO), multi-walled carbon nanotubes (MWCNTs), phosphate buffer saline (PBS), chloramphenicol standard, screen-printed carbon electrode (SPCE).
- Procedure:
- Prepare a nanocomposite by dispersing GO and MWCNTs in a suitable solvent (e.g., DMF) via ultrasonication for 1 hour.
- Drop-cast a precise volume (e.g., 5 µL) of the GO@MWCNT suspension onto the working electrode area of the SPCE.
- Allow the modified electrode to dry at room temperature, forming a stable, nanostructured sensing film.
2. Measurement and Data Acquisition
- Materials: Portable potentiostat (e.g., PalmSens), smartphone with dedicated application, test samples (milk, water).
- Procedure:
- Connect the portable potentiostat to the smartphone via Bluetooth.
- Place the modified SPCE into the potentiostat's interface.
- Add a measured volume (e.g., 50 µL) of the standard or pre-treated sample onto the electrode cell.
- Initiate the electrochemical measurement (e.g., Differential Pulse Voltammetry - DPV) from the smartphone app.
- The potentiostat applies the potential waveform and records the current response. This data is wirelessly transmitted to the smartphone.
3. Data Analysis and Validation
- Procedure:
- The smartphone application automatically plots the voltammogram and records the peak current.
- A pre-calibrated curve within the app converts the peak current into a chloramphenicol concentration.
- The result is displayed on the screen and can be saved or shared via cloud services.
- Validate the system's performance by comparing results obtained with the portable device against those from a traditional, commercial potentiostat (e.g., Autolab) [26].
Protocol 2: Dual-mode Detection of Diclofenac Sodium using a Paper-based Sensor
This protocol outlines the use of a molecularly imprinted polymer (MIP) paper sensor for diclofenac sodium (DFS) with smartphone-assisted colorimetric/fluorescence readout [59].
1. Sensor Preparation
- Materials: Whatman filter paper, CuS nanoflowers, molecularly imprinted polymer (MIP) solution, europium nitrate polymeric microspheres (EuPMs), DFS standard.
- Procedure:
- Synthesize CuS nanoflowers in situ on one zone of the filter paper to create the catalytic layer (Sensor I).
- Functionalize another zone of the paper with EuPMs to create the fluorescence probe layer (Sensor II).
- Laminate Sensor I vertically above Sensor II to create the integrated dual-mode platform.
2. Sample Assay and Signal Development
- Materials: Smartphone, dark box accessory, TMB substrate, hydrogen peroxide (H₂O₂).
- Procedure:
- Apply the liquid sample containing DFS to Sensor I.
- DFS is selectively captured by the MIP on Sensor I. The captured DFS influences the peroxidase-like activity of the CuS nanozymes in a TMB-H₂O₂ system.
- The oxidation of TMB produces a blue-colored product (oxTMB). The intensity of this color is inversely related to DFS concentration and can be imaged for colorimetric analysis.
- The oxTMB solution permeates into Sensor II, where it quenches the fluorescence of the EuPMs via an inner filter effect. The degree of quenching is proportional to the DFS concentration.
3. Smartphone Readout
- Procedure:
- Place the sensor inside a dark box to standardize imaging conditions.
- Capture images of both the colorimetric (Sensor I) and fluorescence (Sensor II) zones using the smartphone camera.
- Use a dedicated app to analyze the color intensity (e.g., RGB values) of the colorimetric zone and the fluorescence intensity of the fluorescent zone.
- The app correlates the intensity values to DFS concentration using a built-in calibration curve, providing a dual-mode verification of the result with high reliability.
The REASSURED criteria (Real-time connectivity, Ease of specimen collection, Affordable, Sensitive, Specific, User-friendly, Rapid and robust, Equipment-free, and Deliverable to end-users) represent the gold standard for modern point-of-care (POC) diagnostics. For researchers developing electrochemical sensors with smartphone readouts for drug residue analysis, transitioning from a laboratory prototype to a device that meets all these criteria requires a structured, multidisciplinary approach. This document provides a detailed application note and protocol to guide this complex process, focusing on the integration of technical development with stringent regulatory and commercial requirements.
From Laboratory Proof-of-Concept to Validated Prototype
The first major phase involves hardening your laboratory proof-of-concept into a robust and validated prototype suitable for real-world use.
Experimental Protocol: Analytical Performance Validation
This protocol outlines the key experiments required to validate the analytical performance of an electrochemical sensor for drug residues, such as tyrosine kinase inhibitors (TKIs) or other pharmaceuticals.
Objective: To comprehensively evaluate the sensitivity, selectivity, and accuracy of a smartphone-based electrochemical sensor for the detection of specific drug residues in biological fluids.
Materials and Reagents: Table 1: Key Research Reagent Solutions
| Reagent / Material | Function / Explanation |
|---|---|
| Screen-Printed Electrodes (SPEs) | Disposable, miniaturized electrochemical cells ideal for POC devices; provide a stable platform for sensor modifications [95] [96]. |
| Electroactive Nanocomposites (e.g., Ti3C2Tx MXenes, AuNPs, ZIF-8/GO) | Enhance electron transfer, increase electrode surface area, and improve sensitivity. They can be functionalized with recognition elements [95] [96] [97]. |
| Recognition Elements (e.g., Aptamers, Antibodies, Molecularly Imprinted Polymers) | Provide specificity by binding selectively to the target drug residue (analyte) [98] [99]. |
| Phosphate Buffered Saline (PBS) | A standard electrolyte solution that maintains a stable pH (e.g., 7.4) for electrochemical reactions [95]. |
| Standard Drug Solutions | Pure analytical standards of the target drug (e.g., Imatinib, Nilotinib) used for calibration and validation [98]. |
| Interferent Solutions | Substances like ascorbic acid, uric acid, urea, and glucose used to test the sensor's selectivity against common interferents in biofluids [95] [98]. |
Procedure:
- Sensor Fabrication: Modify the working electrode of the SPE. For example, drop-cast a nanocomposite suspension (e.g., Ti3C2Tx@poly(l-Arg)) and allow it to dry. Immobilize the specific biorecognition element (e.g., aptamer) onto the modified surface [95] [98].
- Calibration Curve: Prepare a series of standard solutions of the target drug across the expected concentration range (e.g., 1–200 µM for creatinine [95]). Analyze each concentration using the chosen electrochemical technique (e.g., Differential Pulse Voltammetry - DPV). Record the resulting current (or potential) response.
- Limit of Detection (LOD) & Quantification (LOQ): Calculate the LOD and LOQ from the calibration data. Typically, LOD = 3.3σ/S and LOQ = 10σ/S, where σ is the standard deviation of the blank response and S is the slope of the calibration curve [95] [98].
- Selectivity Testing: Measure the sensor's response to the target drug at a fixed concentration. Then, measure the response in the presence of potentially interfering substances at physiologically relevant concentrations. The signal change should be minimal (<5%) for a selective sensor [95].
- Reproducibility and Stability: Fabricate multiple sensors (n≥5) from different batches and test them with the same standard. Calculate the relative standard deviation (RSD) to assess reproducibility. Perform stability tests by storing sensors and measuring their response over time (e.g., for two weeks) [95].
Performance Data and Benchmarking
The performance of your developed sensor should be benchmarked against existing methods and literature. The table below summarizes exemplary performance metrics from recent research.
Table 2: Analytical Performance of Exemplary Electrochemical Sensors
| Target Analyte | Sensor Platform | Linear Range | Limit of Detection (LOD) | Real Sample Tested | Ref. |
|---|---|---|---|---|---|
| Creatinine | Ti3C2Tx@poly(l-Arg) / Smartphone | 1 – 200 µM | 0.05 µM | Human blood serum | [95] |
| Methicillin-Resistant Staphylococcus aureus (MRSA) | Nisin@AuNPs / ZIF-8/GO / Smartphone (e-LFIA) | Not Specified | 9 CFU/10 mL | Real food samples | [96] |
| Tyrosine Kinase Inhibitors (TKIs) | Various electrochemical platforms | Varies by specific TKI | High sensitivity (pM-nM range reported) | Blood serum, Urine | [98] |
| Dopamine | Mn-doped MoS2 | Not Specified | 0.05 nM | Artificial sweat | [97] |
Diagram 1: Prototype Development & Validation Workflow
Navigating the Regulatory and Commercialization Pathway
A successful REASSURED device must be designed for regulatory compliance from the outset. This involves adhering to quality management systems and specific device standards.
Protocol: Integrating a Quality Management System (QMS)
Objective: To establish a framework for design control, risk management, and documentation that aligns with international regulatory requirements for medical devices.
Procedure:
- Implement ISO 13485: Establish and document a Quality Management System based on ISO 13485, the international standard for medical devices. This system governs all aspects of design, development, production, and post-market surveillance [100] [101].
- Apply Risk Management per ISO 14971: Systematically identify and mitigate risks associated with your device throughout its lifecycle using the principles of ISO 14971. This includes risks related to electrical safety, software, and biological samples [100] [101].
- Address Software Lifecycle per IEC 62304: For the smartphone application and any embedded firmware, follow the software development lifecycle processes outlined in IEC 62304 to ensure software safety and reliability [100].
- Implement Cybersecurity per IEC 81001-5-1: Integrate cybersecurity measures into the software development lifecycle. This standard mandates security controls, vulnerability assessments, and penetration testing, especially critical for connected devices [102].
- Ensure Electrical Safety per IEC 60601: If your device includes any electrical components (e.g., a miniaturized potentiostat), compliance with the IEC 60601 series for medical electrical equipment is essential [100] [101].
- Plan for Clinical Evaluation (ISO 14155): Design and plan clinical investigations to gather data on the device's safety and performance in the intended use environment, following good clinical practices [100].
Key Standards and Their Implications
Table 3: Essential Quality and Regulatory Standards for REASSURED Devices
| Standard | Title / Focus | Critical Relevance to Smartphone Electrochemical Sensors |
|---|---|---|
| ISO 13485 | Quality Management Systems for Medical Devices | Provides the overarching framework for all quality processes, from design control to supplier management. Certification is often a prerequisite for market approval [100] [101]. |
| ISO 14971 | Application of Risk Management to Medical Devices | Guides the identification of risks (e.g., incorrect result due to interferent, software bug, connectivity failure) and implementation of control measures [100] [101]. |
| IEC 62304 | Medical Device Software – Software Life Cycle Processes | Mandates rigorous processes for the development, validation, and maintenance of the smartphone application that controls the sensor and interprets data [100]. |
| IEC 81001-5-1 | Security, Safety and Effectiveness in Health Software | Specifically addresses cybersecurity for connected medical devices, requiring secure data transmission and protection against unauthorized access [102]. |
| ISO 14155 | Clinical investigation of medical devices in human subjects | Governs the design and conduct of clinical studies needed to prove the device's performance and safety for its intended use [100]. |
| EU MDR | European Medical Device Regulation | A stringent regulatory framework in Europe that requires extensive clinical evidence, post-market surveillance, and quality system adherence [103]. |
Diagram 2: Regulatory Compliance Relationships
The journey from a promising research prototype to a commercial REASSURED-compliant device is iterative and parallel. Technical development of the sensor, the smartphone interface, and the consumables must proceed hand-in-hand with the implementation of a robust Quality Management System and adherence to relevant regulatory standards. By following the structured experimental and procedural guidelines outlined in this document, researchers can significantly de-risk the development process and create a viable path toward delivering a transformative diagnostic tool to the end-user.
Conclusion
The integration of electrochemical sensors onto lab-on-a-chip platforms with smartphone readout represents a paradigm shift in drug residue analysis, moving detection from centralized laboratories to the point-of-need. This synthesis confirms that these systems meet the critical demands for high sensitivity, portability, and user-friendliness. Key takeaways include the proven efficacy of nanomaterials like graphene and CNTs in boosting sensor performance, the successful validation of these devices against gold-standard methods in complex matrices, and the central role of smartphones in democratizing diagnostics. Future directions should focus on developing multi-analyte detection chips, incorporating AI-powered data analysis for enhanced accuracy, creating robust commercial products that meet REASSURED criteria, and expanding applications into personalized medicine and environmental surveillance. This technology holds immense potential to reshape monitoring protocols across biomedical research, clinical diagnostics, and the global food supply chain.
References
- 1. Smartphone-Integrated Electrochemical Devices for ... [https://pmc.ncbi.nlm.nih.gov/articles/PMC12467198/]
- 2. Smartphone-Integrated Electrochemical Devices for ... [https://www.mdpi.com/2079-6374/15/9/574]
- 3. Recent Advances in the Development of Portable ... [https://pmc.ncbi.nlm.nih.gov/articles/PMC10058808/]
- 4. Comparison of four different multiclass, multiresidue ... [https://pubmed.ncbi.nlm.nih.gov/33713145/]
- 5. Wireless & portable smartphone assisted electrochemical ... [https://www.sciencedirect.com/science/article/abs/pii/S0956566325005688]
- 6. Side-by-Side Comparison of Methods for Environmental ... [https://pmc.ncbi.nlm.nih.gov/articles/PMC10049775/]
- 7. Electrochemical Biosensors Driving Model Transformation ... [https://www.mdpi.com/2304-8158/14/15/2669]
- 8. Lab-on-a-Chip Biosensors for Drug Safety and Health [https://esmed.org/lab-on-a-chip-biosensors-for-drug-safety-and-health/]
- 9. Lab on chip for medical and clinical applications [https://pubs.rsc.org/en/content/articlehtml/2025/sd/d5sd00096c]
- 10. Electrochemistry and Microfluidics : A short review [https://elveflow.com/microfluidic-reviews/electrochemistry-and-microfluidics-a-short-review/]
- 11. PNA-Based Biosensors for Portable Electrochemical ... [https://www.sciencedirect.com/science/article/pii/S2590137025001293]
- 12. An electrochemical sensor integrated lab-on-a-CD system ... [https://pubs.rsc.org/en/content/articlelanding/2025/lc/d4lc00912f]
- 13. Rapid and Accurate Detection of Crop Viruses by ... [https://pubs.rsc.org/en/content/articlelanding/2025/ay/d5ay01205h]
- 14. Basics of Electrochemical Impedance Spectroscopy [https://www.gamry.com/application-notes/EIS/basics-of-electrochemical-impedance-spectroscopy/]
- 15. Graphene-Based Biosensors: Enabling the Next Generation of ... [https://pmc.ncbi.nlm.nih.gov/articles/PMC12467994/]
- 16. a state-of-the-art review and future perspectives [https://enveurope.springeropen.com/articles/10.1186/s12302-025-01138-1]
- 17. Review Application and Development of Electrochemical ... [https://www.sciencedirect.com/science/article/abs/pii/S100068182400064X]
- 18. Recent Progress in Low-cost Methods for Electrochemical ... [https://www.sciencedirect.com/science/article/pii/S2451910325001309]
- 19. Smart microfluidic devices integrated in electrochemical ... [https://link.springer.com/article/10.1007/s00216-025-06127-0]
- 20. Microfluidic Sensors Integrated with Smartphones for ... [https://pmc.ncbi.nlm.nih.gov/articles/PMC12298308/]
- 21. Guide to Selecting a Biorecognition Element for Biosensors [https://pmc.ncbi.nlm.nih.gov/articles/PMC6416154/]
- 22. Molecularly Imprinted Polymer-Based Sensor for ... [https://pmc.ncbi.nlm.nih.gov/articles/PMC9776045/]
- 23. Recent advances in molecularly imprinted polymer-based ... [https://www.sciencedirect.com/science/article/pii/S0956566324000216]
- 24. Recent progress on electrochemical (bio)sensors based on ... [https://www.sciencedirect.com/science/article/pii/S266605392200039X]
- 25. Smartphone electrochemical sensor based on laser ... [https://pubmed.ncbi.nlm.nih.gov/40974437/]
- 26. Wireless & portable smartphone assisted electrochemical ... [https://pubmed.ncbi.nlm.nih.gov/40541509/]
- 27. Engineering signal interfaces for enhanced ... [https://www.sciencedirect.com/science/article/abs/pii/S0165993625001785]
- 28. A smartphone-based portable electrochemical sensor ... [https://pubmed.ncbi.nlm.nih.gov/40080158/]
- 29. MobileDetect - Apps on Google Play [https://play.google.com/store/apps/details?id=com.detectachem.MobileDetect&hl=en_US]
- 30. A portable smartphone-integrated microcavity sensor ... [https://www.sciencedirect.com/science/article/abs/pii/S0026265X25025160]
- 31. Portable Data Acquisition System for Nano and Ultra-Micro ... [https://chemrxiv.org/engage/chemrxiv/article-details/60c74b56f96a007bcb2875b5]
- 32. Double-Sided Tape in Microfluidics: A Cost-Effective ... [https://www.mdpi.com/2079-6374/14/5/249]
- 33. Roll-to-roll fabrication of paper-tape electrochemical ... [https://www.sciencedirect.com/science/article/abs/pii/S138589472511070X]
- 34. a promising analytical tool for on-site detection of mycotoxins [https://www.nature.com/articles/s41538-025-00444-5]
- 35. Microfluidic technologies for wearable and implantable ... [https://pubs.rsc.org/en/content/articlehtml/2025/lc/d5lc00499c]
- 36. Touch-Enabled Reversible Microfluidic Ultradense Chips ... [https://pmc.ncbi.nlm.nih.gov/articles/PMC12356537/]
- 37. analysis of anticancer and antibiotic Electrochemical in water... drugs [https://pubs.rsc.org/en/content/articlelanding/2024/ra/d4ra05685j]
- 38. Recent advances in electrochemical sensors and biosensors ... [https://pmc.ncbi.nlm.nih.gov/articles/PMC10262219/]
- 39. The Application of Nanomaterials for the Electrochemical ... Detection [https://pmc.ncbi.nlm.nih.gov/articles/PMC8000799/]
- 40. (PDF) Electrochemical -based nanomaterial /biosensors for... sensors [https://www.academia.edu/90289492/Electrochemical_nanomaterial_based_sensors_biosensors_for_drug_monitoring]
- 41. of Application -modified nanomaterial in... electrochemical sensors [https://drpress.org/ojs/index.php/HSET/article/view/9910]
- 42. Electrochemical methods for on-site multidrug detection at ... [https://pubs.rsc.org/en/content/articlehtml/2022/sd/d2sd00043a]
- 43. Material and structural considerations for high-performance ... [https://www.nature.com/articles/s43246-024-00490-8]
- 44. Modern designs of electrochemical sensor for accurate ... [https://www.sciencedirect.com/science/article/abs/pii/S0254058425002342]
- 45. Electrochemical genosensors on-a-chip: Applications in ... [https://www.sciencedirect.com/science/article/pii/S2666053925000530]
- 46. An open-source smartphone app for the quantitative ... [https://www.nature.com/articles/s41598-022-17527-y]
- 47. Real-time personal healthcare data analysis using edge ... [https://www.sciencedirect.com/science/article/pii/S266699862400543X]
- 48. Recent Advances in Electrochemical Sensors for the ... [https://pmc.ncbi.nlm.nih.gov/articles/PMC12563010/]
- 49. Electrochemical Sensors for Chloramphenicol: Advances in ... [https://pmc.ncbi.nlm.nih.gov/articles/PMC12472270/]
- 50. Development of an Aptamer-Based Surface Plasmon ... [https://www.mdpi.com/2079-6374/15/11/706]
- 51. Recent Advances in Smart Phone-Based Biosensors for ... [https://www.mdpi.com/2227-9040/13/7/221]
- 52. An Effective Electrochemical Platform for Chloramphenicol ... [https://www.mdpi.com/2079-6374/13/1/116]
- 53. Drug Residues and Microbial Contamination in Food - NCBI [https://www.ncbi.nlm.nih.gov/books/NBK232575/]
- 54. Smartphone-Operated Wireless Chemical Sensors: A Review [https://www.mdpi.com/2227-9040/10/2/55]
- 55. Cost-effective smartphone-based reconfigurable ... [https://www.sciencedirect.com/science/article/abs/pii/S0956566318304755]
- 56. Quantitative determination of drug residues in surfaces ... [https://www.sciencedirect.com/science/article/abs/pii/S0003267025010244]
- 57. Non-Specific Adsorption Reduction Methods in Biosensing [https://pmc.ncbi.nlm.nih.gov/articles/PMC6603772/]
- 58. Methods of Protection of Electrochemical Sensors against Biofouling in Cell Culture Applications - PMC [https://pmc.ncbi.nlm.nih.gov/articles/PMC10831843/]
- 59. Smartphone-enabled molecularly imprinted paper-based ... [https://www.sciencedirect.com/science/article/abs/pii/S0963996925022574]
- 60. Innovative approaches to suppress non-specific adsorption ... [https://www.sciencedirect.com/science/article/abs/pii/S0956566324000563]
- 61. Recent advances in bio-microsystem integration and Lab- ... [https://www.nature.com/articles/s41378-025-00940-4]
- 62. Strategies for enhancing the analytical performance of ... [https://pmc.ncbi.nlm.nih.gov/articles/PMC7126169/]
- 63. Improving Short Term Instability for Quantitative Analyses ... [https://pmc.ncbi.nlm.nih.gov/articles/PMC4118332/]
- 64. Machine learning-enhanced drug testing for simultaneous ... [https://www.nature.com/articles/s41598-024-58843-9]
- 65. Passive micropumping in microfluidics for point-of-care ... [https://pmc.ncbi.nlm.nih.gov/articles/PMC7263483/]
- 66. Microfluidic flow-cell with passive flow control for microscopy ... [https://journals.plos.org/plosone/article?id=10.1371/journal.pone.0244103]
- 67. Novel Pumping Methods for Microfluidic Devices [https://www.mdpi.com/2079-6374/12/11/956]
- 68. A compact microfluidic gradient generator using passive ... [https://pmc.ncbi.nlm.nih.gov/articles/PMC3377175/]
- 69. Smart Multiplex Point-of-Care Platform for Simultaneous Drug ... [https://pmc.ncbi.nlm.nih.gov/articles/PMC10416146/]
- 70. Nanomaterial-based adsorbents and optical sensors for ... [https://pmc.ncbi.nlm.nih.gov/articles/PMC9261814/]
- 71. Advances in nanotechnology for illicit drug detection [https://www.sciencedirect.com/science/article/abs/pii/S0379073825001884]
- 72. One-Step Multipurpose Surface Functionalization by ... [https://pmc.ncbi.nlm.nih.gov/articles/PMC3619432/]
- 73. Improving the limit of detection of nanoscale sensors by ... [https://pubmed.ncbi.nlm.nih.gov/20377272/]
- 74. Enhancing the Detection Limit of Nanoscale Biosensors via ... [https://pmc.ncbi.nlm.nih.gov/articles/PMC3923412/]
- 75. Elimination of electrochemical interferences in glucose ... [https://www.sciencedirect.com/science/article/abs/pii/S0165993610000269]
- 76. Affinity-based electrochemical sensors for biomolecular ... [https://pmc.ncbi.nlm.nih.gov/articles/PMC10011785/]
- 77. Open-Source Potentiostat for Wireless Electrochemical ... [https://pmc.ncbi.nlm.nih.gov/articles/PMC5997382/]
- 78. We-VoltamoStat: A wearable potentiostat for voltammetry ... [https://www.sciencedirect.com/science/article/pii/S2468067223000482]
- 79. Smartphone-Based Electrochemical Potentiostat Detection ... [https://pmc.ncbi.nlm.nih.gov/articles/PMC7285078/]
- 80. Smartphone-assisted portable electrochemical sensing ... [https://www.sciencedirect.com/science/article/abs/pii/S0003267025007597]
- 81. Chapter 7 - Sensitivity and Limit of Detection [https://www.sciencedirect.com/science/chapter/bookseries/pii/S092234870870220X]
- 82. Key Parameters for Analytical Method Validation in Pharma [https://www.linkedin.com/posts/manoj-k-more-a12540293_analytical-method-validation-2025-updates-activity-7374711263710392320--2bA]
- 83. Limit of Blank, Limit of Detection and Limit of Quantitation [https://pmc.ncbi.nlm.nih.gov/articles/PMC2556583/]
- 84. Managing the Analytical Life-Cycle for Biotechnology ... [https://www.bioprocessintl.com/bioanalytical-methods/managing-the-analytical-life-cycle-for-biotechnology-products]
- 85. An Explanation of Sensitivity and the LLD, LLOQ, and ... [https://www.quansysbio.com/support/explanation-of-sensitivity-lld-lloq-and-uloq/]
- 86. Calibration: Effects on Accuracy and Detection Limits in ... [https://www.spectroscopyonline.com/view/calibration-effects-on-accuracy-and-detection-limits-in-atomic-spectroscopy]
- 87. Evaluation of High Performance Liquid Chromatography ... [https://pubmed.ncbi.nlm.nih.gov/27468563/]
- 88. HPLC vs. LCMS: Which to Choose? 5 Key Points to Consider [https://www.hplcvials.com/news/hplc-vs-lcms-which-to-choose-5-key-points-to-consider.html]
- 89. The Hidden Risks in Analytical Method Validation - [https://pharmuni.com/2025/05/16/the-hidden-risks-in-analytical-method-validation/]
- 90. Development of a novel procedure for detecting bloody ... [https://www.sciencedirect.com/science/article/abs/pii/S0308814625017534]
- 91. Smartphone-based mobile biosensors for the point-of-care ... [https://www.sciencedirect.com/science/article/pii/S2590006422000527]
- 92. Electrochemical and Optical Sensors for Real-Time Detection ... [https://pmc.ncbi.nlm.nih.gov/articles/PMC10457996/]
- 93. Development and integration of an electrochemical system ... [https://www.sciencedirect.com/science/article/abs/pii/S0925400512013925]
- 94. Electrochemical Sensors for Clinic Analysis - PMC [https://pmc.ncbi.nlm.nih.gov/articles/PMC3673406/]
- 95. A portable smartphone-based electrochemical sensing ... [https://pmc.ncbi.nlm.nih.gov/articles/PMC12261076/]
- 96. A smartphone based electrochemical/visible light dual ... [https://www.sciencedirect.com/science/article/abs/pii/S0925400524017301]
- 97. Polymer-Based Electrochemical Sensors for the Diagnosis ... [https://link.springer.com/article/10.1007/s10571-025-01570-0]
- 98. Electrochemical sensors for anticancer drugs used in the ... [https://pmc.ncbi.nlm.nih.gov/articles/PMC12335299/]
- 99. Electrochemical (Bio)Sensors for Toxins, Foodborne ... [https://www.mdpi.com/2079-6374/15/7/468]
- 100. Understanding ISO Standards for Medical Devices [https://amtivo.com/us/resources/insights/understanding-iso-standards-for-medical-devices/]
- 101. Top 10 Quality Standards Every Medical Device Must Meet [https://www.bioaccessla.com/blog/top-10-quality-standards-every-medical-device-must-meet]
- 102. IEC 81001-5-1: The Essential Standard for Medical Device ... [https://www.intertek.com/blog/2025/03-11-iec-81001-5-1/]
- 103. Compliance with strict regulatory requirements and standards [https://me.resmed.com/impact/protecting-your-data/compliance/]