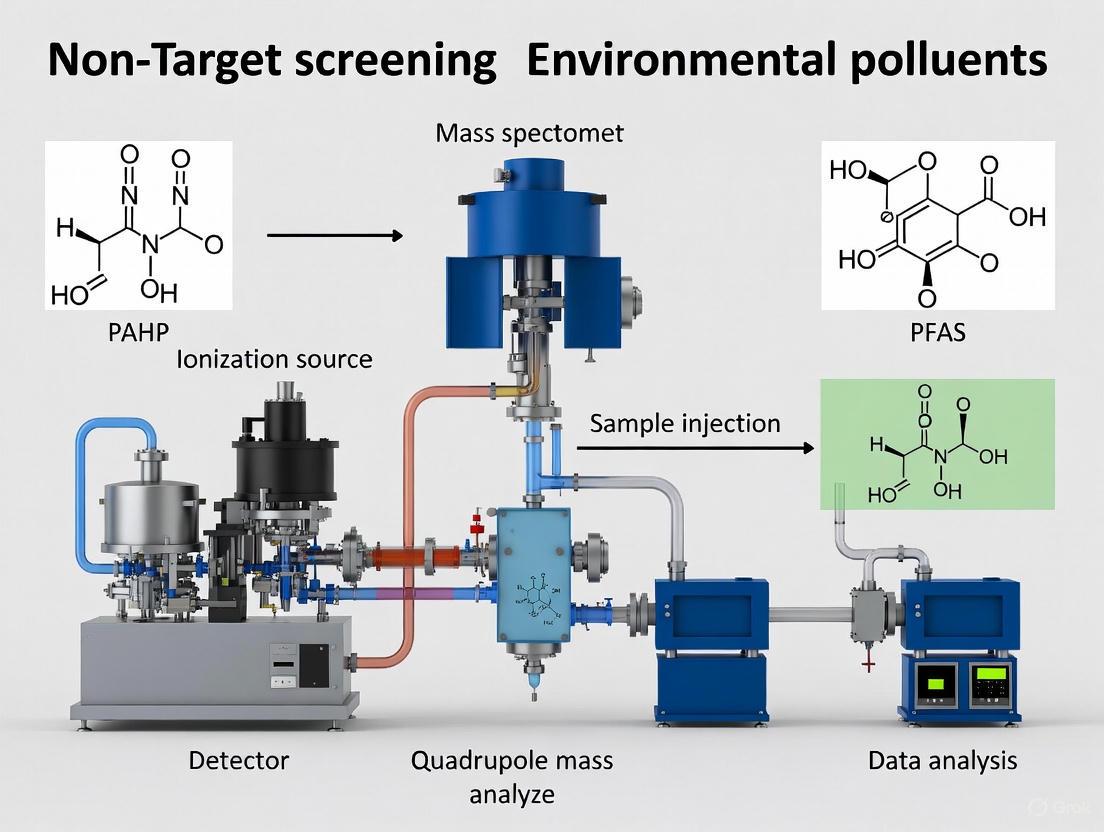
Unveiling the Chemical Universe: A Comprehensive Guide to HRMS for Non-Target Screening of Environmental Pollutants
This article provides a comprehensive overview of the application of High-Resolution Mass Spectrometry (HRMS) in non-target screening (NTS) for identifying unknown and emerging environmental contaminants.
Unveiling the Chemical Universe: A Comprehensive Guide to HRMS for Non-Target Screening of Environmental Pollutants
Abstract
This article provides a comprehensive overview of the application of High-Resolution Mass Spectrometry (HRMS) in non-target screening (NTS) for identifying unknown and emerging environmental contaminants. Tailored for researchers, scientists, and drug development professionals, it explores the foundational principles of NTS, detailing advanced methodological workflows from data acquisition to processing. The content addresses key challenges in troubleshooting and optimization, and critically evaluates validation strategies and comparative performance against traditional techniques. By synthesizing current research and real-world applications, this guide serves as a vital resource for leveraging HRMS to achieve a holistic understanding of complex environmental pollutant mixtures, thereby enhancing regulatory science and prioritization efforts.
The New Paradigm: Why HRMS and Non-Target Screening are Revolutionizing Environmental Analysis
Traditional environmental monitoring frameworks, such as the European Water Framework Directive (WFD), focus on a limited set of priority substances (PS) and River Basin Specific Pollutants (RBSP). While this approach is useful for regulating known contaminants, it overlooks the vast majority of chemical pollutants present in the environment. Current WFD monitoring addresses only 45 priority substances across the EU, with member states monitoring an average of approximately 55 regulated compounds per river catchment [1]. This represents just a fraction of the over 350,000 chemicals and chemical mixtures registered for commercial use globally [2]. This narrow focus creates a significant gap in environmental risk assessment, allowing newly emerging contaminants and transformation products to remain undetected until they potentially cause ecological harm.
High-resolution mass spectrometry (HRMS) enables non-target screening (NTS), a powerful approach that moves beyond conventional targeted analysis. Unlike targeted methods that look for predefined compounds, NTS employs broad screening to detect thousands of organic substances simultaneously in a single analysis [3]. This paradigm shift allows researchers to identify chemicals of emerging concern (CECs), transformation products, and previously unknown contaminants, providing a more comprehensive basis for environmental monitoring and protection [1].
The NTS Solution: A Multi-Dimensional Approach
Non-target screening with HRMS generates extensive datasets, often containing thousands of chemical features per sample. The major challenge lies in prioritizing these features for identification. Recent research has established that no single strategy is sufficient; instead, a combination of complementary approaches is required to focus resources on the most relevant contaminants [4]. The integration of seven key prioritization strategies creates a robust framework for efficient compound identification.
Table 1: The Seven Key Prioritization Strategies for Non-Target Screening
| Strategy Number | Strategy Name | Core Principle | Key Applications |
|---|---|---|---|
| P1 | Target and Suspect Screening | Matching features against predefined databases of known or suspected contaminants | Identifying compounds with known environmental relevance; early complexity reduction |
| P2 | Data Quality Filtering | Applying quality control measures to remove artifacts and unreliable signals | Foundation step to reduce false positives and improve data accuracy |
| P3 | Chemistry-Driven Prioritization | Using HRMS data properties to prioritize specific compound classes | Finding halogenated compounds (e.g., PFAS), transformation products, homologues |
| P4 | Process-Driven Prioritization | Using spatial, temporal, or process-based comparisons | Identifying persistent compounds, newly formed compounds, source apportionment |
| P5 | Effect-Directed Prioritization | Linking chemical features to biological effects | Directly targeting bioactive contaminants; virtual EDA (vEDA) using statistical models |
| P6 | Prediction-Based Prioritization | Using models and machine learning to estimate risk or concentration | Calculating risk quotients (PEC/PNEC) without full structural elucidation |
| P7 | Pixel- or Tile-Based Analysis | Using the chromatographic image to pinpoint regions of interest | Managing complex datasets (especially 2D chromatography); early-stage exploration |
These strategies can be grouped into four complementary domains that address different aspects of feature reduction: chemical (P1, P3), toxicological (P5, P6), external (P4), and preprocessing (P2, P7) [4]. The sequential application of these strategies enables a stepwise reduction from thousands of detected features to a manageable number of high-priority compounds worthy of further investigation.
Workflow Integration and Cumulative Filtering
The power of these prioritization strategies emerges from their integration into a cohesive workflow. For example, an initial analysis might detect 5,000 features in an environmental sample. Target and suspect screening (P1) could flag 300 of these as known or suspected contaminants. Data quality filtering (P2) and chemistry-driven prioritization (P3) might then reduce this list to 100 features by removing low-quality signals and chemically irrelevant compounds. Subsequent process-driven prioritization (P4) could identify 20 features linked to poor removal in a wastewater treatment plant. Finally, effect-directed (P5) and prediction-based (P6) prioritization might highlight 10 features present in a toxic fraction, with 5 ultimately prioritized based on predicted risk [4]. This cumulative filtering approach efficiently narrows complex datasets to a focused list of environmentally relevant contaminants.
Detailed Experimental Protocols
Protocol 1: Implementing an Integrated Prioritization Workflow
This protocol outlines the step-by-step procedure for applying the seven prioritization strategies to NTS data, from initial data acquisition to final compound identification.
3.1.1 Materials and Equipment
- Liquid chromatography system coupled to high-resolution mass spectrometer (LC-HRMS)
- Sample set including environmental samples, blanks, and quality controls
- Data processing software (e.g., MZmine 2, XCMS)
- Compound databases (e.g., PubChemLite, CompTox Chemicals Dashboard, NORMAN Suspect List Exchange)
- Statistical analysis software (e.g., R, Python with appropriate packages)
3.1.2 Procedure
- Sample Preparation and Analysis
- Prepare samples using appropriate extraction methods (e.g., solid-phase extraction for water samples)
- Analyze samples using LC-HRMS with data-dependent acquisition (DDA) or data-independent acquisition (DIA)
- Include procedural blanks, solvent blanks, and quality control samples (pooled quality control) throughout the sequence
Data Preprocessing and Feature Detection
- Convert raw data to open formats (e.g., mzML)
- Perform peak picking, retention time alignment, and gap filling using data processing software
- Generate a feature table containing m/z, retention time, and intensity values
Sequential Prioritization
- Apply P1 (Target and Suspect Screening): Screen features against suspect lists of known environmental contaminants using precise mass (typically < 5 ppm error) and isotope patterns
- Apply P2 (Data Quality Filtering): Remove features present in blanks, those with poor peak shapes, and those showing low reproducibility across replicates
- Apply P3 (Chemistry-Driven Prioritization): Use mass defect filtering to identify halogenated compounds; search for homologous series and diagnostic fragments
- Apply P4 (Process-Driven Prioritization): Compare feature intensities across sample groups (e.g., upstream vs. downstream, influent vs. effluent) using statistical tests; perform correlation analysis with process parameters
- Apply P5 (Effect-Directed Prioritization): Correlate feature intensities with biological effect data; for virtual EDA, use statistical models like partial least squares discriminant analysis
- Apply P6 (Prediction-Based Prioritization): Use in silico tools (e.g., MS2Quant, MS2Tox) to predict concentration and toxicity; calculate risk quotients
- Apply P7 (Pixel-Based Approaches): For complex samples, apply pixel-based analysis before feature detection to identify regions of interest
Compound Identification
- Acquire MS/MS spectra for prioritized features
- Compare experimental spectra with spectral libraries (e.g., MassBank, NIST)
- Use in silico fragmentation tools to predict spectra for candidate structures
- Apply confidence levels for identification according to established guidelines
Validation
- Confirm identities using analytical standards when available
- Perform semi-quantification for prioritized compounds
- Integrate results with risk assessment frameworks
Protocol 2: Toxicological Priority Index (ToxPi) for Risk-Based Prioritization
This protocol details the procedure for implementing the Toxicological Priority Index (ToxPi), a semi-quantitative risk scoring system that integrates multiple criteria to prioritize contaminants based on their potential risk.
3.2.1 Materials and Equipment
- List of identified compounds from NTS
- Chemical property prediction software (e.g., OPERA, EPI Suite)
- Toxicity databases (e.g., CompTox Chemicals Dashboard, ECOTOX)
- Statistical software with visualization capabilities
3.2.2 Procedure
- Data Matrix Compilation
- For each compound, compile the following parameters:
- Detection frequency across samples
- Mean relative abundance (peak area)
- Bioconversion half-life (experimental or predicted)
- Bioconcentration factor (BCF) or bioaccumulation factor (experimental or predicted)
- Predicted no-effect concentration (PNEC)
- For each compound, compile the following parameters:
Data Normalization
- Normalize each parameter to a 0-1 scale using min-max normalization or percentile ranking
- For negative correlates (e.g., PNEC), invert the scale so higher values indicate higher concern
ToxPi Calculation
- Calculate the overall ToxPi score as a weighted sum of normalized values
- Alternatively, use the ToxPi graphical approach, slicing the score into wedges representing different parameters
Priority Setting
- Rank compounds based on their ToxPi scores
- Set a threshold for priority concern (e.g., mean + 1 standard deviation of all scores)
- Visually inspect the ToxPi profiles to understand the drivers of concern for high-priority compounds
Application
- Focus further resources (standard acquisition, monitoring) on high-priority compounds
- Use the results to inform regulatory monitoring programs and risk management decisions
Table 2: Case Study Application of NTS and ToxPi in Tropical Island Watersheds [5]
| Study Aspect | Application Details | Key Outcomes |
|---|---|---|
| Sample Location | Three major rivers in Hainan Province: Changhua, Wanquan, and Nandu | Comprehensive characterization of emerging pollutants in understudied tropical ecosystems |
| NTS Results | 177 high-confidence compounds identified | Detected pharmaceuticals, industrial additives, pesticides, and natural products |
| Source Apportionment | Non-negative matrix factorization (NMF) machine learning approach | Revealed distinct anthropogenic signatures: domestic sewage, pharmaceutical discharges, agricultural runoff |
| Risk Prioritization | Toxicological Priority Index (ToxPi) with multiple criteria | Prioritized 29 substances of elevated concern (ToxPi > 4.41); key compounds: stearic acid, tretinoin, ethyl myristate |
| Framework Value | NTS combined with machine learning and semi-quantitative risk scoring | Established a replicable framework for pollution assessment under data-limited conditions |
Successful implementation of NTS requires both specialized materials and computational resources. The following table details key components of the NTS toolkit.
Table 3: Essential Research Reagents and Computational Tools for NTS
| Tool Category | Specific Tools/Resources | Function in NTS Workflow |
|---|---|---|
| HRMS Instrumentation | LC-HRMS, GC-HRMS, GC×GC-HRMS, LC×LC-HRMS | Separation and accurate mass measurement of complex environmental samples |
| Reference Standards | Analytical standards for target compounds, isotope-labeled internal standards | Quantification and confirmation of compound identities |
| Database Resources | PubChemLite, CompTox Dashboard, NORMAN Suspect List Exchange | Compound identification via mass and spectral matching |
| Spectral Libraries | MassBank, NIST HRMS Library, mzCloud | MS/MS spectrum matching for structural elucidation |
| Data Processing Software | MZmine 2, XCMS, MS-DIAL | Feature detection, alignment, and data reduction |
| In Silico Prediction | MS2Tox, MS2Quant, CFM-ID, MetFrag | Prediction of toxicity, concentration, and fragmentation patterns |
| Statistical Platforms | R, Python with specialized packages (e.g., patRoon, IPO) | Multivariate statistics, trend analysis, and data visualization |
The limitations of traditional monitoring approaches, focused on a narrow set of priority pollutants, are evident in the face of increasing chemical complexity in the environment. Non-target screening with HRMS, particularly when implementing integrated prioritization strategies, provides a powerful framework to address these limitations. By combining chemical, toxicological, and process-based approaches, researchers can efficiently transition from thousands of detected features to a focused list of high-priority contaminants deserving further investigation and potential regulatory attention.
The future of comprehensive environmental monitoring lies in the widespread adoption of these approaches, enhanced by harmonized protocols, open data exchange, and interdisciplinary collaboration. As these methodologies continue to mature and become more accessible, they will play an increasingly vital role in protecting ecosystem and human health from the complex mixture of pollutants present in our environment.
High-Resolution Mass Spectrometry (HRMS) has revolutionized environmental monitoring by enabling non-target screening (NTS) to detect and identify unknown chemical contaminants. A foundational capability of HRMS-based NTS is the creation of a digital archive of full-scan HRMS analyses and HRMS/MS spectra [1]. This archive can be exploited retrospectively as new concerns or knowledge about specific substances emerge, providing a powerful mechanism for proactive chemical risk assessment [1]. This application note details the protocols for leveraging digital archiving to investigate future environmental threats without re-sampling, framed within broader research on HRMS for non-target screening of environmental pollutants.
The Digital Archiving Workflow
The digital archiving workflow transforms raw environmental sample data into a reusable knowledge base for retrospective investigation. The process, depicted in the diagram below, ensures that data acquired today remains valuable for addressing tomorrow's analytical challenges.
This workflow enables researchers to investigate compounds that were not targets or even known at the time of original analysis, such as newly identified persistent, mobile, and toxic (PMT) substances or emerging transformation products [1] [6].
Key Applications and Quantitative Findings
Digital archiving has enabled significant discoveries across multiple environmental compartments. The table below summarizes key findings from recent studies utilizing retrospective analysis.
Table 1: Key Findings from Retrospective HRMS Studies in Environmental Monitoring
| Sample Matrix | Number of Features Detected | Prioritized Compounds | Key Findings | Reference |
|---|---|---|---|---|
| Urban Stormwater (First Flush) | 7,707 total features | 42 PMT/vPvM compounds | 66% of quantified PMTs present in >50% of samples; 11 PMTs first report in runoff | [6] |
| River Rhine Monitoring | Not specified | Quaternary phosphonium compounds | Significant emissions (tons/year) over at least a decade identified | [1] |
| Stormwater vs. Rainwater | 280 (LC-ESI-), 1,156 (GC-APCI) significantly different features | Tolytriazole, Methylsalicylate, 1,3-diphenylguanidine | Runoff considerably more polluted than rainwater | [6] |
Experimental Protocols
Protocol 1: Building a Retrospective HRMS Archive
Purpose: To establish a standardized procedure for creating digital archives of environmental samples suitable for retrospective NTS.
Materials:
- High-resolution mass spectrometer (Orbitrap, Q-TOF, or FT-ICR)
- Liquid or gas chromatography system
- Sample collection equipment appropriate for matrix
- Data storage system with adequate capacity and backup
Procedure:
Sample Collection and Preparation
- Collect representative environmental samples (water, soil, biota) using clean techniques
- For water matrices: Use solid-phase extraction (SPE) with mixed-mode cartridges to broaden compound coverage [7]
- For solid matrices: Employ accelerated solvent extraction with organic solvents
- Include procedural blanks, quality control samples, and replicates
HRMS Data Acquisition
- Utilize both data-dependent acquisition (DDA) and data-independent acquisition (DIA) methods for comprehensive coverage [8]
- Apply generic chromatographic gradients (e.g., 5-100% organic solvent) to maximize separation range [7]
- Use positive and negative electrospray ionization (ESI) modes for LC-HRMS analyses
- For GC-HRMS, employ electron ionization (EI) complemented by atmospheric pressure chemical ionization (APCI) for molecular ion information [7] [9]
- Store raw data in open, non-proprietary formats when possible to ensure long-term accessibility
Metadata Documentation
- Record comprehensive sample information: location, date, time, collection method, and preparation details
- Document instrument parameters: ionization settings, mass resolution, calibration status
- Track quality control measures and performance data
Protocol 2: Retrospective Suspect Screening for Emerging Contaminants
Purpose: To interrogate archived HRMS data for newly recognized contaminants of concern using updated suspect lists.
Materials:
- Archived HRMS data files in open or vendor formats
- Updated suspect lists (e.g., NORMAN, EPA CompTox, UBA PMT list)
- Data processing software (vendor-specific or open-source platforms)
Procedure:
Data Processing and Feature Detection
- Reprocess raw data using current software algorithms to extract molecular features
- Apply retention time alignment and peak picking consistency filters across samples
- Use blank subtraction to eliminate background and instrumental artifacts
Database Matching and Prioritization
- Import updated suspect lists (e.g., 350 PMT substances from German Environmental Agency) [6]
- Apply mass tolerance filters (typically ≤5 ppm) for accurate mass matching
- Utilize seven-tiered prioritization strategy:
- P1: Target and suspect screening against known contaminants
- P2: Data quality filtering to remove artifacts and unreliable signals
- P3: Chemistry-driven prioritization (mass defect, homologue series)
- P4: Process-driven prioritization (spatial/temporal trends)
- P5: Effect-directed prioritization (bioassay correlations)
- P6: Prediction-based prioritization (risk quotients)
- P7: Pixel/tile-based approaches for complex datasets [4] [10]
Confidence Assessment and Reporting
- Apply Schymanski et al. confidence levels for identification
- For Level 1 confirmation, acquire authentic standards for retention time and fragmentation matching
- Use in-silico fragmentation tools (e.g., CSI:FingerID, MetFrag) for structural predictions
- Report findings with appropriate confidence level assignments
The Scientist's Toolkit: Essential Research Reagents and Materials
Successful implementation of digital archiving for retrospective analysis requires specific tools and databases. The following table details essential components of the NTS research toolkit.
Table 2: Essential Research Reagents and Materials for HRMS Digital Archiving
| Tool Category | Specific Examples | Function | Application Notes |
|---|---|---|---|
| HRMS Instrumentation | Q-TOF, Orbitrap, FT-ICR MS | Provides accurate mass measurements (<5 ppm) and high resolution (>25,000) for molecular formula assignment | Benchtop instruments increasingly accessible; enables sensitive non-target detection [1] [7] |
| Suspect List Databases | NORMAN Suspect List Exchange, EPA CompTox, UBA PMT List | Curated lists of potential environmental contaminants for suspect screening | Regular updates essential for retrospective analysis; NORMAN contains >100,000 compounds [4] [7] |
| MS/MS Spectral Libraries | NIST, mzCloud, MassBank | Reference fragmentation spectra for compound identification | GC-EI libraries well-established; LC-MS/MS libraries growing but limited by reproducibility issues [7] |
| Data Processing Software | Compound Discoverer, XCMS, MS-DIAL, MZmine | Processes raw HRMS data, performs feature detection, alignment, and statistical analysis | Open-source options increase accessibility and method transparency [9] |
| Quantification Approaches | MS2Quant, Prediction models | Estimates concentration without reference standards using fragmentation patterns or prediction models | Enables risk assessment even when standards unavailable [4] |
Digital archiving of HRMS data represents a paradigm shift in environmental monitoring, transforming single-point analyses into enduring resources for chemical safety assessment. By implementing the protocols outlined in this application note, research institutions and regulatory bodies can build chemical exposure knowledge bases that increase in value over time. As instrumental capabilities advance and chemical databases expand, the retrospective analysis of archived environmental samples will play an increasingly crucial role in identifying future chemical threats before they escalate into widespread contamination issues.
High-Resolution Mass Spectrometry (HRMS) has become an indispensable tool for the non-targeted screening (NTS) of environmental pollutants, with Orbitrap technology emerging as a leading analytical platform. Orbitrap mass spectrometers function as ion trap mass analyzers that utilize "electrodynamic squeezing" to capture ions, which then oscillate around a central electrode at frequencies proportional to their mass-to-charge ratio (m/z). This operating principle enables the acquisition of high-resolution, accurate-mass (HRAM) data through image current detection, functioning as a Fourier Transform mass analyzer analogous to FT-ion cyclotron resonance (ICR) technology, yet in a more compact and operable format [11].
The distinguishing capability of Orbitrap technology lies in its exceptional resolution and mass accuracy. These instruments can achieve a maximum resolution of up to 1,000,000 FWHM at m/z 200 while maintaining sub-1 ppm mass accuracy, enabling the confident identification of unknown compounds and trace-level contaminants in complex environmental matrices without compromising selectivity or sensitivity [11]. This performance level surpasses alternative technologies like Q-TOF systems, which face limitations in resolution within the small molecule mass range, potentially leading to false identifications [11].
For environmental scientists investigating chemical pollutants, Orbitrap-based platforms provide the analytical robustness necessary to detect, identify, and quantify a diverse array of organic contaminants—from legacy persistent organic pollutants (POPs) to emerging contaminants of concern—even when present at trace concentrations in challenging sample matrices [9] [1].
Key Technical Specifications and Performance Metrics
Orbitrap mass spectrometers offer a range of technical specifications that make them particularly suitable for non-targeted screening of environmental samples. The high resolution and accurate mass capabilities enable the differentiation of isobaric compounds (those with similar nominal mass but different exact mass) and provide confident molecular formula assignments for unknown identification [11].
Table 1: Performance Metrics of Orbitrap Systems for Environmental Analysis
| Performance Parameter | Specification Range | Significance for Environmental NTS |
|---|---|---|
| Mass Resolution | Up to 1,000,000 FWHM at m/z 200 | Separates isobaric compounds with minimal mass differences; reduces chemical noise |
| Mass Accuracy | <1 ppm (typical) | Enishes confident molecular formula assignment; reduces false positives |
| Dynamic Range | Wide dynamic range | Enables detection of trace-level contaminants alongside abundant matrix components |
| Detection Capability | Sub-ppb to ppt levels | Suitable for monitoring environmental contaminants at regulatory relevant concentrations |
| Scan Modes | Full scan, targeted MS/MS, DDA, DIA | Flexible data acquisition for comprehensive contaminant screening |
The hybrid configurations of Orbitrap instruments, particularly those combining quadrupole mass filters with Orbitrap mass analyzers (Q-Orbitrap systems), provide additional functionality for structural elucidation. These configurations enable MS/MS experiments with high-resolution fragment detection, which is crucial for confirming the identity of unknown pollutants through their fragmentation patterns [12] [8]. The Thermo Scientific Orbitrap Exploris series and Q Exactive series represent such hybrid systems that have been successfully applied to environmental analysis [11].
Recent advancements include the development of specialized instruments like the Orbitrap Exploris EFOX Mass Detector, specifically designed for environmental and food safety testing. This system applies Orbitrap technology to the quantification of trace-level contaminants such as per- and polyfluoroalkyl substances (PFAS), pesticides, and other organic xenobiotics, making high-resolution testing more accessible for routine laboratory analysis [13].
Applications in Non-Target Screening of Environmental Pollutants
Orbitrap-based HRMS has demonstrated exceptional capability in characterizing complex environmental mixtures through non-targeted screening approaches. In one comprehensive study, researchers employed GC-Q-Orbitrap-HRMS with chromatogram segmentation and Cl/Br-specific screening algorithms to identify halogenated organic pollutants (HOPs) in fly ash, egg, and sediment samples [12]. This methodology enabled the identification of 122 HOP formulas tentatively assigned with structures, with 28 compounds detected across multiple matrices. When considering isomers, the study revealed a total of 1059 HOP congeners, demonstrating the powerful congener-specific analysis capability of Orbitrap technology [12].
The quantitative analysis revealed significant concentration variations across environmental compartments, with total HOP levels measuring 4.7 μg g⁻¹ in fly ash, 41.2 μg g⁻¹ in egg, and 750.8 μg g⁻¹ in sediment [12]. The study highlighted the predominance of organochlorines across halogenated categories, with halogenated benzenes, halogenated dioxins, halogenated biphenyls/terphenyls, and halogenated polycyclic aromatic hydrocarbons (H-PAHs) representing the predominant structural categories. Furthermore, the research identified dozens of novel or little-known HOP formulas, including mix-chlorinated/brominated PAHs with ≥4 aromatic rings and polychlorinated terphenyls [12].
Orbitrap technology has also proven valuable for regulatory environmental monitoring. The International Commission for the Protection of the River Rhine (ICPR) has implemented NTS using HRMS since 2012, documenting ten major spill events of previously undetected compounds totaling approximately 25 tons of chemical load in the river Rhine in 2014 alone [1]. This monitoring led to the discovery of quaternary phosphonium compounds—industrial process intermediates not registered in REACH—that were subsequently shown to possess cytotoxic and genotoxic potential [1].
Table 2: Representative Environmental Contaminants Identified Using Orbitrap HRMS
| Contaminant Class | Specific Compounds Identified | Environmental Matrices | Analytical Approach |
|---|---|---|---|
| Halogenated Organic Pollutants (HOPs) | Halogenated benzenes, dioxins, biphenyls, terphenyls, PAHs | Fly ash, eggs, sediment | GC-Q-Orbitrap-HRMS with chromatogram segmentation [12] |
| Emerging Industrial Chemicals | Quaternary phosphonium compounds | River water | LC-HRMS and GC-HRMS NTS [1] |
| Per- and Polyfluoroalkyl Substances (PFAS) | Various PFAS congeners | Water, biological samples | LC-Orbitrap-HRMS [9] [13] |
| Pharmaceuticals and Personal Care Products | Diverse pharmaceutical compounds | Water, wastewater | LC-HRMS NTS [9] [8] |
| Pesticides and Transformation Products | Current-use and legacy pesticides | Soil, sediment, water | GC- and LC-Orbitrap-HRMS [9] [8] |
The application of Orbitrap technology spans multiple environmental compartments. A comprehensive review of NTA and suspect screening analysis (SSA) reported the detection of per- and polyfluoroalkyl substances (PFAS) and pharmaceuticals in water, pesticides and polyaromatic hydrocarbons (PAHs) in soil and sediment, volatile and semi-volatile organic compounds in air, flame retardants in dust, and plasticizers in consumer products [9]. This broad coverage of chemical classes underscores the versatility of Orbitrap systems for comprehensive environmental exposomics.
Experimental Protocols for Environmental Sample Analysis
Sample Preparation and Extraction
Proper sample preparation is fundamental for successful non-targeted screening of environmental pollutants. While specific protocols vary depending on the sample matrix, the general principles include:
Sample Collection and Preservation: Environmental samples (water, soil, sediment, biota) should be collected using clean procedures to avoid contamination, preserved appropriately (often at 4°C or frozen), and processed within designated holding times to maintain sample integrity.
Extraction Techniques: Solid-phase extraction (SPE) is commonly employed for water samples, while pressurized liquid extraction (PLE), QuEChERS, or sonication-assisted extraction are used for solid matrices. The selection of extraction solvent, pH adjustment, and cleanup media significantly influences the detectable chemical space [9].
Extract Concentration and Reconstitution: Following extraction, samples are typically concentrated under gentle nitrogen evaporation and reconstituted in solvents compatible with the chromatographic system (often methanol or acetonitrile with water).
Instrumental Analysis Parameters
Chromatographic separation coupled to Orbitrap HRMS detection forms the core of NTS workflows. Both liquid chromatography (LC) and gas chromatography (GC) approaches are employed, with 51% of environmental NTS studies using only LC-HRMS, 32% using only GC-HRMS, and 16% utilizing both platforms to expand chemical coverage [9].
LC-Orbitrap-HRMS Method:
- Chromatography: Reversed-phase LC using C18 columns with water and organic modifiers (methanol or acetonitrile), often with formic acid or ammonium buffers to enhance ionization [14].
- Ionization: Electrospray ionization (ESI) in positive, negative, or switching modes. Among LC-HRMS studies, 43% use both ESI+ and ESI-, while 18% use only ESI+, and 22% use only ESI- [9].
- Mass Analysis: Full-scan MS data acquisition at resolution ≥60,000 (at m/z 200) with mass accuracy calibration using standard compounds.
- Data Acquisition: Both data-dependent acquisition (DDA) and data-independent acquisition (DIA) methods are employed. DDA selects precursor ions based on intensity or specific features for MS/MS fragmentation, while DIA sequentially fragments all ions within predefined mass windows without precursor selection [8].
GC-Q-Orbitrap-HRMS Method:
- Chromatography: Non-polar or mid-polar capillary GC columns with temperature programming optimized for the volatility range of target analytes.
- Ionization: Electron ionization (EI) is standard; some methods complement EI with chemical ionization (CI) for molecular ion information [9].
- Mass Analysis: Full-scan MS data acquisition at resolution ≥60,000 with accurate mass measurement.
- Specialized Screening: Algorithm-based approaches such as Cl/Br-specific screening have been developed for selective detection of halogenated compounds through isotope pattern recognition [12].
Data Processing and Compound Identification
The processing of HRMS data for NTS involves multiple steps that can be optimized using design of experiments (DoE) approaches [14]:
Peak Detection and Alignment: Automated software (e.g., MZmine, Compound Discoverer) detects chromatographic peaks, deconvolutes co-eluting compounds, and aligns features across samples.
Molecular Formula Assignment: HRAM data enables the generation of potential molecular formulas within specified mass error tolerance (typically <5 ppm).
Compound Identification: Strategies include:
- Suspect Screening: Comparison against chemical databases (e.g., NORMAN, CompTox) with confidence levels [9].
- True NTS: Structural elucidation through interpretation of MS/MS fragmentation patterns and retention time prediction.
- Library Matching: Spectral matching against reference libraries (e.g, NIST, mzCloud).
Workflow for Environmental NTS Using Orbitrap HRMS
The Scientist's Toolkit: Essential Research Reagents and Materials
Successful implementation of Orbitrap-based NTS requires carefully selected reagents, materials, and software tools. The following table outlines essential components of the environmental analyst's toolkit:
Table 3: Essential Research Reagents and Materials for Orbitrap-Based NTS
| Category | Specific Items | Function/Purpose |
|---|---|---|
| Chromatography | U/HPLC system (e.g., Thermo Scientific Vanquish); GC system; C18, HILIC, or other LC columns; GC capillary columns; Mobile phases (water, methanol, acetonitrile); Buffer additives (formic acid, ammonium salts) | Compound separation prior to mass analysis; Reduction of matrix effects; Optimization of ionization efficiency |
| Sample Preparation | Solid-phase extraction (SPE) cartridges; QuEChERS kits; Solvents (acetone, hexane, ethyl acetate, dichloromethane); Filtration devices; Internal standards (isotope-labeled compounds) | Sample cleanup and concentration; Matrix component removal; Compensation for extraction and ionization variability |
| Mass Calibration | Calibration solutions (e.g., Pierce LTQ Velos ESI Positive and Negative Ion Calibration Solutions); Mass accuracy standards | Instrument mass calibration and performance verification; Ensuring sub-ppm mass accuracy |
| Data Processing Software | Commercial (Compound Discoverer, MassHunter); Open-source (MZmine 2, MS-DIAL); Databases (NORMAN, CompTox, mzCloud, NIST) | Molecular feature extraction; Compound identification; Data visualization and interpretation |
| Quality Control | Procedure blanks; Matrix spikes; Reference materials; Solvent blanks | Contamination assessment; Process efficiency monitoring; Data quality assurance |
The selection of specific reagents and materials should be guided by the target analytes and sample matrices. For example, the optimization of MZmine 2 parameters using design of experiments approaches has been shown to significantly improve peak detection performance in environmental samples, enabling detection of 75-100% of peaks compared to manual evaluation [14]. Additionally, the use of both positive and negative ionization modes and complementary LC and GC separation expands the detectable chemical space for comprehensive environmental analysis [9].
Method Optimization and Data Acquisition Strategies
Optimal performance in non-targeted screening requires careful optimization of both instrumental parameters and data processing methods. Research has demonstrated that shorter MS cycle times in Orbitrap instruments significantly improve the quality of automatic peak detection, suggesting that full scan acquisition without additional MS2 experiments may be preferable for initial screening [14].
For data acquisition, two primary approaches dominate environmental NTS:
Data-Dependent Acquisition (DDA): This method performs a full MS scan followed by MS/MS scans on the most abundant precursor ions meeting specific intensity thresholds. While DDA accounts for approximately 60% of NTS applications, it may miss lower-abundance compounds due to preferential selection of intense ions [8].
Data-Independent Acquisition (DIA): This approach fragments all ions within sequential mass windows without precursor selection, ensuring comprehensive MS/MS data collection. Although more challenging for data processing due to complex fragmentation spectra, DIA represents approximately 19% of NTS applications and provides more complete compound coverage [8].
The design of experiments (DoE) methodology has proven valuable for optimizing data processing parameters in software such as MZmine 2, providing a systematic approach to maximize peak detection while minimizing false positives [14]. This approach is particularly important given that different environmental questions and regulatory needs require tailored NTS strategies [1].
Data Acquisition Strategies for NTS
The future development of Orbitrap technology and associated methodologies continues to address current challenges in environmental NTS, including improved compound identification confidence, standardized reporting standards, and more efficient data processing workflows to handle the increasingly large and complex datasets generated by comprehensive environmental monitoring programs [1] [8].
High-Resolution Mass Spectrometry (HRMS) has revolutionized the analysis of environmental samples by enabling comprehensive detection and identification of organic contaminants [15]. The screening approaches for these analyses can be categorized into three distinct paradigms: target, suspect, and non-target screening. Each method offers a different balance between specificity, scope, and analytical effort, making them suitable for various applications in environmental monitoring and regulatory science [1]. The integration of liquid chromatography with HRMS (LC-HRMS) provides the separation power and mass accuracy necessary to resolve and identify compounds in complex environmental matrices such as water, sediments, and biological tissues [16] [17].
In modern environmental analysis, the immense diversity of chemical substances from industrial, agricultural, and domestic sources presents a significant analytical challenge. Conventional targeted methods, while quantitative and precise, cover only a limited number of pre-defined analytes [1]. The complementary use of suspect and non-target screening allows researchers to cast a wider net, detecting known contaminants without reference standards (suspect screening) and discovering entirely unknown chemicals (non-target screening) [17]. This hierarchical approach to chemical analysis is particularly valuable for identifying Chemicals of Emerging Concern (CECs) and addressing the "known unknowns" and "unknown unknowns" in environmental compartments [4] [10].
Defining the Screening Workflows
Target Screening
Target screening is a hypothesis-driven approach focused on the definitive identification and quantification of a predefined set of analytes. This method relies on reference standards to confirm compound identity through exact mass, retention time, and fragmentation spectrum matching [17]. Target screening provides the highest level of confidence in compound identification and is the foundation for regulatory compliance monitoring. For example, under the EU Water Framework Directive, monitoring focuses on 45 Priority Substances using targeted methods [1]. The key characteristics of target screening include its quantitative nature, dependence on authentic standards, and limited scope to known compounds of immediate interest.
Suspect Screening
Suspect screening represents an intermediate approach where analysts search for compounds suspected to be present in samples based on existing knowledge, but without available reference standards for confirmation [17]. This method leverages suspect lists and databases containing thousands of potential environmental contaminants, such as the NORMAN Suspect List Exchange or the US EPA's CompTox Chemicals Dashboard [4] [10]. Identification is based on matching exact mass, isotope patterns, and sometimes in silico-predicted fragmentation patterns, resulting in tentative identification unless confirmed with standards. Suspect screening significantly expands the monitoring scope beyond target methods while providing more structured identification than purely non-target approaches.
Non-Target Screening (NTS)
Non-target screening (NTS) is a hypothesis-generating approach that aims to comprehensively detect all measurable organic compounds in a sample without prior knowledge or expectations [18] [1]. As a true discovery tool, NTS seeks to identify previously unrecognized contaminants, transformation products, or entirely new chemical entities. The non-target workflow involves detecting chromatographic features, prioritizing them based on various criteria, and ultimately elucidating their structures [4] [10]. NTS is particularly valuable for identifying CECs that may escape conventional monitoring programs, as demonstrated by the detection of quaternary phosphonium compounds in the Rhine River that had been emitted for years without regulation [1].
Table 1: Comparative Analysis of Screening Workflows
| Parameter | Target Screening | Suspect Screening | Non-Target Screening |
|---|---|---|---|
| Scope | Limited to predefined analytes | Database-dependent (hundreds to thousands) | Virtually unlimited |
| Identification Confidence | Confirmed (with standards) | Tentative (without standards) | Tentative to confirmed |
| Quantification | Absolute (with standards) | Semi-quantitative | Semi-quantitative at best |
| Data Acquisition | Targeted MS/MS | Data-dependent (DDA) or data-independent (DIA) | DDA or DIA |
| Primary Application | Regulatory compliance | Research, prioritization | Discovery, research |
| Data Processing | Targeted extraction | Suspect list matching | Feature detection, prioritization |
Experimental Protocols for HRMS-Based Screening
Sample Preparation and LC-HRMS Analysis
A generalized protocol for water sample analysis across all screening approaches involves careful sample collection, preservation, and preparation. Water samples should be collected in pre-cleaned glass containers, stored at 4°C, and processed within 48 hours. Filtration through 0.2-μm polycarbonate or glass fiber filters removes particulate matter [18]. Solid-phase extraction (SPE) using polymeric sorbents (e.g., Oasis HLB) provides broad-spectrum extraction of contaminants with varying physicochemical properties. For non-target screening, minimal sample cleanup preserves the comprehensive chemical profile, though this may increase matrix effects.
For LC-HRMS analysis, reversed-phase chromatography with C18 columns (e.g., 100 × 2.1 mm, 1.8-μm particle size) provides effective separation with gradient elution using water and methanol or acetonitrile, both modified with 0.1% formic acid or ammonium acetate for positive and negative electrospray ionization, respectively [18] [17]. The acquisition should include full-scan MS1 data at high resolution (≥50,000 FWHM) and data-dependent MS/MS fragmentation at stepped collision energies to maximize structural information. Both positive and negative ionization modes are essential for comprehensive coverage [16].
Data Processing Workflows
Target Screening Data Processing: For target screening, data processing involves extracting specific ion chromatograms for each target compound using a narrow mass window (typically 5 ppm). Identification requires matching both exact mass and retention time to the reference standard, with MS/MS fragmentation confirmation [17].
Suspect Screening Data Processing: Suspect screening workflows involve extracting potential suspects based on exact mass from comprehensive databases, followed by evaluation of isotope patterns and comparison with in silico or library MS/MS spectra when available [17]. Software platforms such as UNIFI provide integrated workflows for suspect screening with automated matching against curated libraries [17].
Non-Target Screening Data Processing: Non-target data processing begins with feature detection using algorithms such as those in MZmine3 or XCMS to detect chromatographic peaks representing unique molecular ions [18]. This is followed by retention time alignment, isotope and adduct annotation, and gap filling. The resulting feature table undergoes prioritization using strategies such as statistical analysis, blank subtraction, and intensity thresholds [4] [18]. Two distinct approaches for NTS data processing include:
- Feature Profiling (FP) with software such as MZmine3: This approach detects and aligns chromatographic peaks across samples to create a feature table with mass-to-charge ratio (m/z), retention time, and intensity [18].
- Component Profiling (CP) with methods such as Regions of Interest Multivariate Curve Resolution-Alternating Least Squares (ROIMCR): This approach performs bilinear decomposition of compressed data matrices to resolve "pure" component profiles without prior peak picking [18].
Table 2: Key Research Reagent Solutions for HRMS Screening
| Reagent/Category | Function/Application | Examples/Specifications |
|---|---|---|
| HRMS Instrumentation | Exact mass measurement, high-resolution separation | Orbitrap, Q-TOF, FT-ICR mass analyzers |
| Chromatography Systems | Compound separation prior to MS detection | UHPLC with C18 columns (100×2.1mm, 1.8μm) |
| Reference Standards | Target compound confirmation and quantification | Authentic chemical standards for calibration |
| Suspect Databases | Digital libraries for suspect screening | NORMAN, CompTox Dashboard, PubChemLite |
| SPE Sorbents | Sample extraction and concentration | Oasis HLB, polymeric mixed-mode sorbents |
| Internal Standards | Quality control, signal correction | Isotopically-labeled analog standards |
| Data Processing Software | Feature detection, statistical analysis | MZmine3, XCMS, ROIMCR, PatRoon |
Workflow Integration and Prioritization Strategies
Complementary Workflow Implementation
The most effective environmental monitoring strategies integrate all three screening approaches to leverage their complementary strengths [17] [1]. An integrated workflow begins with non-target screening to obtain a comprehensive chemical profile of samples. Detected features are then filtered through suspect screening against extensive databases, providing tentative identifications for known environmental contaminants. Finally, a subset of high-priority compounds is confirmed and quantified through target screening with authentic standards. This hierarchical approach maximizes both the scope of chemical coverage and the confidence in identification for critical contaminants.
Recent studies demonstrate this integrated approach, such as the assessment of a Mediterranean River basin where target screening of 171 pesticides and 33 pharmaceuticals was combined with suspect screening against a library of 2200 components and non-target discovery [17]. This comprehensive strategy identified 68 contaminants through suspect screening, with 6 confirmed by standards, plus the non-target identification of eprosartan, an antihypertensive drug not included in the original suspect list [17].
Prioritization Strategies in Non-Target Screening
The primary challenge in NTS is the thousands of detected features, making prioritization essential for efficient resource allocation [4] [10]. Seven key prioritization strategies have been identified:
- Target and Suspect Screening (P1): Using predefined databases of known or suspected contaminants to narrow candidates early in the process [4] [10].
- Data Quality Filtering (P2): Removing artifacts and unreliable signals based on occurrence in blanks, replicate consistency, and peak shape [4] [10].
- Chemistry-Driven Prioritization (P3): Focusing on compound-specific properties to identify classes of interest, such as using mass defect filtering for halogenated compounds [4] [10].
- Process-Driven Prioritization (P4): Using spatial, temporal, or technical processes (e.g., upstream vs. downstream comparisons) to highlight relevant features [4] [10].
- Effect-Directed Prioritization (P5): Integrating biological response data with chemical analysis through Effect-Directed Analysis (EDA) or virtual EDA [4] [10].
- Prediction-Based Prioritization (P6): Calculating risk quotients using predicted concentrations and toxicities when full identification is incomplete [4] [10].
- Pixel- or Tile-Based Approaches (P7): For complex datasets, especially in 2D chromatography, localizing regions of high variance before peak detection [4] [10].
These strategies are most effective when combined, enabling stepwise reduction from thousands of features to a focused shortlist of high-priority compounds [4]. For example, an initial suspect screening might flag 300 features, which data quality and chemistry-driven filters reduce to 100. Process-driven comparison could then identify 20 features linked to poor removal in a treatment plant, with effect-directed and prediction-based methods finally prioritizing 5 features based on demonstrated toxicity and predicted risk [4].
Comparative Performance and Applications
Workflow Performance Assessment
Studies comparing NTS data processing workflows reveal significant differences in their performance characteristics. A 2025 comparative analysis of MZmine3 (feature profiling) and ROIMCR (component profiling) demonstrated that both approaches could differentiate treatment and temporal effects in wastewater-impacted river water, but with distinct characteristics [18]. MZmine3 showed increased sensitivity to treatment effects but greater susceptibility to false positives, while ROIMCR provided superior consistency and reproducibility with clearer temporal patterns, though with lower treatment sensitivity [18].
The choice between data acquisition modes also impacts performance. Both Data-Dependent Acquisition (DDA) and Data-Independent Acquisition (DIA) have complementary advantages for obtaining MS2 information for database matching [19]. DDA provides cleaner MS/MS spectra for library matching, while DIA ensures fragmentation data for all detected ions, reducing the risk of missing important compounds [19].
Table 3: Performance Metrics of NTS Data Processing Workflows
| Performance Metric | MZmine3 (FP-based) | ROIMCR (CP-based) |
|---|---|---|
| Temporal Variation Capture | 20.5–31.8% variance | 35.5–70.6% variance |
| Treatment Effect Sensitivity | Higher (11.6–22.8% variance) | Lower |
| False Positive Rate | Increased susceptibility | Reduced susceptibility |
| Reproducibility | Moderate | Superior |
| Data Dimensionality | Feature table (peaks) | Component profiles |
| Best Application | Treatment effect studies | Temporal trend analysis |
Regulatory and Research Applications
The three screening workflows have distinct but complementary roles in environmental monitoring and chemicals management. Target screening remains essential for regulatory compliance, such as monitoring Priority Substances under the EU Water Framework Directive [1]. Suspect screening supports chemical prioritization and regulatory processes, such as adding chemicals to the WFD Watch List or re-evaluating substances under REACH [1]. Non-target screening serves as a discovery tool for identifying previously unknown contaminants and transformation products, as demonstrated by the detection of significant emissions of quaternary phosphonium compounds in the Rhine River [1] [10].
The retrospective analysis capability of stored HRMS data represents a particularly powerful application of NTS. As digital archives of full-scan HRMS analyses, these datasets can be re-interrogated as new concerns emerge or new knowledge about specific substances develops [1]. This future-proofs environmental monitoring programs against newly identified threats without requiring re-sampling or re-analysis.
The hierarchical framework of target, suspect, and non-target screening represents a comprehensive strategy for addressing the immense complexity of chemical mixtures in environmental systems. While each approach has distinct strengths and limitations, their integrated implementation provides the most powerful solution for contemporary environmental analytical challenges. Target screening delivers the quantitative rigor required for regulatory compliance, suspect screening expands monitoring scope to hundreds or thousands of potential contaminants, and non-target screening enables discovery of previously unrecognized environmental contaminants.
The implementation of harmonized protocols, quality control procedures, and data sharing infrastructures will be crucial for advancing these screening approaches from research tools to routine monitoring applications [1]. Future developments in HRMS instrumentation, data processing algorithms, and predictive modeling will further enhance the sensitivity, scope, and efficiency of all three screening paradigms. As these methodologies continue to mature, their integration into regulatory frameworks will be essential for comprehensive chemicals management and effective environmental protection.
High-Resolution Mass Spectrometry (HRMS) has emerged as a pivotal analytical technology supporting diverse regulatory frameworks across environmental and pharmaceutical domains. Its unparalleled ability to perform precise quantitative analysis and comprehensive non-target screening makes it uniquely positioned to address complex challenges within the European Water Framework Directive (WFD), the Regulation for the registration, evaluation, authorisation and restriction of chemicals (REACH), and the stringent characterization of biosimilar medicinal products. In environmental monitoring, HRMS enables the detection and identification of previously unknown contaminants, thereby strengthening the evidence base for regulatory action [1]. In pharmaceutical development, advanced HRMS platforms provide the rigorous analytical data required to demonstrate biosimilarity, supporting a paradigm shift toward more efficient regulatory pathways [20]. This application note details how HRMS methodologies underpin these critical regulatory areas, providing detailed protocols and data interpretation frameworks for researchers and regulatory professionals.
Regulatory Drivers for HRMS Application
Environmental Monitoring: The Water Framework Directive (WFD) and REACH
Modern environmental regulation requires a proactive approach to chemical risk management, moving beyond a limited set of predefined target substances.
- The WFD Challenge: The WFD monitors 45 Priority Substances (PS) and an average of 55 River Basin Specific Pollutants (RBSP) to assess the chemical status of water bodies. However, research studies using HRMS routinely detect hundreds to thousands of substances in environmental samples, revealing a significant monitoring gap [1].
- The REACH Connection: Data on environmental occurrence, gathered via HRMS, can feed back into the chemical registration process. REACH Annex III now allows the use of environmental monitoring data in a weight-of-evidence approach for assessing substance persistence and bioaccumulation [1].
- The NTS Solution: Non-target screening (NTS) with HRMS allows for the untargeted detection of thousands of organic chemicals in a single analysis, creating a "digital archive" of the sample that can be re-interrogated as new concerns emerge [1]. This capability is crucial for identifying new substances for the WFD's "Watch List" mechanism and for triggering substance evaluation under REACH.
Pharmaceutical Development: Biosimilar Characterization
The global regulatory landscape for biosimilars is evolving toward a more streamlined, science-driven approach that heavily relies on advanced analytical characterization.
- The Regulatory Shift: Regulatory agencies, including the European Medicines Agency (EMA) and the U.S. Food and Drug Administration (FDA), are moving toward a "tailored clinical approach" [20]. For some biosimilars, extensive comparative clinical efficacy trials (Phase III) may be waived if extensive analytical and functional data demonstrate a high degree of similarity to the reference product.
- The HRMS Imperative: This shift places immense importance on robust Chemistry, Manufacturing, and Controls (CMC) packages and analytical comparability. HRMS is critical for characterizing the biosimilar's structure, including primary amino acid sequence and complex post-translational modifications (e.g., glycosylation), with sufficient precision to prove "no clinically meaningful differences" from the reference product [21] [20].
- Global Harmonization Challenges: Regulatory pathways for biosimilars, while maturing, still lack full international harmonization. Differences in requirements for clinical studies, extrapolation of indications, and interchangeability between regions like the EU, US, and Latin America complicate global market entry [21]. A robust, HRMS-driven analytical similarity package forms the universal foundation for any regulatory submission.
HRMS-Based Methodologies and Protocols
Comprehensive Non-Target Screening for Environmental Monitoring
This protocol outlines a robust workflow for the identification of unknown organic pollutants in water samples, supporting WFD and REACH regulatory goals.
Materials and Reagents:
- Water Samples: Surface water, groundwater, or effluent samples.
- Solid Phase Extraction (SPE) Cartridges: e.g., Oasis HLB or equivalent.
- LC-MS Grade Solvents: Methanol, Acetonitrile, and Water with 0.1% Formic Acid.
- Internal Standard Mixture: A suite of stable isotope-labeled compounds for quality control.
- HRMS System: LC coupled to a Q-TOF or Orbitrap mass spectrometer.
Experimental Workflow:
The following diagram illustrates the comprehensive NTS workflow, from sample preparation to final reporting.
Detailed Procedural Steps:
Sample Preparation: Collect water samples in pre-cleaned glass bottles. Acidify if necessary and filter through 0.45 μm glass fiber filters. Perform solid-phase extraction (SPE) using a hydrophilic-lipophilic balanced sorbent. Elute with a suitable solvent (e.g., methanol), evaporate to dryness under a gentle nitrogen stream, and reconstitute in a initial mobile phase for LC-MS analysis [5] [22].
HRMS Data Acquisition:
- Chromatography: Utilize reversed-phase C18 column with a water/acetonitrile or water/methanol gradient. Maintain column temperature at 40°C.
- Ionization: Employ electrospray ionization (ESI) in both positive and negative modes to maximize compound coverage.
- Mass Spectrometry: Acquire data in full-scan mode with a resolution of >50,000 (FWHM) to ensure accurate mass measurements. Simultaneously, use data-dependent acquisition (DDA) to fragment the most intense ions, generating MS/MS spectra for structural elucidation [23] [22] [15].
Data Processing and Evaluation:
- Use software (e.g., patRoon, XCMS) for feature detection, peak picking, and alignment.
- Perform suspect screening against curated databases (e.g., NORMAN Suspect List Exchange, MassBank) [24].
- For true non-targets, use the software to generate molecular formulas from the accurate mass and isotope patterns.
- Interpret MS/MS spectra and propose structures, potentially using in-silico fragmentation tools [1] [22].
Prioritization and Identification:
- Prioritization: Apply a risk-based scoring system, such as the Toxicological Priority Index (ToxPi), which integrates criteria like detection frequency, relative abundance, persistence, bioaccumulation potential, and predicted toxicity [5].
- Identification Confidence: Follow the Schymanski scale for reporting identification confidence, from Level 1 (confirmed structure) to Level 5 (exact mass of interest) [22].
Analytical Similarity Assessment for Biosimilars
This protocol describes the use of HRMS for the comprehensive structural characterization of a biosimilar candidate against its reference product.
Materials and Reagents:
- Reference Product and Biosimilar Candidate: Multiple lots of each.
- Denaturants and Reductants: Guanidine HCl, Dithiothreitol (DTT).
- Enzymes: Trypsin, IdeS, PNGase F.
- LC-MS Grade Solvents: Water, Acetonitrile with 0.1% Formic Acid.
- HRMS System: LC coupled to high-resolution mass spectrometer (Orbitrap preferred).
Experimental Workflow:
The following diagram outlines the key steps in the analytical similarity assessment.
Detailed Procedural Steps:
Intact Mass Analysis:
- Desalt the intact protein using a rapid buffer exchange cartridge or column.
- Inject onto a reversed-phase or size-exclusion column coupled to the HRMS.
- Use ESI and deconvolute the resulting charge envelope spectrum to determine the average and exact molecular mass. Compare the biosimilar and reference product profiles [15].
Peptide Mapping:
- Denature, reduce, and alkylate the protein. Desalt if necessary.
- Digest with a specific protease (e.g., trypsin) and/or other enzymes (e.g., IdeS for antibodies) to generate peptides.
- Analyze the digested sample using LC-HRMS/MS with a C18 column and a water/acetonitrile gradient.
- Use a data-dependent method to acquire MS and MS/MS spectra for peptide identification.
- Process data using software to identify peptides, confirm the amino acid sequence, and locate post-translational modifications (PTMs) such as oxidation, deamidation, and most critically, glycosylation [20] [15].
Glycan Analysis:
- Release N-linked glycans enzymatically using PNGase F.
- Label the released glycans with a fluorescent tag (e.g., 2-AB).
- Analyze using LC-HRMS or LC-fluorescence, comparing the glycan profile (glycoform distribution) of the biosimilar to the reference product [21].
Data Analysis and Similarity Assessment:
- Integrate data from all experiments to perform a side-by-side comparative analysis.
- Use orthogonal methods (e.g., functional bioassays, capillary electrophoresis) to complement HRMS findings.
- The overall goal is to demonstrate that the biosimilar is highly similar to the reference product despite expected microheterogeneity, with no clinically meaningful differences in structural or quality attributes [21] [20].
Data Presentation and Interpretation
Table 1: Key regulatory and technical parameters for HRMS applications.
| Application Area | Key Regulatory/Technical Parameter | Typical Requirement or Value | Purpose |
|---|---|---|---|
| Environmental NTS | HRMS Mass Resolution | >50,000 FWHM [23] | Sufficient resolution to separate isobaric compounds and determine elemental composition. |
| Mass Accuracy | < 5 ppm [23] [15] | Confident assignment of molecular formula. | |
| Identification Confidence | Schymanski Level 1-5 [22] | Standardized reporting of identification certainty for new/emerging substances. | |
| Biosimilar Characterization | Intact Mass Accuracy | < 50 Da (for large proteins) [15] | Confirmation of correct primary structure and major PTMs. |
| Peptide Mapping Coverage | >95% [20] | Comprehensive verification of amino acid sequence and identification of PTM sites. | |
| Regulatory Goal | "No clinically meaningful differences" [21] [20] | Foundation for streamlined clinical development and regulatory approval. |
The Scientist's Toolkit: Essential Research Reagents and Materials
Table 2: Key reagents, materials, and software solutions for HRMS-based regulatory studies.
| Item Name | Function/Description | Application Context |
|---|---|---|
| Hydrophilic-Lipophilic Balanced (HLB) SPE Cartridges | Broad-spectrum extraction of diverse organic pollutants from water samples. | Environmental NTS for WFD/REACH [22] |
| Stable Isotope-Labeled Internal Standards | Correction for matrix effects and analyte loss during sample preparation; quality control. | Both Environmental NTS and Biosimilar Analysis |
| NORMAN Suspect List Exchange Database | A collaborative repository of suspect lists for emerging environmental contaminants. | Environmental NTS for suspect screening [24] |
| patRoon Software Platform | Open-source software for structured non-target screening data processing. | Environmental NTS workflow management [22] |
| PNGase F Enzyme | Enzyme that releases N-linked glycans from glycoproteins for detailed analysis. | Biosimilar Characterization (Glycan Profiling) |
| Trypsin Protease | High-purity enzyme for specific digestion of proteins into peptides for sequence mapping. | Biosimilar Characterization (Peptide Mapping) |
| ToxPi (Toxicological Priority Index) Framework | A visual and computational framework for integrating multiple data streams to prioritize chemicals based on risk. | Environmental NTS for risk-based prioritization [5] |
High-Resolution Mass Spectrometry stands as a cornerstone technology for addressing some of the most pressing challenges in modern environmental and pharmaceutical regulation. Its application in non-target screening provides the comprehensive data necessary to move beyond a limited list of target pollutants under the WFD and REACH, enabling a more proactive and protective approach to chemical risk management. Simultaneously, its unparalleled analytical power is driving a scientific and regulatory evolution in the biosimilar sector, where demonstrating structural similarity at the molecular level can form the basis for abbreviated clinical development pathways. The protocols and frameworks outlined in this document provide a foundation for researchers to generate robust, regulatory-grade data that supports the protection of human health and the environment, as well as the efficient development of safe and effective biologic medicines.
From Data to Discovery: Essential Workflows and Real-World Applications of HRMS-NTS
Sample Preparation and Chromatographic Separation for Complex Matrices
The comprehensive analysis of environmental pollutants requires advanced analytical techniques capable of identifying both known and unknown contaminants in complex sample matrices. High-resolution mass spectrometry (HRMS) has emerged as a powerful tool for non-target screening (NTS), enabling the detection and identification of thousands of organic micropollutants without prior knowledge of their identity [1]. This application note details standardized protocols for sample preparation and chromatographic separation tailored for the analysis of complex environmental samples, supporting the broader research objectives in environmental pollutant characterization and risk assessment.
The challenge in analyzing complex environmental samples lies in the vast number of potential chemical contaminants with varying physicochemical properties present at trace concentrations alongside interfering matrix components [25] [26]. Effective strategies must address these challenges through optimized sample preparation to isolate compounds of interest and advanced separation techniques to resolve complex mixtures prior to HRMS detection.
Sample Preparation Protocols for Complex Matrices
Proper sample preparation is critical for successful NTS, as it directly impacts analyte recovery, matrix effects, and overall method sensitivity. The following protocols have been optimized for environmental matrices including water, biosolids, and biota samples.
Solid-Phase Extraction (SPE) for Water Samples
Protocol for Comprehensive Pollutant Extraction [26]
Sample Collection and Preservation: Collect water samples in pre-cleaned amber glass containers. Adjust pH to 7.0 ± 0.5 if necessary and store at 4°C until processing (preferably within 24 hours).
SPE Cartridge Preparation: Condition Oasis HLB cartridges (200 mg, 6 cc) sequentially with 5 mL methanol followed by 5 mL ultrapure water at a flow rate of approximately 5 mL/min. Do not allow the sorbent to dry completely.
Sample Loading: Pass 500 mL to 1000 mL of water sample through the cartridge at a controlled flow rate of 5-10 mL/min using a vacuum manifold system. For highly contaminated samples, reduce sample volume to 100-250 mL.
Cartridge Washing: After sample loading, wash with 5-10 mL of ultrapure water to remove interfering salts and polar matrix components. Allow the cartridge to run dry for 5 minutes under vacuum.
Analyte Elution: Elute retained compounds with 2 × 5 mL of methanol into a clean collection tube. Alternatively, for comprehensive coverage, use a methanol:dichloromethane (1:1, v/v) mixture.
Extract Concentration: Evaporate the eluate to near dryness under a gentle nitrogen stream at 30-40°C. Reconstitute the residue in 100-500 μL of initial mobile phase compatible with the subsequent chromatographic separation (typically methanol or acetonitrile with 0.1% formic acid).
Sample Storage: Store prepared extracts at -20°C until analysis (preferably within 48 hours).
Table 1: SPE Method Variations for Different Analyte Classes
| Analyte Class | Recommended Sorbent | Sample Volume | Elution Solvent | Average Recovery (%) |
|---|---|---|---|---|
| Polar Pharmaceuticals | Oasis HLB | 500 mL | Methanol | 85-105 |
| PFAS Compounds | WAX + Graphitized Carbon | 250 mL | Ammonium hydroxide in methanol | 75-95 |
| Pesticides | C18 + PS-DVB | 500 mL | Ethyl acetate | 80-100 |
| Very Polar/Ionic Compounds | Mixed-mode anion/cation exchange | 1000 mL | Methanol with 2% formic acid | 60-85 |
Quick, Easy, Cheap, Effective, Rugged, and Safe (QuEChERS) Method for Solid Samples
Protocol for Biosolids and Biota Samples [26]
Sample Homogenization: Homogenize 5 g of wet biosolid or biota sample with 10 mL acetonitrile in a 50 mL centrifuge tube.
Salting Out: Add QuEChERS extraction packet containing 4 g MgSO₄, 1 g NaCl, 1 g sodium citrate, and 0.5 g disodium hydrogen citrate sesquihydrate. Shake vigorously for 1 minute.
Centrifugation: Centrifuge at 4000 × g for 5 minutes to separate phases.
Cleanup: Transfer 1 mL of the acetonitrile supernatant to a d-SPE tube containing 150 mg MgSO₄, 25 mg PSA, and 25 mg C18 sorbent. Shake for 30 seconds and centrifuge at 4000 × g for 2 minutes.
Concentration: Transfer the cleaned extract to an autosampler vial and concentrate under nitrogen if necessary. For very low concentration analytes, evaporate to 100 μL and reconstitute in 50 μL acetonitrile.
Alternative Sample Preparation Techniques
Electromembrane Extraction (EME) [26] EME shows particular promise for ionic and ionizable analytes. The protocol involves:
- Place sample (donor solution) in a vial with a supported liquid membrane (typically 2-nitrophenyl octyl ether) impregnated in the pores of a hollow fiber.
- Apply an electrical potential (typically 10-300 V) across the membrane to facilitate extraction of charged analytes into an acceptor solution.
- Typical extraction time: 10-30 minutes with significantly reduced solvent consumption compared to traditional techniques.
Pyrolysis/Thermal Desorption GC-HRMS [27] For complex solid matrices like plastics and biosolids:
- Weigh 0.5-1 mg of sample into a pyrolysis cup.
- For thermal desorption: Heat at 300°C for 1-2 minutes to volatilize additives without degrading polymer matrix.
- For pyrolysis: Ramp to 600-800°C to decompose polymeric materials.
- Directly transfer desorbed/pyrolyzed compounds to GC-HRMS system for analysis.
Chromatographic Separation Methods
Effective chromatographic separation is essential for reducing matrix effects and resolving isobaric compounds prior to HRMS detection. The following methods have been optimized for NTS of environmental pollutants.
Reversed-Phase Liquid Chromatography (RPLC)
Standard Protocol for Medium to Non-Polar Compounds [25] [26]
Column: C18 stationary phase (100 × 2.1 mm, 1.7-1.8 μm particle size) Mobile Phase A: Water with 0.1% formic acid Mobile Phase B: Acetonitrile or methanol with 0.1% formic acid Flow Rate: 0.3 mL/min Temperature: 40°C Injection Volume: 5-10 μL
Gradient Program:
| Time (min) | %B | Description |
|---|---|---|
| 0 | 5 | Initial conditions |
| 1 | 5 | Hold for equilibration |
| 15 | 95 | Linear gradient |
| 20 | 95 | Wash at high organic |
| 20.1 | 5 | Return to initial conditions |
| 25 | 5 | Re-equilibration |
Hydrophilic Interaction Liquid Chromatography (HILIC)
Protocol for Very Polar and Ionic Compounds [26]
Column: HILIC stationary phase (150 × 2.1 mm, 1.7-1.8 μm particle size) Mobile Phase A: Acetonitrile with 0.1% formic acid Mobile Phase B: Water with 0.1% formic acid Flow Rate: 0.4 mL/min Temperature: 35°C Injection Volume: 2-5 μL
Gradient Program:
| Time (min) | %A | Description |
|---|---|---|
| 0 | 95 | High organic for retention |
| 2 | 95 | Hold for weak elution |
| 15 | 50 | Linear gradient to aqueous |
| 18 | 50 | Wash |
| 18.1 | 95 | Return to initial conditions |
| 23 | 95 | Re-equilibration |
Two-Dimensional Liquid Chromatography (2D-LC)
Comprehensive Protocol for Complex Mixtures [26]
First Dimension: HILIC separation (150 × 1.0 mm) Second Dimension: RPLC separation (50 × 4.6 mm) Modulation Time: 30-60 seconds Transfer: Use of two-position, ten-port switching valve Analysis Time: 60-120 minutes for comprehensive analysis
This configuration provides orthogonality, with HILIC separating by polarity and RPLC by hydrophobicity.
Table 2: Chromatographic Method Selection Guide Based on Analyte Properties
| Analyte Characteristics | Recommended Separation | Key Parameters | Typical Applications |
|---|---|---|---|
| Non-polar to medium polar (log P > 1) | RPLC | C18 column, water/acetonitrile gradient | Pesticides, pharmaceuticals, industrial chemicals |
| Very polar/ionic (log P ≤ 1) | HILIC | Silica/aminopropyl column, acetonitrile/water gradient | Artificial sweeteners, polar pharmaceuticals, metabolites |
| Mixed polarity compounds | 2D-LC (HILIC × RPLC) | Complementary mechanisms | Comprehensive NTS of complex environmental extracts |
| Volatile and semi-volatile | GC | DB-5MS column, temperature programming | Plastic additives, flame retardants, personal care products |
Workflow Visualization
Figure 1: Comprehensive Workflow for NTS of Environmental Pollutants
The Scientist's Toolkit: Essential Research Reagents and Materials
Table 3: Key Research Reagent Solutions for Sample Preparation and Analysis
| Item | Function/Application | Examples/Specifications |
|---|---|---|
| Oasis HLB Cartridges | Broad-spectrum SPE for polar and non-polar compounds | 60 μm porosity, 200 mg/6 cc; Suitable for pharmaceuticals, pesticides, and industrial chemicals |
| QuEChERS Extraction Kits | Efficient extraction for solid matrices | Contains MgSO₄, NaCl, sodium citrate for salting-out; d-SPE cleanup with PSA/C18 for matrix removal |
| Mixed-mode SPE Cartridges | Targeted extraction of ionic compounds | Combined reversed-phase and ion-exchange mechanisms; ideal for PFAS, acidic/basic pharmaceuticals |
| U/HPLC Columns (C18) | RPLC separation of medium to non-polar compounds | 100-150 mm × 2.1 mm, 1.7-1.8 μm particles; temperature stable to 60°C |
| HILIC Columns | Separation of very polar and ionic compounds | 150 mm × 2.1 mm, 1.7-1.8 μm silica/aminopropyl particles; compatible with high organic mobile phases |
| GC Columns (DB-5MS) | Separation of volatile and semi-volatile compounds | 30 m × 0.25 mm × 0.25 μm; low-bleed stationary phase suitable for HRMS detection |
| MALDI Matrices | Surface-assisted laser desorption/ionization | For direct analysis of biosolids and solid samples; enables mass spectrometry imaging |
| Tuning/Calibration Solutions | Mass accuracy calibration for HRMS | Contains reference compounds across mass range; ensures < 1 ppm mass accuracy |
| Internal Standards | Quantification and process monitoring | Isotopically labeled analogs of target compounds; corrects for matrix effects and recovery losses |
Advanced Applications and Methodologies
Non-Target Screening Data Processing and Prioritization
Following chromatographic separation and HRMS analysis, effective data processing strategies are essential for managing the complexity of NTS data. The following prioritization strategies have been validated for environmental samples [10] [28]:
Target and Suspect Screening: Initial identification using reference standards and suspect lists of expected compounds.
Data Quality Filtering: Application of quality control measures to reduce noise and eliminate false positives through blank subtraction and replicate analysis.
Chemistry-Driven Prioritization: Focus on specific compound classes (e.g., halogenated substances, transformation products) based on HRMS data properties.
Process-Driven Prioritization: Utilization of spatial, temporal, or process-based comparisons (e.g., pre- and post-treatment samples) to identify relevant features.
Effect-Directed Analysis (EDA): Integration of bioassay testing to link chemical features to biological effects.
Prediction-Based Prioritization: Application of quantitative structure-property relationships (QSPR) and machine learning to estimate risk or concentration levels [29].
Pixel-Based Analysis: Utilization of chromatographic image data (2D data) to pinpoint regions of interest without prior compound identification.
Mass Spectrometry Imaging for Direct Sample Analysis
For complex solid samples like biosolids, mass spectrometry imaging (MSI) offers an alternative approach with minimal sample preparation [30]:
Protocol for MALDI-MSI of Biosolids:
- Sample Preparation: Homogenize 1 g of biosolid and apply to conductive copper tape mounted on MALDI slide.
- Matrix Application: Apply MALDI matrix (e.g., α-cyano-4-hydroxycinnamic acid) using automated sprayer.
- Data Acquisition: Irradiate sample with laser at 50 μm intervals, acquiring full mass spectra at each position.
- Data Analysis: Generate spatial distribution maps for heavy metals (via chloride adducts) and organic pollutants.
This approach enables simultaneous analysis of heavy metals and persistent organic pollutants from minimal sample material with reduced preparation time compared to conventional methods.
Concluding Remarks
The protocols detailed in this application note provide a comprehensive framework for sample preparation and chromatographic separation of complex environmental matrices in support of HRMS-based non-target screening. The integration of automated sample preparation systems [31] with advanced separation techniques and sophisticated data processing strategies [10] [28] [29] enables researchers to address the analytical challenges presented by complex environmental samples. These methodologies support the identification of previously unknown contaminants and contribute to improved environmental risk assessment and regulatory decision-making.
Standardization of these protocols across laboratories and continued development of open-access databases for spectral sharing will further enhance the utility of non-target screening approaches in environmental monitoring programs [1] [32].
Within environmental analytical chemistry, high-resolution mass spectrometry (HRMS) has revolutionized the ability to detect and identify unknown pollutants through non-target screening (NTS) approaches. A foundational element of this capability is high-resolution full-scan data acquisition, which generates a permanent digital record of the sample's chemical composition—a digital sample fingerprint [1]. This digital fingerprint archives comprehensive information that can be retrospectively re-interrogated as new environmental concerns or analytical capabilities emerge, thus breaking the traditional cycle where the absence of monitoring data for a substance leads to the absence of regulatory action [1]. This application note details the protocols and data handling strategies for creating and utilizing these digital fingerprints within the context of environmental pollutant research, supporting broader efforts in regulatory environmental monitoring and chemicals management [1].
Experimental Protocols and Workflows
Sample Preparation and Extraction for Urban Waters
Robust sample preparation is critical for generating a representative digital fingerprint. For the analysis of organic micropollutants in urban water samples, solid-phase extraction (SPE) is the predominant technique. A comparative study evaluated multiple SPE phases to optimize the breadth of information captured for subsequent NTS.
- Objective: To maximize the number and diversity of detectable micropollutants, covering a wide range of physicochemical properties (e.g., molecular weight, polarity) [33].
- Evaluation Method: The performance of various SPE cartridges was statistically assessed based on the number of detected features, the range of molecular weights, and the coverage of different polarities and optical properties [33].
- Recommended Protocol: A multilayer SPE cartridge, which combines several different phase chemistries in a single cartridge, was found to be superior. This approach gathers more comprehensive information in a single extraction by leveraging the specific affinities of each sorbent layer for different classes of compounds [33].
Instrumental Analysis: Combined DDA and DIA Workflow
A powerful workflow for digital fingerprinting combines the strengths of data-dependent acquisition (DDA) and data-independent acquisition (DIA). The following protocol, adapted from a study on urban runoff, outlines this process [34].
Chromatographic Separation:
- Column: 100 mm × 2.1 mm, 1.7-µm BEH C18 column.
- Mobile Phase: (A) 0.1% formic acid in water; (B) 0.1% formic acid in acetonitrile.
- Gradient: Hold at 1% B for 0.5 min, ramp to 20% B at 2 min, 35% B at 8 min, 75% B at 18 min, 99% B at 21 min, hold until 23.5 min, and re-equilibrate to 1% B by 25 min.
- Flow Rate: 0.3 mL/min.
- Injection Volume: Typically 1-10 µL, depending on sample concentration [34].
Mass Spectrometric Detection:
- Instrumentation: Orbitrap Exploris 240 MS or similar high-resolution mass spectrometer.
- Ionization: Electrospray ionization (ESI) in both positive and negative modes.
- Source Conditions: Sheath gas 40 (arbitrary units), auxiliary gas 5, ion transfer tube temperature 325 °C, vaporizer temperature 400 °C [34].
Combined DDA and DIA Acquisition: Table 1: Key Parameters for Combined DDA-DIA Workflow
| Parameter | Iterative DDA (on pooled samples) | DIA (on individual samples) |
|---|---|---|
| Primary Use | Structural annotation | Quantification & feature detection |
| Full Scan RP | 60,000 | 120,000 |
| MS/MS Scan RP | 30,000 | 30,000 |
| Collision Energy | Stepped (20, 40, 60 V) | Stepped (20, 40, 60 V) |
| Data Output | Clean MS/MS spectra for ID | Full-scan fragmentation data |
- Iterative DDA on Pooled Samples: Multiple DDA injections are performed on a pooled sample using an instrument data acquisition system (e.g., AcquireX Deep Scan). This involves first analyzing a composite field blank to create an exclusion list, then running the sample with iterative cycles of full-scan MS and MS/MS to maximize the number of precursors selected for fragmentation [34].
- DIA on Individual Samples: Triplicate injections of individual samples are analyzed, alternating between a high-resolution full scan and all-ion fragmentation (AIF) scans with stepped collision energies. This ensures that fragmentation data is collected for all ions in the sample, not just the most intense ones [34].
Data Processing and Compound Identification
The processing of raw HRMS data into a usable digital fingerprint involves several steps to reduce data complexity and enable compound identification.
- Peak Picking and Feature Detection: Raw data from DIA acquisitions are processed using software tools (e.g., MSDial) for peak detection. Parameters such as a 0.2 min retention time tolerance and a 0.005 Da MS1 tolerance are typically applied [34]. The result is a list of features, defined by their m/z and retention time, with associated intensities [35].
- Data Filtering: Features are rigorously filtered to reduce noise. Common filters include retaining features only if their average signal exceeds 50 times the average field blank signal and the relative standard deviation (RSD) in technical replicates is <50% [34].
- Structural Annotation with In-silico Tools: The clean DDA MS/MS spectra from the pooled sample are processed using in-silico tools like Sirius. This software calculates structural fingerprints based on isotopic patterns and fragmentation trees to predict molecular structures, which are then matched against databases such as PubChem [34].
- Feature Matching: The annotated component list from the DDA data is matched to the filtered features from the DIA data, using strict mass accuracy (e.g., <5 ppm) and retention time (e.g., <0.2 min) tolerances [34]. This step links tentative identities from the DDA data with quantitative information from the DIA data.
The overall workflow for creating and using a digital sample fingerprint is summarized in the diagram below.
Data Handling and Presentation
From Raw Data to a Structured Digital Fingerprint
The fundamental data generated by the mass spectrometer is a mass spectrum—a series of mass-to-intensity pairs [35]. In chromatographically separated samples, this evolves into a three-dimensional data structure with dimensions of retention time, m/z, and intensity [35]. The process of converting the large raw data files into a structured digital fingerprint involves:
- Centroiding: Profile mode data is often centroided, a process that integrates the signal from a gaussian region of a continuum spectrum into a single m/z-intensity pair, significantly reducing file size [35].
- Feature Table Generation: Pre-processing software (e.g., xcms) detects peaks and aligns them across samples to create a feature table. This matrix, where rows represent features (defined by m/z and RT) and columns represent samples, is the core structured representation of the digital fingerprint [35].
- Data Structuring: This feature table can be encapsulated into structured data objects (e.g., a
SummarizedExperimentin R) that align the quantitative data with relevant metadata, such as feature definitions and sample annotations [35].
Workflow Performance and Data Metrics
The performance of the combined DDA-DIA workflow can be evaluated using quantitative metrics. The following table summarizes key outcomes from a study on urban runoff analysis.
Table 2: Performance Metrics of the Combined DDA-DIA Workflow in Urban Runoff Analysis
| Metric | Result | Context and Significance |
|---|---|---|
| DIA Features Detected | 64,175 total features | Reflects the high complexity of the urban runoff sample matrix [34]. |
| Features Matched after Filtering | 4,718 (6% of total) | Filtering focuses on components with high-quality MS/MS, improving confidence in identifications [34]. |
| Median Intensity (Matched) | 7.9 × 10⁴ | Matched features had significantly higher intensity than non-matched features, aiding annotation [34]. |
| Target Compound Annotation | 50% as top hit; 68% with manual review | Outperforms single-injection DDA (19-33% success), demonstrating the advantage of iterative DDA [34]. |
| Novel Identifications | Tentative ID of previously unreported tire-derived compounds (CPG, BBG) | Highlights the method's potential for discovery of environmentally relevant micropollutants [34]. |
The Scientist's Toolkit: Essential Research Reagents and Materials
The following table details key materials and software solutions essential for implementing the digital fingerprinting workflow.
Table 3: Essential Research Reagents and Software Solutions
| Item | Function/Description | Application Note |
|---|---|---|
| Multi-layer SPE Cartridge | Combines multiple sorbent phases (e.g., Oasis HLB, Isolute ENV+, Supelclean envi-Carb) in a single cartridge to maximize the range of extractable micropollutants [34] [33]. | Critical for non-target screening to capture a broad spectrum of analytes with diverse physicochemical properties [33]. |
| UHPLC C18 Column (e.g., 100mm x 2.1mm, 1.7µm) | Provides high-efficiency chromatographic separation of complex environmental samples, reducing ion suppression and co-elution [34]. | Standard for reverse-phase separation of semi-polar and polar organic pollutants. |
| High-Resolution Mass Spectrometer (Orbitrap-based) | Delivers high mass accuracy and resolving power, enabling precise determination of elemental formulas and separation of isobaric compounds [34] [1]. | Fundamental for reliable non-target screening and creation of a definitive digital fingerprint [1]. |
| Sirius Software | Performs molecular formula identification and structural annotation by interpreting isotopic patterns and fragmentation trees from MS/MS data [34]. | Key in-silico tool for annotating unknown compounds without a reference standard. |
| MSDial Software | An open-source software package for peak picking, alignment, and deconvolution of HRMS data, particularly from DIA and AIF acquisitions [34]. | Enables processing of complex DIA data sets into a feature table. |
| xcms R Package | A widely used open-source package for pre-processing and statistical analysis of chromatographically coupled MS data [35]. | The standard in metabolomics and environmental NTS for peak detection and alignment across samples. |
The comprehensive non-target screening (NTS) of environmental pollutants using high-resolution mass spectrometry (HRMS) presents a significant data processing challenge, often generating thousands of chemical features per sample. The critical bottleneck lies in efficiently distinguishing relevant chemical signals from background noise and accurately identifying compounds of interest within these complex datasets. Automated data processing workflows are essential for transforming raw HRMS data into meaningful chemical information, enabling researchers to detect and prioritize emerging environmental contaminants effectively. This application note details established protocols for peak picking, alignment, and feature detection using the MZmine platform, providing environmental scientists with standardized methodologies to advance their research on pollutants in water, soil, and biota [1].
Experimental Protocols
Materials and Reagents
Table 1: Research Reagent Solutions for HRMS-Based Environmental Analysis
| Item Name | Function/Application |
|---|---|
| Liquid Chromatography-High Resolution Mass Spectrometry (LC-HRMS) | Primary instrumentation for non-target screening of complex environmental samples [10] [1]. |
| mzML/mzXML Data Format | Standardized, open data formats ensure platform interoperability and facilitate data exchange in collaborative projects [36] [1]. |
| Reference Databases (e.g., NORMAN, PubChemLite, CompTox) | Used for suspect screening and compound identification by matching against known contaminants [4]. |
| QTOF, Orbitrap, or FT-ICR MS Instruments | High-resolution mass spectrometers capable of generating the accurate mass data required for non-target screening [36] [1]. |
| MZmine 2/3 Software | Open-source platform for processing, visualizing, and analyzing mass spectrometry-based molecular profile data [36] [37]. |
The following diagram illustrates the complete data processing workflow for non-target screening of environmental samples, from raw data to a prioritized compound list.
Detailed Methodology
Peak Picking and Chromatogram Construction
Peak detection in MZmine 2 is a multi-step, customizable process critical for accurate feature detection [36].
Mass Detection: Process individual MS spectra to convert raw profile data into pairs of m/z and intensity values (centroided data). Algorithm selection is crucial:
Recursive Threshold: Suitable for general use; reduces false positives using minimum and maximum peak m/z width parameters.Wavelet Transform: Ideal for noisy data; uses continuous wavelet transform to match m/z peaks to a "Mexican hat" model.Exact Mass: Best for high-resolution, low-noise spectra; determines peak center using the "full width at half maximum" principle.
Chromatogram Building: The software connects consecutive m/z values across multiple scans to construct chromatograms. The default algorithm connects m/z values ordered by intensity (most intense first), within a user-defined m/z tolerance, and spanning a minimum time range.
Chromatographic Peak Deconvolution: Deconvolute each chromatogram into individual peaks using algorithms such as:
Baseline Cut-off: Recognizes peaks above a set intensity level that span a minimum time range.Noise Amplitude: Automatically determines the baseline intensity level by analyzing the concentration of noise in the chromatogram.
Peak List Alignment and Gap Filling
After peak picking, data from multiple samples must be integrated.
- Alignment: MZmine 2 uses the Random Sample Consensus (RANSAC) algorithm for robust peak list alignment. This method is particularly effective for handling nonlinear shifts in retention times between runs and is more resistant to outliers compared to traditional algorithms [36].
- Gap Filling: This step addresses missing peaks in some samples but present in others. The algorithm searches for missing features in the raw data of aligned samples based on the m/z and retention time of detected peaks in other samples, ensuring a more complete data matrix for statistical analysis.
Optimization Using Design of Experiments
A key strategy for optimizing MZmine 2 data processing parameters is the use of a Design of Experiments (DoE) approach. This methodology systematically evaluates the impact of multiple parameters and their interactions on peak detection performance.
Table 2: Key Data Processing Parameters for Optimization via DoE
| Processing Step | Key Parameters | Performance Metric |
|---|---|---|
| Mass Detection | Noise level, m/z tolerance | Number of true positives/negatives detected |
| Chromatogram Building | m/z tolerance, minimum time span | Accuracy of chromatogram formation |
| Deconvolution | Baseline level, peak duration range | Chromatographic peak shape and resolution |
| Alignment | RANSAC parameters, m/z and RT tolerance | Alignment quality across sample sets |
A study using pristine water spiked with 78 contaminants demonstrated that DoE could optimize MZmine 2 parameters to detect 75–100% of the peaks compared to manual evaluation, providing a significant effort-saving strategy for parameter optimization [14]. Short MS cycle times, favoring full-scan acquisition over additional MS² experiments, were also found to significantly improve automatic peak detection quality.
Integration with Prioritization Strategies
A primary challenge in NTS is prioritizing features for identification. MZmine processing is most powerful when integrated with prioritization strategies to focus on environmentally relevant compounds.
Table 3: Seven Prioritization Strategies for Environmental NTS
| Strategy | Description | Application in Workflow |
|---|---|---|
| Target/Suspect Screening (P1) | Uses predefined databases (NORMAN, PubChemLite) to match features to known compounds [10] [4]. | Early filtering to reduce candidate list. |
| Data Quality Filtering (P2) | Removes artifacts and unreliable signals based on blanks, replicate consistency, and peak shape [10] [4]. | Foundational step to ensure data reliability. |
| Chemistry-Driven (P3) | Uses HRMS properties (mass defect, isotopes) to find homologues (e.g., PFAS) and transformation products [10] [4]. | Flags specific, hazardous compound classes. |
| Process-Driven (P4) | Uses spatial/temporal data (e.g., upstream vs. downstream) to find persistent or newly formed compounds [10] [4]. | Highlights features correlated with specific sources. |
| Effect-Directed (P5) | Links chemical features to biological effects via bioassays or statistical models (vEDA) [10] [4]. | Directly targets bioactive contaminants. |
| Prediction-Based (P6) | Uses models (e.g., MS2Tox) to predict risk from MS data, enabling risk-based ranking [10] [4]. | Prioritizes by potential environmental impact. |
| Pixel/Tile-Based (P7) | Analyzes 2D chromatographic images to find regions of interest before peak detection, useful for highly complex samples [10] [4]. | Early exploration of large datasets. |
Application in Environmental Research
The integration of automated data processing with structured prioritization is revolutionizing environmental monitoring. For instance, this approach has been successfully applied at the International Rhine monitoring station, leading to the identification of previously undetected chemical spill events and industrially relevant quaternary phosphonium compounds with proven cytotoxic and genotoxic potential [1]. These significant emissions would likely have been missed by conventional targeted monitoring programs. By combining MZmine's data processing capabilities with the sequential application of prioritization strategies, researchers can systematically reduce thousands of detected features to a manageable number of high-priority compounds, focusing identification efforts on substances that pose the greatest potential risk to ecosystems and human health [10] [4] [1]. This workflow provides a robust foundation for advancing environmental risk assessment and supporting evidence-based regulatory decision-making.
High-resolution mass spectrometry (HRMS) has become the cornerstone of modern non-targeted analysis (NTA), enabling the detection and identification of unknown chemicals in complex environmental samples. The ability to characterize the chemical exposome—the totality of environmental exposures throughout life—depends heavily on robust compound identification strategies [9]. Within this framework, two complementary approaches have emerged as fundamental tools: tandem mass spectral libraries for experimental spectrum matching and in-silico fragmentation for predicting spectral data computationally [38] [39]. The integration of these methods addresses a critical challenge in NTA: while advanced HRMS platforms can detect thousands of molecular features in a single sample, the vast majority remain unidentified or only tentatively characterized due to the lack of reference standards and spectral data [39] [1].
The identification process in HRMS-based NTA is hierarchical, with varying levels of confidence. The Schymanski scale provides a standardized framework for reporting identification confidence, ranging from Level 1 (confirmed structure via reference standard) to Level 5 (exact mass only) [40]. Spectral library matching can achieve Level 2a (probable structure through library spectrum match), while in-silico fragmentation typically supports Level 3 (tentative candidate) annotations [39] [40]. This application note details practical protocols for implementing these complementary strategies within environmental pollutant research, providing researchers with structured methodologies to enhance identification rates and confidence in NTA workflows.
Strategic Approaches for Compound Identification
Tandem Mass Spectral Libraries
Tandem mass spectral libraries represent collections of experimentally acquired fragmentation spectra from reference standards, serving as essential tools for compound annotation in liquid chromatography (LC)-HRMS workflows [38] [40]. These libraries enable rapid compound identification by comparing acquired sample spectra against reference entries, with good matches yielding Level 2a annotations according to the Schymanski confidence scale [40].
The utility of spectral libraries, however, faces a fundamental limitation: incomplete coverage of the chemical space. Current analyses reveal a significant gap between the number of potential environmental contaminants and available spectral data. For major environmental suspect databases, only 0.57–3.6% of chemicals have experimentally measured spectral information available [40]. This coverage gap necessitates complementary identification strategies.
Library Quality and Harmonization: The analytical value of a spectral library depends heavily on its quality and consistency. Factors such as collision energy settings, instrument type, and fragmentation techniques significantly impact spectral reproducibility and matching reliability [38]. Research demonstrates that spectra acquired on different HRMS instruments (e.g., quadrupole time-of-flight [QqTOF] versus Orbitrap) can provide complementary identification power when appropriate collision energy ranges are employed [38]. For optimal cross-instrument matching, spectra acquired in the range of CE 20–50 eV on QqTOF instruments and 30–60 nominal collision energy units on Orbitrap instruments have demonstrated strong performance [38].
Table 1: Key Tandem Mass Spectral Libraries for Environmental Analysis
| Library Name | Type | Characteristics | Coverage | Access |
|---|---|---|---|---|
| NORMAN Suspect List Exchange | Suspect List | Collaborative database of substances relevant for environmental monitoring | 120,514 compounds (2024 version) | Open |
| MassBank | Spectral Library | Public repository of MS/MS spectra from various instruments | 27,622 unique compounds across all databases (2016 data) | Open |
| GNPS | Spectral Library | Focus on natural products; includes molecular networking capability | 7127 compounds in open databases (2016 data) | Open |
| HMDB | Spectral Library | Human metabolome data; combines experimental and in-silico spectra | Limited overlap with environmental compounds | Open |
| Commercial Libraries | Spectral Library | Various vendor-specific libraries (e.g., mzCloud) | Varies by vendor; generally complementary to open libraries | Commercial |
In-Silico Fragmentation Approaches
In-silico fragmentation techniques computationally predict mass spectra from chemical structures, dramatically expanding the identifiable chemical space beyond experimentally available reference standards [39]. These methods are particularly valuable for annotating features in the "dark chemical space"—compounds detected in NTA but absent from experimental libraries [39]. Two primary computational strategies exist: the forward approach (compound-to-spectrum, C2MS) that predicts spectra from known structures, and the reverse approach (spectrum-to-compound, MS2C) that ranks candidate structures from experimental spectra [39].
The forward approach generates predicted spectral libraries from suspect lists, enabling suspect screening with Level 3 confidence. Recent advances have produced open-access in-silico libraries covering extensive chemical spaces, such as a library generated from the NORMAN Suspect List Exchange (containing 120,514 chemicals) using CFM-ID 4.4.7 software [39]. This library has successfully identified previously unreported pollutants in groundwater, including xenobiotics such as hexafluoroacetone and transformation products of pesticides like triallate and propiconazole [39].
The reverse approach utilizes tools like MetFrag, CFM-ID, MS-Finder, and CSI:FingerID to interpret experimental MS/MS spectra by comparing them against structures in chemical databases [39]. These tools can propose structural candidates for completely unknown compounds, extending identification capabilities to novel contaminants without pre-existing spectral references.
Table 2: Comparison of In-Silico Fragmentation Tools and Applications
| Tool Name | Approach | Methodology | Strengths | Applications |
|---|---|---|---|---|
| CFM-ID | Forward & Reverse | Probabilistic fragmentation tree | Can generate and interpret spectra; high accuracy | Environmental contaminants, metabolomics |
| MetFrag | Reverse | Bond dissociation and rearrangement | Integration of metadata (RT, HDX); open source | Environmental screening, metabolomics |
| MS-Finder | Reverse | Fragment ion annotation and tree-based scoring | Comprehensive structure elucidation | Natural products, metabolomics |
| CSI:FingerID | Reverse | Machine learning on fragmentation trees | High identification rates for unknowns | Metabolomics, toxicology |
| LipidBlast | Forward | Rule-based for lipid classes | Specialized for lipidomics | Lipid identification |
Experimental Protocols
Protocol 1: Spectral Library Annotation for LC-HRMS/MS Data
This protocol describes the procedure for annotating compounds in environmental samples using tandem mass spectral libraries, suitable for achieving Level 2a identification confidence [38] [40].
Materials and Reagents:
- Environmental sample extracts (e.g., water, soil, biota)
- LC-MS grade solvents: methanol, acetonitrile, water
- Formic acid or ammonium acetate for mobile phase modification
- Reference standards for quality control (optional)
Instrumentation:
- Liquid chromatography system coupled to high-resolution mass spectrometer
- Recommended: Q-TOF, Orbitrap, or similar HRMS platform
- C18 reversed-phase column (e.g., 100 × 2.1 mm, 1.7–2.6 μm particle size)
Procedure:
- Sample Preparation:
- Prepare sample extracts using appropriate extraction techniques (SPE, LLE, etc.)
- Reconstitute dried extracts in initial LC mobile phase composition
- Include process blanks and quality control samples
LC-HRMS/MS Analysis:
- Employ gradient elution with water and organic modifier (methanol or acetonitrile)
- Add 0.1% formic acid for positive ionization mode or ammonium acetate for negative mode
- Set mass resolution to >50,000 FWHM for confident formula assignment
- Acquire data in data-dependent acquisition (DDA) mode:
- Full scan MS (m/z 50–1500) at high resolution
- MS/MS scans on top 3–10 most intense ions per cycle
- Use stepped collision energy: 20–50 eV for Q-TOF or 30–60 NCE for Orbitrap for broader fragmentation coverage [38]
- Apply dynamic exclusion to maximize compound coverage
Data Processing:
- Convert raw data to open formats (mzML, mzXML) if needed
- Perform peak detection, alignment, and componentization using software (e.g., MZmine, MS-DIAL, Compound Discoverer)
- Export MS/MS spectra for library searching
Spectral Library Searching:
- Search experimental MS/MS spectra against multiple libraries (e.g., MassBank, NORMAN, commercial libraries)
- Apply appropriate matching algorithms (e.g., cosine similarity, dot product)
- Set minimum matching score thresholds (typically >0.7 for confident annotation)
- Consider consensus scoring across multiple libraries
Validation and Reporting:
- Verify annotations with orthogonal data (retention time prediction, isotope patterns)
- Report confidence levels using standardized scales (Schymanski levels)
- Document matching scores and library sources for transparency
Protocol 2: Implementation of In-Silico Spectral Libraries
This protocol details the generation and application of in-silico spectral libraries for suspect screening, enabling Level 3 annotations of compounds lacking experimental spectra [39].
Materials and Software:
- Suspect list (e.g., NORMAN Suspect List Exchange)
- Chemical structures in SMILES format
- CFM-ID software (version 4.4.7 or higher)
- Docker Desktop for containerization
- RDKit package for structural cleanup
- Data processing environment (Julia, Python, or R)
Procedure:
- Suspect List Curation:
- Obtain comprehensive suspect list (e.g., NORMAN SusDat with 120,514 compounds)
- Extract SMILES structures for all entries
- Perform structural cleanup using RDKit:
- Remove salts and counterions
- Neutralize structures
- Standardize tautomers and stereochemistry
- Retrieve missing structures from PubChem using PugRest API
In-Silico Spectral Generation:
- Configure CFM-ID parameters for ESI positive and negative mode
- Set collision energy levels appropriate for your instrument (e.g., 10, 20, 40 eV)
- Execute batch prediction through command line interface:
- Process output files to generate standardized .MSP or .MGF format libraries
Library Integration:
- Convert generated libraries to instrument-specific formats (e.g., .DB for Thermo, .DBS for Sciex)
- Import into processing software (MZmine, MS-DIAL, Compound Discoverer)
- Configure search parameters (precursor mass tolerance, fragment tolerance)
Suspect Screening:
- Process LC-HRMS/MS data with conventional feature detection
- Perform suspect screening against in-silico library
- Apply retention time filtering if predicted values are available
- Use appropriate scoring metrics (e.g., composite score incorporating mass accuracy, isotopic pattern, and fragmentation similarity)
Results Validation:
- Prioritize candidates based on detection frequency and intensity
- Verify with orthogonal approaches (hydrogen-deuterium exchange, retention time prediction)
- Confirm high-priority identifications with reference standards when possible
Workflow Integration and Advanced Techniques
Integrated Identification Strategy
A robust compound identification strategy combines both experimental and computational approaches in a hierarchical workflow. The following diagram illustrates how these methods integrate to maximize identification confidence and coverage in environmental NTA:
Figure 1: Integrated workflow for compound identification in non-target analysis combining experimental and computational approaches.
Hydrogen-Deuterium Exchange for Enhanced Confidence
Hydrogen-deuterium exchange (HDX) provides complementary structural information that significantly improves identification confidence when integrated with in-silico fragmentation [41]. This technique identifies exchangeable hydrogens (connected to heteroatoms like O, N, S) by replacing them with deuterium atoms when using deuterated solvents, causing characteristic mass shifts.
Protocol for HDX Integration:
- Experimental Setup:
- Prepare mobile phases with deuterated solvents (D₂O instead of H₂O, MeOD instead of MeOH)
- Maintain identical chromatographic conditions to conventional analysis
- Analyze samples in both normal and deuterated conditions
Data Interpretation:
- Observe mass shifts in MS1: [M+D]⁺ in positive mode, [M-D]⁻ in negative mode
- Determine number of exchangeable hydrogens from mass difference
- Analyze fragmentation patterns in MS/MS for deuterium incorporation
MetFrag Integration:
- Incorporate HDX scoring terms into MetFrag candidate ranking
- Prioritize structures consistent with observed exchangeable hydrogens
- Filter candidates with incorrect hydrogen/deuterium exchange behavior
Studies demonstrate that HDX integration improves correct identifications, with 29 additional correct identifications in positive mode and increased top-10 rankings from 80 to 106 in negative mode for environmental compounds [41].
Essential Research Reagents and Computational Tools
Table 3: Research Reagent Solutions for Compound Identification Workflows
| Category | Item | Specification/Version | Application/Purpose |
|---|---|---|---|
| Reference Standards | Certified analytical standards | >95% purity | Method validation; Level 1 identification |
| LC-MS Solvents | LC-MS grade water, methanol, acetonitrile | Low volatility, high purity | Mobile phase preparation |
| Mobile Phase Additives | Formic acid, ammonium acetate, ammonium formate | LC-MS grade | Ionization enhancement in ESI |
| Deuterated Solvents | D₂O, MeOD (CD₃OD) | 99.8% D minimum | Hydrogen-deuterium exchange experiments |
| SPE Cartridges | C18, HLB, mixed-mode | 60-500 mg sorbent capacity | Sample cleanup and concentration |
| Software Tools | CFM-ID | v.4.4.7+ | In-silico spectrum generation and prediction |
| Software Tools | MetFrag | Command line or web version | In-silico fragmentation with metadata integration |
| Software Tools | MZmine | v.4.3+ | Open-source data processing for NTA |
| Software Tools | MS-DIAL | v.4.9+ | Comprehensive NTA data analysis |
| Software Tools | RDKit | v.2024.09.4+ | Cheminformatics and SMILES handling |
| Chemical Databases | NORMAN Suspect List Exchange | 2024 version (120,514 compounds) | Suspect screening for environmental compounds |
| Chemical Databases | PubChem | REST API access | Chemical structure and property information |
Concluding Remarks
The integration of tandem mass spectral libraries and in-silico fragmentation represents a powerful synergy for advancing compound identification in non-targeted analysis of environmental pollutants. While spectral libraries provide higher confidence annotations (Level 2a), their limited coverage necessitates complementary computational approaches. In-silico fragmentation methods dramatically expand the identifiable chemical space, enabling tentative annotation (Level 3) of thousands of compounds lacking experimental spectra [39] [40].
Future developments in compound identification will likely focus on improving prediction accuracy of in-silico tools, harmonizing spectral libraries across platforms and laboratories, and integrating orthogonal data such as hydrogen-deuterium exchange and retention time prediction [41] [40]. The environmental research community would benefit from centralized, curated repositories of both experimental and predicted spectra following standardized quality control protocols [1] [40].
As these methodologies continue to mature, they will enhance our ability to characterize the complex chemical mixtures present in environmental systems, supporting more comprehensive exposure assessment and informed chemical management decisions [9] [1]. By implementing the protocols and strategies outlined in this application note, researchers can significantly advance their capabilities to identify previously unknown environmental contaminants and transformation products.
Within the framework of a broader thesis on high-resolution mass spectrometry (HRMS) for non-target screening (NTS) of environmental pollutants, this document presents detailed application notes and protocols. The focus is on two critical challenges in environmental analytical chemistry: tracking unknown transformation products (TPs) of pharmaceuticals and identifying the complex fingerprint of industrial spills in major river systems. Liquid chromatography coupled to high-resolution mass spectrometry (LC-HRMS) has become the cornerstone technique for NTS, enabling the detection and identification of thousands of organic micropollutants without prior knowledge of their identity [42] [43]. This capability is vital for modern risk mitigation and adhering to the precautionary principle, moving beyond traditional target analysis to reveal previously overlooked contaminants of emerging concern (CECs) [44] [28].
Experimental Protocols for NTS Using LC-HRMS
Sample Collection and Preparation
Passive Sampling for Representative Data
- Principle: Passive samplers, such as Polar Organic Chemical Integrative Samplers (POCIS), are deployed in the river system for extended periods (e.g., 2-4 weeks). They provide time-weighted average concentrations and pre-concentrate hydrophilic compounds, overcoming limitations of grab sampling that only captures a snapshot in time [45].
- Protocol: Deploy POCIS devices in triplicate at each sampling site (upstream and downstream of suspected input sources like wastewater treatment plants (WWTPs) or industrial outlets). Upon retrieval, disassemble the samplers and extract the sorbent using a suitable solvent (e.g., methanol). Concentrate the extracts under a gentle stream of nitrogen and reconstitute in an injection solvent compatible with LC-HRMS [45].
Solid Phase Extraction (SPE) for Grab Samples
- Principle: For direct water samples, SPE is used to pre-concentrate analytes and remove matrix interferences. Hydrophilic-Lipophilic Balanced (HLB) polymers are commonly used for their broad-spectrum retention of pollutants [46].
- Protocol: Filter water samples (typically 0.45 µm glass fiber filter). Acidify or adjust the pH as needed. Pass a known volume of water (e.g., 500 mL to 1 L) through the conditioned SPE cartridge. Dry the cartridge under vacuum and elute analytes with a series of organic solvents (e.g., methanol followed by acetone). Concentrate and reconstitute the eluent as above [46].
LC-HRMS Instrumental Analysis
Liquid Chromatography (LC) Separation
- Column: Use a reversed-phase C18 column (e.g., 100 mm x 2.1 mm, 1.7-2 µm particle size) for high-efficiency separation.
- Mobile Phase: Employ a binary gradient. Mobile phase A is often water with 0.1% formic acid, and phase B is methanol or acetonitrile, also with 0.1% formic acid. The gradient should ramp from a low to a high percentage of B to separate compounds of varying polarities.
- Injection Volume: Typically 5-20 µL.
High-Resolution Mass Spectrometry (HRMS) Detection
- Ionization Source: Electrospray Ionization (ESI), in both positive and negative modes, is standard for broad compound coverage [47] [48].
- Mass Analyzer: Use a high-resolution mass analyzer such as a Time-of-Flight (TOF) or Orbitrap, capable of providing mass accuracies of < 5 ppm and resolving power > 50,000 FWHM [44] [47].
- Data Acquisition: Data-Dependent Acquisition (DDA) is recommended. A typical cycle consists of one full MS1 scan (e.g., m/z 100-1000) at high resolution, followed by MS2 scans on the most intense precursor ions. This generates fragmentation data essential for structural elucidation [43].
Data Processing Workflow
The data processing workflow for NTS is a critical, multi-step process to convert raw data into meaningful chemical identities, as illustrated below.
Step 1: Data Preprocessing (Centroiding & Peak Picking)
- Objective: Convert the raw, profile-mode mass spectral data into a list of defined features, each characterized by a retention time (rt), mass-to-charge ratio (m/z), and intensity (I) [44].
- Algorithms: Common algorithms include continuous wavelet transform (cwt) or those based on full width at half maximum (fwhm). This step significantly reduces data size and is a foundation for all subsequent analysis [44].
Step 2: Feature Alignment and Componentization
- Objective: Align features detected across multiple samples to account for minor retention time shifts and group related features (e.g., isotopes, adducts, and fragments) into a single "component" representing one analyte [44].
- Process: Use software tools to perform retention time alignment and peak grouping across the sample set (e.g., upstream vs. downstream).
Step 3: Feature Prioritization
- Objective: Narrow down thousands of detected features to a manageable number of high-priority candidates for identification. This is crucial for efficient resource allocation. The following table summarizes key strategies [28].
Table 1: Key Prioritization Strategies for NTS in Environmental Analysis
| Strategy | Principle | Application in Case Studies |
|---|---|---|
| Process-Driven | Compare feature intensities across different sample types (e.g., upstream vs. downstream of a WWTP or spill). | Identify compounds with significantly elevated concentrations downstream of an input source. |
| Chemistry-Driven | Use HRMS data properties to flag compounds of concern (e.g., presence of halogenated isotope patterns). | Prioritize persistent, bioaccumulative compounds often associated with industrial chemicals. |
| Effect-Directed Analysis (EDA) | Combine chemical analysis with bioassays to isolate fractions causing toxic effects. | Pinpoint toxic TPs or unknown industrial compounds responsible for observed ecological impacts. |
| Prediction-Based | Use machine learning models to predict toxicity, concentration, or biodegradability. | Prioritize features predicted to have high toxicological risk or environmental persistence. |
Step 4: Compound Identification
- Objective: Assign a tentative structure to the prioritized features.
- Workflow:
- Formula Assignment: Determine the molecular formula using the accurate mass and isotopic pattern from the MS1 spectrum.
- Fragmentation Interpretation: Interpret the MS2 fragmentation spectrum to deduce the molecular structure.
- Database Searching: Query the acquired MS2 spectrum against spectral libraries (e.g., MassBank, NIST) and compound databases (e.g., PubChem, ChemSpider).
- Confidence Level: A Level 1 identification (confirmed with an analytical standard) is the gold standard. For true unknowns, a Level 2a (probable structure based on spectral library match) or 2b (diagnostic evidence) identification is often the achievable goal [43].
Case Study 1: Pharmaceutical Transformation Products in a River System Receiving WWTP Effluent
Background: A study aimed to identify unknown TPs of pharmaceuticals in a river system influenced by WWTP discharge, leveraging sales data and pharmacokinetic data for prediction [49].
Experimental Design:
- Samples: Passive (POCIS) and grab samples were collected upstream and downstream of the WWTP discharge point over multiple time points.
- LC-HRMS Analysis: Analysis was performed using LC-ESI-HRMS in data-dependent acquisition (DDA) mode.
Data Analysis & Prioritization Logic: The logical workflow for identifying and prioritizing TPs is summarized below.
Key Findings:
- The study used national pharmaceutical sales statistics to predict the environmental concentration (PEC) of 33 typical pharmaceuticals [49].
- The EPI (Estimation Programs Interface) biodegradation model was used to predict removal in WWTPs, showing varying removal rates (e.g., 14.1% for roxithromycin, 75.1% for acetaminophen) [49].
- By combining concentration data and detection frequency, 9 drugs were identified with significant toxicological risks, and 24 were marked as potential concerns [49].
- Quantification without authentic standards was achieved using machine learning-based prediction of ionization efficiency (IE), with the Random Forest model (RandFor-IE) performing best. This approach reported a mean prediction error of 15x, with over 83% of compounds quantified within a 10x error margin in an interlaboratory study [50].
Table 2: Representative Data from Pharmaceutical TP Case Study
| Compound / Class | Key Metric | Value / Finding | Methodological Note |
|---|---|---|---|
| Tetracycline, Ciprofloxacin, Acetaminophen | Predicted Environmental Concentration (PEC) | Highest among 33 studied pharmaceuticals | Based on sales and excretion data [49] |
| Roxithromycin (Macrolide) | Predicted WWTP Removal | 14.1% | EPI Biodegradation Model [49] |
| Carbamazepine | Predicted WWTP Removal | 44.5% | EPI Biodegradation Model [49] |
| Acetaminophen | Predicted WWTP Removal | 75.1% | EPI Biodegradation Model [49] |
| RandFor-IE Model | Quantification Accuracy (Mean Error) | 15x | Machine Learning-based IE prediction [50] |
Case Study 2: Non-Targeted Analysis of an Industrial Spill
Background: An NTS approach was applied to characterize the complex chemical fingerprint of an industrial spill affecting a major river, where the specific contaminants were initially unknown [44].
Experimental Design:
- Samples: Grab samples were taken directly from the spill plume and at multiple points downstream. Upstream samples served as controls.
- LC-HRMS Analysis: Analysis was performed using LC-HRMS with both full-scan and DDA modes.
Data Analysis & Prioritization:
- Pixel-Based Prioritization: As a broad, data-driven first step, the 2D chromatographic data (retention time vs. m/z) was treated as an image. "Pixels" or features that were significantly more intense in the spill and downstream samples compared to the upstream control were automatically highlighted [28].
- Chemistry-Driven Prioritization: The high-resolution data was mined for features containing characteristic isotope patterns, such as those of chlorine or bromine, which are common in industrial chemicals (e.g., flame retardants, chlorinated paraffins) [48] [28].
- Temporal Trend Analysis: The attenuation of feature intensities along the river's flow path (from the spill source to downstream points) was used to prioritize persistent compounds.
Key Findings:
- NTS allowed for the detection of abstract features not covered by conventional target analysis, providing a characteristic fingerprint for the spill sample [44].
- The data processing workflow, particularly steps like centroiding and peak detection, was challenged by the need to detect less intense but relevant features within a highly complex and variable background signal from the spill matrix [44].
- Prioritization strategies were critical to narrow down thousands of detected features to a manageable number for identification, successfully identifying several priority hazardous substances and their associated compounds [28].
The Scientist's Toolkit: Essential Reagents and Materials
Table 3: Key Research Reagent Solutions for NTS of Water Samples
| Item | Function / Application |
|---|---|
| HLB (Hydrophilic-Lipophilic Balanced) SPE Cartridge | Broad-spectrum extraction and pre-concentration of diverse organic pollutants from water samples [46]. |
| POCIS (Polar Organic Chemical Integrative Sampler) | Passive in-situ sampling providing time-weighted average concentrations for hydrophilic compounds [45]. |
| Isotope-Labeled Internal Standards (ILIS) | Correction for matrix effects and losses during sample preparation; essential for improving quantification accuracy in LC-HRMS [50]. |
| LC-MS Grade Solvents (MeOH, ACN, Water) | Ensure minimal background interference and high signal-to-noise ratio during LC-HRMS analysis. |
| Formic Acid (LC-MS Grade) | Mobile phase additive to promote protonation of analytes in positive ESI mode, improving ionization efficiency. |
| Instrument Calibration Solution | A standard mixture (e.g., with sodium acetate) for mass accuracy calibration of the HRMS instrument before data acquisition. |
| Retention Time Index (RTI) Standards | A set of compounds spiked into every sample to correct for minor retention time shifts during chromatographic alignment in data processing [44]. |
These application notes demonstrate that LC-HRMS-based NTS is a powerful approach for unraveling complex pollution scenarios in river systems. The case studies on pharmaceutical TPs and industrial spills highlight the critical importance of a structured workflow—from robust sampling and high-quality instrumental analysis to sophisticated data processing and intelligent prioritization strategies. The adoption of machine learning for quantification and the development of standardized, automated data processing workflows are key advancements that enhance the comparability and reliability of NTS results across different studies. This methodology provides a comprehensive toolset for environmental scientists to identify previously unknown contaminants, assess their risks, and inform regulatory decision-making, thereby contributing significantly to the protection of aquatic ecosystems.
Navigating the Complexities: Overcoming Key Challenges in HRMS-NTS
In the field of environmental analytical chemistry, non-target screening (NTS) using chromatography coupled to high-resolution mass spectrometry (HRMS) has become fundamental for detecting and prioritizing chemicals of emerging concern (CECs) in complex matrices [10] [51]. The credibility of NTS findings hinges on two pillars of measurement reliability: repeatability and reproducibility. Repeatability refers to the ability of a measurement process to produce consistent results when carried out by the same person or instrument on the same item under the same conditions [52]. Reproducibility, in contrast, refers to obtaining consistent results when different people, instruments, or locations conduct the same experiment [52]. For NTS data to be truly actionable in regulatory decision-making, researchers must implement robust strategies to ensure both parameters throughout the analytical workflow.
Definitions and Core Concepts in Measurement Reliability
Distinguishing Between Repeatability and Reproducibility
In the context of measurement system analysis, repeatability and reproducibility are distinct but complementary concepts [52]. Table 1 summarizes their key differences, which are foundational for designing appropriate quality control measures.
Table 1: Fundamental Differences Between Repeatability and Reproducibility
| Parameter | Repeatability | Reproducibility |
|---|---|---|
| Operator | Same person or instrument | Different people or instruments |
| Conditions | Identical conditions, short time frame | Different locations, environments, or time variations |
| Primary Goal | Assess precision under controlled settings | Evaluate broader reliability across varying conditions |
| Typical Causes of Poor Performance | Calibration issues, instrument drift, human error, random errors [52] | Methodological inconsistencies, lack of documentation, environmental factors, operator errors [52] |
The Critical Role in Non-Target Screening
In NTS, the vast number of generated features (often thousands per sample) creates a significant bottleneck at the identification stage [4]. Without reliable data, compound identification becomes hypothetical. Data quality filtering serves as a foundational prioritization strategy to remove artifacts and unreliable signals based on occurrence in blanks, replicate consistency, peak shape, and instrument drift [10] [4]. This step is essential for reducing false positives and improving the accuracy and reproducibility of the entire workflow, ultimately ensuring that resources are focused on the most chemically relevant features [4].
Experimental Protocols for Ensuring Data Quality
The following protocols provide a structured approach to integrate quality assurance measures into every stage of the NTS workflow.
Protocol 1: Establishing Repeatability in NTS-HRMS
Objective: To achieve consistent, high-quality feature detection within a single laboratory under controlled conditions.
Materials and Reagents:
- Certified reference standards for relevant compound classes
- Internal standard mixture (e.g., stable isotope-labeled compounds)
- High-purity solvents (LC-MS grade)
- Quality control (QC) sample: A pooled sample from all test samples or a standard reference material
Procedure:
- System Suitability Testing: Prior to sample sequence analysis, inject a standard mixture containing at least five reference compounds covering a range of polarities and masses. Evaluate chromatographic peak shape, retention time stability, and mass accuracy. Acceptability criteria: Mass accuracy < 2 ppm; retention time drift < 0.1 min over 24 hours.
- Internal Standardization: Spike all samples, blanks, and QC samples with a consistent amount of internal standard mixture. This corrects for instrument response drift and matrix effects [51].
- Replicate Analysis: Analyze the pooled QC sample a minimum of five times throughout the analytical sequence (at beginning, end, and periodically interspersed) to monitor instrumental stability.
- Data Acquisition: Acquire data in randomized order to avoid bias. Use data-dependent acquisition (DDA) to collect MS/MS spectra for feature identification.
- Data Processing and Quality Filtering: Process all data using consistent software parameters (e.g., in MZmine, XCMS, or PatRoon [51]). Apply the following filters to the feature list:
- Blank Subtraction: Remove features detected in procedural blanks with an intensity ≥ 20% of the sample intensity.
- Repeatability Filter: Retain only features with a coefficient of variation (CV) < 30% in the replicate QC injections.
- Peak Shape Filter: Apply thresholds for minimum peak width and signal-to-noise ratio (e.g., S/N > 5).
Troubleshooting Tips:
- Poor CV in QC replicates: Check instrument calibration, source contamination, or insufficient sample homogenization.
- High background noise: Ensure solvent purity and clean the ion source.
Protocol 2: Assessing Reproducibility in NTS-HRMS
Objective: To validate that NTS findings are consistent across different instruments, operators, or laboratories.
Materials and Reagents:
- Homogenized, centrally prepared and aliquoted environmental sample (e.g., effluent wastewater, surface water).
- Identical protocol and list of internal standards sent to all participating parties.
Procedure:
- Method Standardization: Provide a detailed, step-by-step Standard Operating Procedure (SOP) covering sample preparation, instrument method, and data processing parameters to all operators/labs [52] [53].
- Sample Distribution: Distribute identical aliquots of the test sample and internal standard mixture to at least three different operators, instruments, or laboratories.
- Independent Analysis: Each participant follows the SOP to prepare and analyze the sample using their local HRMS system.
- Centralized Data Processing: Collect all raw data files and process them centrally using a harmonized workflow (e.g., using the open-source platform PatRoon or InSpectra [51]) to eliminate software-induced variability.
- Data Comparison and Metrics: Compare the resulting feature lists. Calculate the degree of overlap and the intensity correlation for common features. A successful inter-laboratory study should show >70% overlap in detected features among all participants for a complex water sample.
Troubleshooting Tips:
- Low feature overlap: Investigate differences in instrument sensitivity, LC column performance, or data processing settings. Re-evaluate the SOP for clarity.
- Systematic intensity bias: This may indicate issues with internal standard addition or calibration in one of the systems.
The Scientist's Toolkit: Essential Reagents and Materials
Table 2: Key Research Reagent Solutions for NTS-HRMS Quality Assurance
| Item | Function / Rationale |
|---|---|
| Stable Isotope-Labeled Internal Standards | Correct for matrix effects and instrument variability; essential for reliable quantification and inter-batch comparisons [51]. |
| Certified Reference Materials (CRMs) | Validate method accuracy and assess reproducibility across different laboratories by providing a material with known chemical composition. |
| LC-MS Grade Solvents | Minimize chemical noise and background interference, which is critical for detecting low-abundance features in complex environmental matrices. |
| Pooled Quality Control (QC) Sample | Monitors system stability and performance over time; used to apply repeatability filters to the dataset [51]. |
| Procedural Blanks | Identify and subtract contamination introduced during sample preparation and analysis, reducing false positives. |
Workflow Visualization and Data Presentation
The following diagram illustrates the integrated strategies for achieving repeatability and reproducibility throughout the NTS workflow.
NTS Data Quality Assurance Workflow: The diagram outlines key stages (white nodes) with specific quality assurance strategies (green nodes) integrated at each step to ensure repeatability and reproducibility.
Quantitative Data Quality Metrics
Establishing predefined thresholds for key metrics is essential for objective data quality assessment.
Table 3: Key Quantitative Metrics for Data Quality Assessment in NTS
| Metric | Target Value | Application | Impact on Data Quality |
|---|---|---|---|
| Mass Accuracy | < 2 ppm | All detected features | High confidence in molecular formula assignment [51]. |
| Retention Time Stability | CV < 0.5% (within sequence) | Quality Control replicates | Confirms chromatographic repeatability; essential for peak alignment. |
| Feature Intensity Stability (in QC) | CV < 20-30% | Quality Control replicates | Measures analytical repeatability; filters out unreliable features [51]. |
| Signal-to-Noise Ratio | > 5 : 1 | All reported features | Distinguishes true analytical signals from background noise. |
| Blank Contamination | < 20% of sample intensity | Feature table | Flags and removes potential contaminants from reagents or equipment. |
Ensuring data quality through rigorous strategies for repeatability and reproducibility is not merely a best practice but a fundamental requirement for credible NTS research. By implementing the described protocols—incorporating systematic quality control samples, standardized procedures, robust data filtering, and comprehensive metadata reporting—researchers can significantly enhance the reliability of their findings. This disciplined approach transforms NTS from an exploratory tool into a robust methodology capable of supporting informed environmental risk assessment and sound regulatory decision-making.
In the analysis of environmental samples using high-resolution mass spectrometry (HRMS), non-target screening (NTS) aims to identify unknown chemicals of emerging concern (CECs) without a predefined list of analytes [1]. A central challenge in NTS is the management of false positives (incorrectly identifying a feature as a specific compound) and false negatives (failing to identify a compound that is present) [22] [54]. This application note provides a structured framework and detailed protocols to enhance confidence in compound identification, minimizing these errors to improve the reliability of environmental risk assessments.
A Prioritization Framework for Confident Identification
Effective management of false positives and negatives requires a strategic workflow to prioritize features from thousands of candidates. The following integrated framework of seven prioritization strategies enables a stepwise reduction of a complex dataset to a shortlist of high-confidence, high-relevance compounds [4] [10] [28].
Table 1: Seven Prioritization Strategies for Non-Target Screening
| Strategy Number | Strategy Name | Primary Function | Key Tools/Metrics | Impact on False Positives/Negatives |
|---|---|---|---|---|
| P1 | Target & Suspect Screening [4] | Identify known/suspected compounds using reference libraries | Reference databases (e.g., NORMAN, PubChemLite), m/z, RT, MS/MS spectra [4] | Reduces false positives via high-confidence matching; can yield false negatives if compound not in database |
| P2 | Data Quality Filtering [4] | Apply quality control to reduce noise and unreliable signals | Blank subtraction, replicate consistency, peak shape, instrument drift [4] | Foundational reduction of false positives from analytical artifacts |
| P3 | Chemistry-Driven Prioritization [4] | Prioritize specific compound classes using HRMS data properties | Mass defect filtering, homologue series, isotope patterns, diagnostic fragments [4] | Reduces false negatives for specific compound classes (e.g., PFAS, TPs) |
| P4 | Process-Driven Prioritization [4] | Identify key features via spatial, temporal, or process-based comparisons | Influent vs. effluent, upstream vs. downstream, correlation with operational events [4] | Highlights features with environmental relevance, reducing false positive risk |
| P5 | Effect-Directed Prioritization [10] | Link chemical features to biological effects | Effect-Directed Analysis (EDA), Virtual EDA (vEDA), bioassay data [4] | Focuses on toxicologically relevant compounds, reducing false positives in risk context |
| P6 | Prediction-Based Prioritization [28] | Estimate risk or concentration using models | QSPR, machine learning, MS2Quant, MS2Tox, Risk Quotients (PEC/PNEC) [4] | Prioritizes high-risk features without full identification, managing identification workload |
| P7 | Pixel- or Tile-Based Analysis [4] | Pinpoint regions of interest in complex chromatographic data before peak detection | Variance analysis, diagnostic power in 2D data (GC×GC, LC×LC) [4] | Reduces false negatives in early data exploration by analyzing entire chromatographic image |
The following workflow diagram illustrates how these strategies can be integrated into a coherent NTS process to systematically build identification confidence.
NTS Prioritization Workflow: This diagram shows the sequential application of prioritization strategies to reduce feature list from thousands to a manageable number of high-confidence candidates [4] [10].
Quantitative Confidence Scoring in Identification
To move from prioritization to confirmed identification, a transparent scoring system is essential. The confidence score is a numerical representation of the probability of a false-positive identification [55].
Table 2: Confidence Scoring System for NTS Identification
| Confidence Level | Description | Required Evidence | Implied False Positive Probability | Typical Actions |
|---|---|---|---|---|
| Level 1Confirmed structure | Unequivocal identification | Reference standard match on RT and MS/MS spectrum [22] | ~0 [55] | Regulatory decision, definitive risk assessment |
| Level 2Probable structure | Library spectrum match or diagnostic evidence | Suspect list match with MS/MS library spectrum or diagnostic evidence (e.g., fragmentation, isotope pattern) [22] | Low (<0.05) [55] | Prioritization for confirmation, preliminary risk assessment |
| Level 3Tentative candidate | Possible structure(s) proposed | Molecular formula match from accurate mass, possible structure from database [22] | Medium | Further investigation needed, use with caution |
| Level 4Unambiguous formula | Confirmed molecular formula | Accurate mass, isotope pattern, adduct formation [22] | High | Component tracking, hazard screening based on formula |
| Level 5Mass signal | Detected feature of interest | Accurate mass only [22] | Very High | Prioritization for further investigation |
The confidence score can be understood as Confidence Score = 1 - False Positive Probability [55]. For example, a confidence score of 0.95 indicates a 5% probability of a false positive. This quantitative approach allows researchers to set thresholds for decision-making, such as requiring a confidence score above 0.95 for regulatory reporting [55].
Detailed Experimental Protocols
Protocol: Data Quality Filtering (P2) to Reduce False Positives
Principle: Remove analytical artifacts and unreliable signals before identification [4].
Procedure:
- Blank Subtraction: Remove any feature detected in procedural blanks with an intensity ≥ 10% of the sample intensity [4].
- Replicate Consistency: Retain only features present in at least two-thirds of analytical replicates (for n≥3) [4].
- Peak Shape Assessment: Apply a minimum peak width threshold and remove features with a symmetry factor < 0.8 or > 2.0.
- Intensity Threshold: Set a signal-to-noise (S/N) ratio threshold, typically S/N > 10, to eliminate low-abundance noise [4].
Deliverable: A cleaned feature list with improved reliability for subsequent identification steps.
Protocol: Effect-Directed Prioritization (P5) via Virtual EDA
Principle: Statistically link chemical features to biological effects to focus on toxicologically relevant compounds, reducing false positives in a risk context [4].
Procedure:
- Data Collection: Acquire HRMS data and corresponding bioassay data (e.g., cytotoxicity, estrogenicity) for a sample set representing different conditions.
- Statistical Modeling: Use multivariate statistics, such as Partial Least Squares Discriminant Analysis (PLS-DA), to model the relationship between the chemical features (X-variables) and the biological effect data (Y-variables) [4].
- Feature Ranking: Rank chemical features based on their Variable Importance in Projection (VIP) scores from the PLS-DA model. Features with a VIP score > 1.5 are considered highly influential on the biological effect.
- Validation: Validate the model using cross-validation and/or a separate test set of samples.
Deliverable: A prioritized list of chemical features statistically linked to adverse biological outcomes.
Protocol: Prediction-Based Prioritization (P6) for Risk Estimation
Principle: Use in silico tools to predict toxicity and exposure, calculating a risk quotient to prioritize features without full identification [4].
Procedure:
- Toxicity Prediction: For a feature with a proposed structure or molecular formula, use tools like MS2Tox to estimate a predicted no-effect concentration (PNEC) from its MS/MS fragmentation pattern [4].
- Exposure Prediction: Use tools like MS2Quant to estimate a predicted environmental concentration (PEC) directly from MS/MS spectra [4].
- Risk Quotient (RQ) Calculation: Calculate RQ as RQ = PEC / PNEC.
- Prioritization: Features with an RQ > 0.1 are prioritized for further identification efforts [4].
Deliverable: A risk-based ranking of unidentified features, ensuring resources are allocated to compounds with the highest potential environmental impact.
The Scientist's Toolkit: Essential Research Reagents & Materials
Table 3: Key Reagents and Software for Confident NTS Identification
| Item Category | Specific Examples | Function in NTS Workflow |
|---|---|---|
| Reference Databases | NORMAN Suspect List Exchange, US EPA CompTox Chemicals Dashboard, PubChemLite [4] | Provides known and suspected compound information for suspect screening (P1) and structure proposal [1] |
| MS/MS Spectral Libraries | MassBank, mzCloud, NIST Tandem Mass Spectral Library | Confirms compound identity by matching experimental fragmentation patterns (Level 1-2 confidence) [22] |
| Data Processing Software | patRoon [22], XCMS, MS-DIAL | Performs peak picking, alignment, and compound annotation for feature table creation |
| Quantitative Structure-Activity Relationship (QSAR) Tools | MS2Tox [4] [10], OECD QSAR Toolbox | Predicts toxicity from structure or MS/MS spectra for prediction-based prioritization (P6) [4] |
| Retention Time Predictors | Quantitative Structure-Retention Relationship (QSRR) models, Log P predictors | Provides additional orthogonal evidence to support identification and reduce false positives [22] |
| Chemical Standards | Stable isotope-labeled internal standards, authentic chemical standards | Confirms identity and retention time for Level 1 identification; used for quantification [22] |
Managing false positives and negatives is not about eliminating uncertainty, but about quantifying and controlling it through a structured framework. The integration of the seven prioritization strategies outlined here—from data quality control to effect-based and prediction-based filtering—enables a defensible, stepwise approach to confident identification in NTS. By adopting this framework and its associated protocols, researchers can focus their identification efforts more efficiently, leading to more reliable environmental monitoring and a stronger foundation for regulatory decision-making.
In the analysis of complex environmental samples using high-resolution mass spectrometry (HRMS), two persistent analytical challenges are the presence of isomeric compounds and chromatographic co-elution. Isomers, compounds with identical molecular formulas but distinct atomic arrangements, possess the same exact mass, rendering them indistinguishable by HRMS alone [16]. Concurrently, chromatographic co-elution occurs when two or more compounds in a sample have such similar chromatographic properties that they do not separate and reach the detector simultaneously [56]. These phenomena present significant obstacles for accurate compound identification and quantification in non-target screening (NTS) workflows for environmental pollutants, potentially leading to misrepresentation of contaminant profiles and flawed risk assessments.
This application note details integrated methodologies to overcome these challenges, with protocols designed for researchers and scientists engaged in environmental analysis and drug development. By leveraging advanced chromatographic techniques and fragmentation pattern analysis, we demonstrate workflows that enhance the separation and confident identification of previously unresolved compounds, thereby strengthening the reliability of NTS data for regulatory environmental monitoring [1] [57].
Theoretical Background and Key Challenges
The Fundamental Problem of Co-elution and Isomers
Chromatographic co-elution fundamentally arises from insufficient separation resolution between compounds with highly similar physicochemical properties under the given analytical conditions [56]. In environmental NTS, where samples may contain thousands of organic contaminants at trace concentrations, complete chromatographic resolution of all components is often impossible to achieve within a practical analysis time [58]. This co-elution can lead to suppressed ionization, mass spectral interferences, and ultimately, inaccurate identification or missed detections of potentially hazardous substances [58].
Isomeric compounds present a distinct challenge because they share not only the same mass but also often exhibit very similar fragmentation patterns, making them difficult to differentiate even with MS/MS capabilities. This is particularly problematic in environmental analysis where isomeric contaminants may exhibit vastly different toxicological profiles despite their structural similarity [16].
The Complementary Roles of Separation and Fragmentation
Effective resolution of these challenges requires a synergistic approach that maximizes both separation power and informational content from mass spectrometry. While enhanced chromatography aims to physically separate compounds before they reach the mass spectrometer, fragmentation analysis provides a second dimension of differentiation based on structural characteristics.
High-resolution chromatography reduces the complexity of the mixture introduced to the mass spectrometer at any given time, decreasing spectral complexity and minimizing ion suppression effects. When complete separation is unattainable, tandem mass spectrometry provides critical structural information through controlled fragmentation patterns that can distinguish between co-eluting species or isomeric compounds [57] [59]. The integration of these two domains creates a powerful framework for confident compound identification in complex matrices.
Computational Approaches for Peak Deconvolution
When physical separation of co-eluting compounds proves insufficient, computational peak deconvolution methods offer powerful alternatives for extracting individual compound information from convoluted chromatographic data. These approaches are particularly valuable for large-scale environmental studies involving numerous samples, where re-analysis with modified chromatographic methods may be impractical [58].
Clustering-Based Peak Separation
Method Principle: This approach uses shape similarity metrics to group and separate overlapping peaks based on their chromatographic profiles across multiple samples [58].
Workflow:
- Data Preprocessing: Normalize data by sample mass, remove baseline drift, and align retention times across all chromatograms
- Peak Detection: Identify regions of interest containing potential co-elution
- Shape-Based Clustering: Apply hierarchical clustering with bootstrap resampling to group similar peak shapes
- Peak Assignment: Reconstruct individual compound peaks by joining clusters across different chromatograms
Advantages: Does not require pre-defined peak models; effectively handles natural variations in peak shapes across biological replicates [58].
Functional Principal Component Analysis (FPCA)
Method Principle: FPCA represents chromatographic peaks as mathematical functions and detects sub-peaks with the greatest variability across samples, providing a multidimensional representation of overlapping compounds [58].
Workflow:
- Functional Representation: Convert discrete chromatographic data into continuous functions using B-spline basis functions
- Variance Decomposition: Apply FPCA to identify principal components that explain the majority of peak shape variability
- Component Extraction: Isolate individual compound signals based on their distinctive functional signatures
- Quantification: Generate area-under-curve measurements for each resolved component
Unique Advantage: FPCA specifically preserves and highlights differences between experimental variants (e.g., contaminated vs. reference sites), making it particularly valuable for comparative environmental metabolomics [58].
Table 1: Comparison of Computational Peak Deconvolution Methods
| Method | Key Principle | Data Requirements | Primary Advantages | Limitations |
|---|---|---|---|---|
| Clustering-Based | Shape similarity grouping across chromatograms | Multiple sample replicates (≥10 recommended) | No prior peak model assumptions; handles natural shape variation | Requires sufficient replicates for robust clustering |
| Functional PCA | Decomposition of peak variability using functional data analysis | Multiple sample replicates (≥10 recommended) | Highlights biologically relevant variations; optimal for comparative studies | Complex implementation; requires specialized statistical expertise |
| Exponentially Modified Gaussian (EMG) Fitting | Nonlinear curve fitting with parametric peak models | Can be applied to single chromatograms | Well-established model; works with limited replicates | Assumes specific peak shape; may not fit all chromatographic behaviors |
Experimental Protocols
Protocol 1: Enhanced Chromatographic Separation for Complex Environmental Samples
This protocol describes method development for maximizing chromatographic resolution of isomers and co-eluting compounds in environmental water samples.
Materials and Reagents:
- LC-MS grade water, methanol, and acetonitrile
- Ammonium formate or ammonium acetate (for LC-MS mobile phase additives)
- Representative environmental sample (e.g., surface water, wastewater effluent)
- Mixed isomer reference standards relevant to study targets (e.g., halogenated contaminants, pharmaceutical isomers)
Chromatographic System Setup:
- Column Selection: Employ orthogonal stationary phases for method development:
- Primary: C18 column (2.1 × 100 mm, 1.7-1.8 μm particle size) for reverse-phase separation
- Secondary: Phenyl-hexyl or pentafluorophenyl (PFP) column for alternative selectivity toward aromatic and isomeric compounds
- Mobile Phase Optimization:
- Test different pH modifiers (formic acid, acetic acid, ammonium formate buffer) to influence ionization and separation
- Evaluate organic modifier ratios (methanol vs. acetonitrile) to alter selectivity
- Implement shallow gradient methods (e.g., 5-95% organic over 30-60 minutes) to enhance resolution of complex mixtures
- Temperature Control: Test column temperatures between 30-60°C to optimize separation efficiency
Method Validation:
- Resolution Assessment: Analyze mixed isomer standards to confirm baseline separation
- Matrix Effects Evaluation: Compare standards in solvent vs. matrix-matched samples to identify retention time shifts
- Reproducibility Verification: Perform replicate injections (n=5) to ensure consistent retention times (RSD < 0.5%)
Protocol 2: MS/MS Fragmentation Pattern Analysis for Isomer Differentiation
This protocol establishes a systematic approach for acquiring and interpreting fragmentation spectra to distinguish isomeric compounds that co-elute or have identical retention times.
Instrumentation and Parameters:
- High-resolution mass spectrometer (Orbitrap or Q-TOF) coupled with LC system
- Data-dependent acquisition (DDA) or data-independent acquisition (DIA) modes
- Collision energies: Stepped mode (e.g., 20, 40, 60 eV) to generate comprehensive fragmentation patterns
Fragmentation Data Acquisition:
- Targeted MS/MS: For suspected isomers identified in initial screening, isolate precursor ions with 1-2 m/z isolation window
- Fragmentation Optimization:
- Adjust collision energy to generate 3-10 characteristic fragment ions
- Ensure minimal remnant of precursor ion intensity (5-20%)
- Spectral Quality Control:
- Acquire minimum of 5-10 scans per peak for reliable spectral interpretation
- Maintain mass accuracy < 5 ppm for all significant fragments
Data Interpretation Workflow:
- Fragment Identification: Using high-resolution accurate mass data, assign potential chemical formulas to all significant product ions
- Fragmentation Pathway Elucidation: Propose rational fragmentation pathways explaining formation of product ions from precursor
- Isomer Differentiation: Identify characteristic fragment ions unique to each isomer structure
- Spectral Library Comparison: Match against empirical or in-silico spectral libraries when available [57]
Application Example - Ketamine Analogues: The systematic study of ketamine analogues demonstrates how fragmentation patterns can differentiate structurally similar compounds. Characteristic fragmentation pathways included α-cleavage adjacent to the cyclohexanone moiety and subsequent losses of small neutral molecules (CO, methyl radical) that varied with different ring substituents [59].
Protocol 3: Integrated Chromatographic and Computational Deconvolution
This protocol combines slight chromatographic modifications with computational approaches to resolve co-elutions without requiring complete physical separation.
Sample Preparation and Analysis:
- Sample Collection: Process sufficient environmental replicates (≥10) to support statistical deconvolution
- Chromatographic Analysis: Employ a moderately resolving method that partially separates co-eluting compounds of interest
- Data Acquisition: Ensure consistent retention time alignment across all samples through quality control measures
Computational Analysis:
- Data Preprocessing:
- Normalize chromatograms by internal standard or total ion count
- Apply retention time alignment algorithm to correct for shifts between runs
- Remove baseline using asymmetric least squares or similar algorithm
- Peak Detection: Identify regions of interest containing potential co-elution
- Deconvolution Implementation:
- Option A (Clustering): Apply hierarchical clustering with 1000 bootstrap samples to identify consistent peak groupings
- Option B (FPCA): Implement functional principal component analysis using 6 B-spline basis functions of order 3
- Validation: Compare deconvolution results with reference standards when available, or cross-validate with orthogonal analytical methods
The Scientist's Toolkit: Essential Research Reagents and Materials
Table 2: Key Research Reagent Solutions for Isomer and Co-elution Analysis
| Item | Function/Application | Example Specifications |
|---|---|---|
| LC-MS Grade Solvents | Mobile phase preparation; sample reconstitution | Water, methanol, acetonitrile with low volatile impurities |
| Chromatography Columns | Stationary phases with orthogonal selectivity for challenging separations | C18, phenyl-hexyl, pentafluorophenyl (PFP), HILIC; 2.1mm diameter, sub-2μm particles |
| Mobile Phase Additives | Modulate separation selectivity and ionization efficiency | Ammonium formate/acétate, formic acid, acetic acid; LC-MS grade purity |
| Isomer Reference Standards | Method development and validation for target isomers | Authentic chemical standards of isomeric compounds relevant to study |
| Retention Time Index Markers | Alignment and calibration of retention time scales | Homologous series (e.g., alkyl ketones, PFAS) or stable isotope-labeled internal standards |
| In-silico Fragmentation Tools | Prediction of MS/MS spectra for structure annotation | MetFrag, CFM-ID, MS-FINDER software platforms |
| Computational Deconvolution Software | Mathematical resolution of co-eluting peaks | XCMS, CAMERA, or custom R/Python scripts implementing FPCA or clustering algorithms |
Workflow Visualization
Effective management of chromatographic co-elution and isomeric compounds is essential for advancing non-target screening applications in environmental monitoring [1]. The integrated strategies presented in this application note—combining enhanced chromatographic separation, tandem mass spectrometry, and computational deconvolution—provide a robust framework for overcoming these analytical challenges.
As environmental NTS continues to transition from research toward regulatory applications [60], the development of harmonized protocols, standardized data reporting, and open-access spectral libraries will be critical for establishing confidence in these methodologies [1]. The workflows described here offer practical pathways for researchers to improve compound identification confidence, ultimately supporting more comprehensive assessment of chemical contaminants in environmental systems.
Non-target screening (NTS) using high-resolution mass spectrometry (HRMS) has become fundamental for detecting and identifying chemicals of emerging concern (CECs) in complex environmental samples [4] [10]. A single HRMS analysis can generate thousands of analytical features and terabytes of raw data, creating a significant bottleneck at the identification and interpretation stage [4] [61]. Without efficient strategies for data storage, sharing, and retrospective analysis, valuable information remains underutilized. This application note outlines integrated platforms and protocols that enable researchers to transform this data deluge into actionable knowledge for environmental monitoring and chemical risk assessment.
Data Storage Infrastructure and Archiving Strategies
Federated Data Infrastructure
A federated European infrastructure storing raw non-target screening data converted into a common open format allows for 'on demand' accessibility for retrospective screening [61]. This approach addresses the critical challenge of data harmonization across different laboratories and instruments. The key advantage of HRMS data compared to low resolution MS/MS data is that a "digital archive" of full scan HRMS analyses and HRMS/MS spectra can be exploited retrospectively as new concerns about specific substances emerge or when new knowledge becomes available [1].
The NORMAN Digital Sample Freezing Platform (DSFP)
The NORMAN Digital Sample Freezing Platform (DSFP) represents a pioneering approach to environmental HRMS data storage [61]. Established in 2017 with the ambition of becoming a European and possibly global standard for retrospective suspect screening of environmental pollutants, this platform enables a quick and effective overview of the potential presence of thousands of substances across a large number of samples and different matrices [61]. A tool for semi-quantitative estimation of concentrations of any detected compound based on their structure similarity is being tested within this platform.
Table 1: Key Platforms for HRMS Data Storage and Sharing in Environmental Research
| Platform Name | Primary Function | Key Features | Data Capacity |
|---|---|---|---|
| NORMAN DSFP | Retrospective screening archive | Digital sample freezing; suspect screening across multiple matrices | Designed for large-scale environmental datasets |
| NORMAN Database System | Centralized data repository | Contains wide-scope target and non-target screening data; integrated with Suspect List Exchange | >40,000 suspect substances |
| NORMAN MassBank | Spectral library | MS/MS spectra for substance identification | 57,472 unique mass spectra of 14,667 substances (as of 2019) |
| US EPA CompTox Chemicals Dashboard | Chemical reference database | Chemical properties, toxicity data, and links to environmental fate | >875,000 chemicals |
Data Sharing and Exchange Frameworks
Standardized Data Exchange Protocols
Effective data sharing requires harmonized formats and standardized protocols. Collaborative trials organized by the NORMAN network on environmental samples have revealed that suspect screening using specific lists of chemicals to find "known unknowns" is a very common and efficient way to expedite non-target screening [61]. As a result, the NORMAN Suspect List Exchange (SLE) was established, encouraging members to submit their suspect lists with over 40,000 substances currently available in the correspondingly merged SusDat database [61]. The curation is performed within the network using open-access cheminformatics toolkits, ensuring data quality and interoperability.
Harmonized Identification Systems
Neither CAS numbers nor chemical names serve as sufficiently unique identifiers for compounds of interest in environmental screening [61]. The US EPA CompTox Chemicals Dashboard has emerged as a reference for extracting quality-checked information, while the NORMAN network and SOLUTIONS project have pooled resources in curating and uploading substance lists to the Dashboard [61]. This collaboration has significantly improved the interoperability of chemical data across different research communities and platforms.
Retrospective Analysis Platforms and Workflows
Workflow for Retrospective Data Analysis
The following diagram illustrates the integrated workflow for retrospective analysis of HRMS data in environmental monitoring:
Retrospective Screening Implementation
Retrospective screening enables re-analysis of existing data for newly identified contaminants without repeating laboratory analyses [1]. The NORMAN network has demonstrated the effectiveness of this approach through a pilot study establishing a global emerging contaminant early warning network, in which eight reference laboratories with available archived HRMS data retrospectively screened data acquired from aqueous environmental samples collected in 14 countries on 3 different continents [61]. This capability is particularly valuable for assessing the spatial and temporal distribution of contaminants of emerging concern.
Experimental Protocols for Efficient Data Management
Protocol 1: Data Acquisition and Archiving for Retrospective Analysis
Purpose: To ensure HRMS data is collected and stored in formats suitable for future retrospective analysis.
Materials:
- High-resolution mass spectrometer (LC-HRMS or GC-HRMS)
- Data conversion software (vendor-specific and open format tools)
- Secure storage infrastructure with adequate capacity
Procedure:
- Acquire full-scan HRMS data with positive and negative ionization modes
- Collect MS/MS fragmentation data using data-dependent or data-independent acquisition
- Convert raw data to open formats (e.g., mzML) alongside vendor proprietary formats
- Embed comprehensive metadata including sampling information, sample preparation details, and instrumental parameters
- Upload data to the NORMAN DSFP or similar institutional repositories
- Perform quality control checks to ensure data integrity and accessibility
Quality Control: Regular verification of data accessibility and integrity through test queries and sample extractions.
Protocol 2: Retrospective Suspect Screening Workflow
Purpose: To identify previously undetected compounds in archived HRMS data using updated suspect lists.
Materials:
- Archived HRMS data in accessible format
- Curated suspect lists (e.g., from NORMAN Suspect List Exchange)
- Data processing software (e.g., with SIRIUS, CSI:FingerID integration)
Procedure:
- Query digital archive for specific mass-to-charge ratios based on updated suspect lists
- Apply mass defect filtering to identify compound classes of interest
- Use isotope patterns and fragmentation spectra for tentative identification
- Apply prioritization strategies to focus on features with highest environmental relevance
- Confirm identifications using reference standards when available
- Document results in standardized reporting formats
Table 2: Essential Research Reagents and Computational Tools for HRMS Data Management
| Tool/Category | Specific Examples | Function in HRMS Data Management |
|---|---|---|
| Suspect Screening Databases | NORMAN Suspect List Exchange, US EPA CompTox Dashboard | Provide curated chemical lists for retrospective screening |
| Spectral Libraries | NORMAN MassBank, MassBank EU | Enable compound identification via spectral matching |
| Data Processing Tools | SIRIUS, CSI:FingerID, MLinvitroTox | Facilitate molecular fingerprint prediction and toxicity estimation |
| Toxicity Prediction | ToxCast, Tox21, invitroDB | Enable hazard-based prioritization of features |
| Chemical Structure Databases | PubChemLite, SusDat | Provide structural information for compound identification |
Protocol 3: Hazard-Driven Prioritization Using Machine Learning
Purpose: To prioritize unidentified HRMS features based on potential toxicity using computational approaches.
Materials:
- HRMS/MS data with fragmentation spectra
- Machine learning framework (e.g., MLinvitroTox)
- Toxicity databases (ToxCast/Tox21)
Procedure:
- Extract MS/MS spectra for unidentified features
- Generate molecular fingerprints using SIRIUS/CSI:FingerID
- Apply pre-trained machine learning models (e.g., xgboost with SMOTE) to predict toxicity
- Classify features as toxic/nontoxic based on nearly 400 target-specific and over 100 cytotoxic endpoints
- Prioritize features with highest predicted toxicity for further identification
- Validate predictions with experimental bioassays for selected high-priority compounds
Integration with Regulatory Monitoring and Decision Support
The implementation of efficient data storage, sharing, and retrospective analysis platforms directly supports regulatory environmental monitoring and chemicals management [1]. These approaches can improve the identification of problematic substances on local, regional, and EU-wide levels, supporting regulatory processes in environmental and chemical legislation such as the Water Framework Directive, the Marine Strategy Framework Directive, and the REACH Regulation [1]. The International Commission for the Protection of the River Rhine (ICPR) has demonstrated the practical application of these approaches, working towards harmonizing data acquisition and data exchange protocols and establishing automated data evaluation workflows for samples along the river [1].
Effective management of big data in environmental HRMS research requires integrated platforms for data storage, sharing, and retrospective analysis. The protocols and platforms described herein provide a framework for maximizing the value of HRMS data beyond initial analysis, enabling the scientific community to keep pace with the rapidly expanding "chemical universe" in our environment. By implementing these strategies, researchers and regulatory bodies can transform data bottlenecks into opportunities for discovery and evidence-based decision-making in environmental protection.
In the field of environmental analytical chemistry, non-target screening (NTS) using chromatography coupled to high-resolution mass spectrometry (HRMS) has become indispensable for detecting and identifying chemicals of emerging concern (CECs) [4] [10]. The power of this approach brings a significant challenge: the generation of thousands of analytical features per sample, creating a major bottleneck at the identification stage [4]. Without effective strategies to manage this complexity, laboratories risk wasting valuable resources on uninformative signals or, worse, arriving at conclusions that cannot be compared or validated across studies or laboratories.
This article addresses these challenges by presenting a structured framework for implementing harmonization and standardization in NTS workflows. Harmonization involves minimizing redundant or conflicting standards while retaining critical requirements, whereas standardization moves toward implementing a single, unified approach [62]. For NTS, this means establishing common procedures, data quality benchmarks, and prioritization strategies that enable laboratories to focus their identification efforts on the most environmentally relevant compounds, thereby strengthening environmental risk assessment and accelerating regulatory decision-making [4] [10].
The Critical Need for Harmonized Prioritization Strategies
The expansion of the anthropogenic environmental chemical space due to industrial activity and diverse consumer products has made NTS essential for comprehensive environmental monitoring [4]. The fundamental challenge lies in the data density of NTS; a single sample can yield thousands of detected features (mass-to-charge ratio, retention time pairs), far exceeding the capacity for complete identification [4].
This identification bottleneck represents more than just a resource allocation problem. Inconsistent prioritization of features across different laboratories can lead to incomparable datasets and conflicting conclusions about environmental risk. A harmonized approach ensures that different laboratories focus on the same high-priority compounds, enabling data comparison across temporal and spatial studies [10]. The integration of multiple prioritization strategies allows for a stepwise reduction from thousands of features to a focused shortlist of compounds worthy of further investigation [4].
Table 1: Seven Core Prioritization Strategies for NTS Workflows
| Strategy | Primary Function | Key Tools/Approaches |
|---|---|---|
| Target and Suspect Screening (P1) | Identifies known or suspected compounds | Predefined databases (PubChemLite, CompTox Dashboard, NORMAN Suspect List Exchange) [4] |
| Data Quality Filtering (P2) | Removes artifacts and unreliable signals | Blank subtraction, replicate consistency, peak shape evaluation [4] |
| Chemistry-Driven Prioritization (P3) | Flags specific compound classes | Mass defect filtering, homologue series detection, halogenation patterns [4] |
| Process-Driven Prioritization (P4) | Highlights features relevant to processes | Spatial/temporal comparison, correlation with operational changes [4] |
| Effect-Directed Prioritization (P5) | Links features to biological effects | Effect-Directed Analysis (EDA), Virtual EDA (vEDA) [4] [63] |
| Prediction-Based Prioritization (P6) | Ranks by predicted risk | MS2Quant, MS2Tox, predicted risk quotients [4] |
| Pixel/Tile-Based Analysis (P7) | Localizes regions of interest in complex datasets | Pixel-based (GC×GC) or tile-based (LC×LC) variance analysis [4] |
Implementing an Integrated NTS Workflow
A Tutorial Framework for Strategic Prioritization
A harmonized NTS workflow requires the thoughtful integration of the seven prioritization strategies, typically applied in a sequential manner to progressively reduce dataset complexity [10]. This integrated approach transforms an overwhelming list of features into a manageable number of high-priority candidates for identification.
The process often begins with Target and Suspect Screening (P1), which uses predefined databases to quickly identify known contaminants, potentially flagging 20-30% of features as identifiable without further effort [4]. This is followed by Data Quality Filtering (P2), a foundational step that removes analytical artifacts, background contamination, and unreliable signals based on their occurrence in blanks and replicate consistency [4] [10].
Chemistry-Driven Prioritization (P3) then applies rules based on chemical intelligence, such as mass defect filtering to identify halogenated compounds like per- and polyfluoroalkyl substances (PFAS) or searching for homologue series and diagnostic fragments that suggest transformation products [4]. Process-Driven Prioritization (P4) leverages the study design, comparing samples across spatial gradients (upstream vs. downstream), temporal series, or technical processes (influent vs. effluent) to highlight features associated with specific processes of interest [4].
The most toxicologically relevant compounds are identified through Effect-Directed Prioritization (P5), which combines biological response data with chemical analysis [63]. Traditional Effect-Directed Analysis (EDA) fractionates samples and tests fractions for bioactivity before chemical analysis, while Virtual EDA (vEDA) uses statistical models to link chemical features to biological endpoints across multiple samples [4]. For unidentified features, Prediction-Based Prioritization (P6) uses quantitative structure-property relationships and machine learning to estimate concentrations and toxicities, enabling risk-based ranking even without complete identification [4] [10].
For particularly complex datasets, especially from comprehensive two-dimensional chromatography, Pixel- or Tile-Based Approaches (P7) can localize regions of high variance or diagnostic power before traditional peak detection, making data analysis more computationally tractable [4].
Workflow Visualization
The following diagram illustrates the logical flow and integration of these seven prioritization strategies within a harmonized NTS workflow:
Diagram 1: Integrated prioritization workflow for non-target screening. Strategies are applied sequentially to reduce feature complexity. P7 can be applied early for 2D chromatographic data.
Protocols for Harmonized NTS Implementation
Protocol 1: Implementing Quality Control-Benchmarked Analysis
Adapted from successful proteotype harmonization studies in multi-center cancer research, this protocol establishes a quality control (QC) framework to ensure reproducible and comparable NTS data generation across laboratories [64].
Principle: System suitability testing using benchmarked standards and standardized QC routines maximizes data accessibility and empowers collaborative science initiatives [64].
Materials:
- QC Standard: Commercially available peptide digest or well-characterized environmental extract
- LC-HRMS System: Ultra-high-performance liquid chromatography coupled to high-resolution mass spectrometer
- Data Acquisition: Standardized HRMS1-DIA method with decoupled MS1 and MS2 scan events
- Analysis Software: Spectronaut or equivalent platform with centrally prepared spectral libraries
Procedure:
- System Qualification:
- Analyze QC standard using the standardized HRMS1-DIA method
- Establish baseline performance metrics from reference laboratories
- Monitor key parameters: median LC elution peak width, MS1/MS2 data points per peak, total precursors identified, inter-injection coefficient of variation (CV)
Performance Monitoring:
- Perform triplicate analysis of QC standard before sample batch
- Compare results against established acceptance criteria
- Trigger troubleshooting procedures if metrics deviate from baseline
Sample Analysis:
- Apply identical LC gradients and mobile phases across all laboratories
- Use standardized data acquisition parameters (e.g., 60-minute capillary flow LC gradient at 1.2 µL/min)
- Maintain consistent MS resolution settings (e.g., 120k for MS1, 30k for MS2)
Data Processing:
- Utilize centrally constructed spectral libraries for consistent identification
- Apply uniform normalization procedures across all datasets
- Conduct centralized data analysis to minimize inter-laboratory processing variation
Table 2: Quality Control Metrics for System Suitability Testing
| Performance Metric | Acceptance Criterion | Monitoring Frequency |
|---|---|---|
| LC Elution Peak Width | Median < 30 seconds | Each injection |
| MS1 Data Points/Peak | ≥ 9 points | Each injection |
| MS2 Data Points/Peak | ≥ 3 points | Each injection |
| Identified Protein Groups | CV < 15% across replicates | Each batch |
| Precursor Ion Signal | Median CV < 20% | Each batch |
| Retention Time Shift | < 2% over 24 hours | Continuous |
Protocol 2: High-Throughput Effect-Directed Analysis (HT-EDA)
This protocol addresses the integration of biological effect measurement with chemical analysis, traditionally a labor-intensive process, through miniaturization and automation for higher throughput [63].
Principle: Combining microfractionation and downscaled bioassays with automated sample preparation and data processing to accelerate toxicity driver identification in complex environmental mixtures [63].
Materials:
- Fractionation System: High-performance liquid chromatography or high-performance thin-layer chromatography (HPTLC) system
- Bioassay Components: Microplate readers, cell culture systems, enzyme activity assays
- Automation Equipment: Liquid handling robots for sample preparation
- Chemical Analysis: LC-HRMS for fraction characterization
Procedure:
- Sample Preparation:
- Extract environmental samples using standardized protocols
- Perform automated sample cleanup to remove matrix interferents
- Concentrate extracts under gentle nitrogen stream
Microfractionation:
- Separate sample extract using reversed-phase HPLC
- Collect time-based fractions directly into microplates
- Evaporate solvents and reconstitute in bioassay-compatible media
Downscaled Bioassays:
- Transfer aliquots to assay plates using automated liquid handling
- Apply battery of miniaturized bioassays (cytotoxicity, endocrine disruption, oxidative stress)
- Include positive and negative controls in each plate
- Measure endpoint responses using plate readers
Chemical Analysis of Active Fractions:
- Analyze bioactive fractions using LC-HRMS
- Apply non-target screening to identify constituents
- Correlate chemical features with biological activity
Data Integration:
- Use statistical models (e.g., partial least squares discriminant analysis) to link chemical features to effects
- Apply virtual EDA (vEDA) approaches to prioritize features associated with toxicity
Table 3: Key Research Reagent Solutions for NTS Workflows
| Resource Category | Specific Examples | Function in NTS Workflow |
|---|---|---|
| Reference Databases | NORMAN Suspect List Exchange, PubChemLite, US EPA CompTox Dashboard | Provides suspect lists for known and potential environmental contaminants [4] |
| Quality Control Standards | HeLa cell digest, well-characterized environmental extracts | Monitors system performance and enables cross-laboratory comparability [64] |
| Bioassay Systems | Microplate-based cytotoxicity, endocrine disruption assays | Measures biological effects for effect-directed analysis [63] |
| Data Processing Tools | MS2Quant, MS2Tox, Spectronaut | Predicts concentrations and toxicity from MS data; processes DIA datasets [4] [64] |
| Chemical Standards | PFAS mixtures, transformation products, isotope-labeled internal standards | Confirms identifications and quantifies specific compound classes [4] |
The harmonization and standardization of non-target screening workflows represent an essential evolutionary step for environmental analytical chemistry. By implementing the integrated prioritization strategies and standardized protocols outlined in this article, researchers can transform NTS from an exploratory tool into a robust approach capable of generating comparable, reliable data across laboratories and timeframes.
The seven prioritization strategies—from target screening to effect-directed analysis—provide a systematic framework for tackling the complexity of environmental samples, while quality control-benchmarked protocols ensure analytical rigor. As these harmonized approaches become more widely adopted, they will significantly strengthen environmental risk assessment and provide a more solid foundation for regulatory decision-making to protect environmental and human health.
Proving Performance: Validation, Orthogonal Methods, and Comparative Analysis
In the field of environmental analytical chemistry, the adoption of high-resolution mass spectrometry (HRMS) for non-target screening (NTS) represents a paradigm shift for identifying unknown and unexpected pollutants [43]. Unlike targeted methods, which quantify predefined analytes, NTS aims to comprehensively detect any chemical present in a sample, making it particularly valuable for discovering emerging contaminants and transformation products [65]. This powerful capability, however, comes with a significant challenge: establishing universally accepted criteria for assessing method performance, including sensitivity, specificity, and accuracy [65].
The absence of standardized performance criteria remains a primary barrier to the broader regulatory acceptance of NTS data [65]. While targeted methods rely on well-defined performance thresholds, the information-rich, discovery-based nature of NTS generates inherent uncertainties [65]. This article addresses this critical gap by framing performance assessment within the context of a research thesis on HRMS for non-target screening of environmental pollutants. It outlines practical, data-driven strategies and protocols to evaluate performance criteria, ensuring that NTS results are reliable, defensible, and ultimately actionable for environmental decision-making.
Performance Metrics for Non-Targeted Analysis
In targeted analysis, performance metrics are well-established. Specificity describes a method's ability to uniquely distinguish an analyte from interferents, while sensitivity is communicated via the limit of detection (LOD), the lowest concentration at which an analyte can be reliably detected. Accuracy and precision quantify the correctness and reproducibility of measurements, respectively [65]. These metrics provide a foundation for deeming a targeted method fit-for-purpose.
For NTS, these traditional terms take on different meanings due to the inherent uncertainty of the process. Performance must be evaluated relative to the study's primary objective, which generally falls into one of three categories [65]:
- Sample Classification: Discriminating between sample groups based on chemical patterns.
- Chemical Identification: Confidently identifying unknown chemicals.
- Chemical Quantitation: Estimating the concentration of identified unknowns.
The table below summarizes how traditional performance concepts translate into an NTS context for these different objectives.
Table 1: Adapting Traditional Performance Metrics for Non-Targeted Analysis (NTA)
| Traditional Metric | Application in NTA for Sample Classification | Application in NTA for Chemical Identification | Application in NTA for Chemical Quantitation |
|---|---|---|---|
| Sensitivity | Ability to detect compositional differences between sample classes. | Probability that a chemical present in the sample is successfully identified (minimizing false negatives). | The lowest concentration at which a newly identified analyte can be reliably quantified. |
| Specificity | Ability to avoid misclassification of samples. | Probability that an identification is correct for the sample (minimizing false positives). | Ability to quantify an analyte without interference from the sample matrix or co-eluting compounds. |
| Accuracy | The correctness of the classification model's predictions. | The correctness of the structural assignment. | The closeness of the reported concentration to the true value. |
A critical tool for assessing the qualitative performance of an NTS method (for classification and identification) is the confusion matrix, which cross-tabulates predicted results against known truths, allowing for the calculation of metrics like false positive and false negative rates [65].
Integrated Workflow for Method Assessment
Establishing performance criteria is not a single activity but an integrated process that runs parallel to the main NTS workflow. The following diagram illustrates how different assessment strategies are embedded at key stages to ensure data quality and method reliability.
Diagram 1: NTS workflow with assessment checkpoints.
Assessment Checkpoint A: Data Quality Control
The first checkpoint involves foundational quality control (QC) to ensure the analytical system is stable and the raw data are reliable. This includes:
- System Suitability Tests: Using calibration standards and QC reference materials to monitor instrument sensitivity, mass accuracy, and chromatographic performance [66] [67].
- Batch Effect Monitoring: For large studies, incorporating a quality control standard (QCS) throughout the analytical batch is crucial. For instance, a tissue-mimicking QCS (e.g., propranolol in gelatin) can track technical variation due to sample preparation and instrument performance, helping to identify and correct for batch effects [68].
- Data Quality Filtering: This is a key prioritization strategy (P2) that removes analytical artifacts and unreliable signals based on their occurrence in procedural blanks, consistency across replicates, and acceptable peak shape [4].
Assessment Checkpoint B: Performance Calibration
This checkpoint focuses on assessing the method's operational performance. Tools like DO-MS (Data-driven Optimization of MS) can be used to interactively visualize data from all levels of the LC-HRMS analysis [67]. By examining metrics related to chromatography, ion sampling, and peptide identifications, analysts can diagnose problems and optimize performance. Key metrics to track over time include:
- Chromatographic Performance: Retention time stability, peak width, and peak symmetry [66].
- Ion Source Stability: Total ion current (TIC) baseline stability and the absence of significant signal jumps [66].
- Mass Accuracy: The deviation between measured and theoretical m/z values, which should be consistently within a pre-defined tolerance (e.g., < 5 ppm).
Assessment Checkpoint C: Identification Confidence
The final checkpoint ensures the credibility of compound identifications. This involves applying a confidence scoring system and using orthogonal data to support findings.
- Confidence Levels: Align identifications with a standardized scale (e.g., Level 1: Confirmed by reference standard; Level 2: Probable structure based on diagnostic evidence; Level 3: Tentative candidate) [43].
- Effect-Directed Analysis (EDA): This prioritization strategy (P5) links chemical features to a biological effect (e.g., toxicity), providing orthogonal, biologically relevant evidence that supports the environmental significance of an identification [4].
- Prediction-Based Prioritization (P6): Tools like MS2Tox can estimate a compound's toxicity directly from its MS/MS fragmentation pattern, providing a risk-based assessment that can prioritize identifications even without a pure standard [4].
Experimental Protocols for Performance Evaluation
Protocol for Assessing Qualitative Identification Performance
This protocol evaluates an NTS method's ability to correctly identify chemicals present in a sample, addressing sensitivity (minimizing false negatives) and specificity (minimizing false positives) for identification.
1. Materials and Reagents:
- A certified reference material (CRM) or in-house standard mixture containing a defined set of compounds relevant to environmental analysis (e.g., pesticides, pharmaceuticals, PFAS).
- Drug-free urine or synthetic wastewater matrix.
- Appropriate solvents (LC-MS grade water, acetonitrile, methanol).
2. Sample Preparation:
- Prepare a set of calibration standards by spiking the CRM into the blank matrix at a concentration range that covers expected environmental levels (e.g., 0.1 - 100 µg/L).
- Include replicate samples (n=5) at a mid-range concentration to assess reproducibility.
- Include procedural blanks to identify background interference.
3. Instrumental Analysis:
- Analyze all samples using the established LC-HRMS NTS method.
- Ensure data is acquired in a data-dependent acquisition (DDA) or data-independent acquisition (DIA) mode to collect both MS1 and MS/MS spectra.
4. Data Processing and Analysis:
- Process the data through the standard NTS workflow, including peak picking, componentization, and database searching (e.g., against PubChem, CompTox) using MS1 and MS/MS data.
- For each sample, record which compounds from the CRM were successfully identified.
- Construct a confusion matrix for the mid-range replicates, comparing the true presence/absence of each compound against its identified presence/absence.
5. Calculation of Performance Metrics:
- Sensitivity (Recall): (True Positives) / (True Positives + False Negatives)
- Specificity: (True Negatives) / (True Negatives + False Positives)
- Precision: (True Positives) / (True Positives + False Positives)
- Report the average and standard deviation of these metrics across the replicate analyses.
Protocol for Quantifying Matrix Effects and Recovery
Assessing accuracy in NTS often begins with evaluating how the sample matrix affects quantification, a critical step before semi-quantitation can be attempted.
1. Materials and Reagents:
- Blank matrix (e.g., surface water, wastewater effluent).
- Analytical standards for a representative set of target analytes.
- Stable isotope-labeled internal standards (SIL-IS) for each analyte, if available.
- QuEChERS extraction kits or materials (anhydrous MgSO4, NaCl) [69].
2. Sample Preparation:
- Fortify the blank matrix with the target analytes at low, medium, and high concentration levels (e.g., 1, 10, 50 µg/L).
- For each concentration level, prepare two sets of samples (n=3 each):
- Set A (Post-extraction spiking): Extract the blank matrix using the adapted QuEChERS method [69]. Then, spike the analyte standards into the purified extract.
- Set B (Pre-extraction spiking): Spike the analyte standards directly into the blank matrix, then perform the extraction.
- Process a non-fortified blank matrix through the entire procedure to monitor interference.
3. Instrumental Analysis:
- Analyze all samples (Set A, Set B, and blanks) by LC-HRMS.
4. Data Analysis and Calculation:
- For each analyte, construct matrix-matched (from Set B) and solvent-based (from Set A) calibration curves.
- Calculate the Matrix Effect (ME) using the formula:
ME (%) = [(Slope of matrix-matched curve) / (Slope of solvent standard curve) - 1] × 100 [69].
- A negative ME indicates ion suppression; a positive ME indicates ion enhancement.
- Calculate the Extraction Recovery (RE) using the formula: RE (%) = (Peak area of pre-extraction spiked sample / Peak area of post-extraction spiked sample) × 100 [69].
Table 2: Example Results for Matrix Effect and Recovery Evaluation
| Analyte | Spiked Concentration (µg/L) | Matrix Effect (%) | Interpretation | Recovery (%) | Interpretation |
|---|---|---|---|---|---|
| Cocaine | 1.0 | -54.2 | Strong Ion Suppression | 61.3 | Moderate Recovery |
| Cocaine | 10.0 | -50.5 | Strong Ion Suppression | 95.4 | Good Recovery |
| Cocaine | 50.0 | -52.8 | Strong Ion Suppression | 107.7 | Slight Over-recovery |
| Atrazine | 1.0 | +15.5 | Moderate Ion Enhancement | 88.2 | Good Recovery |
The Scientist's Toolkit: Essential Research Reagents and Materials
The following table lists key reagents, standards, and software tools essential for implementing robust NTS methods and their associated performance assessments.
Table 3: Key Reagents and Tools for HRMS Method Assessment
| Item Name | Function/Benefit | Example Use Case |
|---|---|---|
| Stable Isotope-Labeled Internal Standards (SIL-IS) | Corrects for analyte loss during preparation and matrix effects during ionization; improves quantification accuracy [70]. | Added to all samples and calibration standards for normalization in quantitative MSI and LC-MS assays. |
| Certified Reference Materials (CRMs) | Provides a known quantity of analyte with traceable purity for method validation, calibration, and establishing identification confidence [65]. | Used to spike blank matrices to assess recovery, LOD, and to confirm Level 1 identifications. |
| Quality Control Standard (QCS) | Monitors technical variation and batch effects across sample preparation and instrument runs [68]. | A tissue-mimicking QCS (e.g., propranolol in gelatin) spotted on every slide in an MSI batch to track performance. |
| QuEChERS Extraction Kits | Provides a quick, easy, cheap, effective, rugged, and safe sample preparation method for complex aqueous and solid matrices [69]. | Extraction of cocaine and other illicit drugs from surface water samples prior to GC-MS or LC-HRMS analysis. |
| Software: DO-MS | A data-driven platform for interactive visualization of LC-MS performance metrics; diagnoses specific problems in chromatography and ion sampling [67]. | Optimizing apex targeting and ion accumulation times to improve MS2 identification rates in ultrasensitive proteomics. |
| Database: NORMAN Suspect List Exchange | A collaborative repository of suspect lists for NTS, containing thousands of potential environmental contaminants [4]. | Used in suspect screening (P1) to prioritize features that match known environmental contaminants. |
Establishing rigorous criteria for sensitivity, specificity, and accuracy is fundamental to advancing non-target screening from an exploratory research tool to a technique capable of supporting environmental monitoring and regulatory decision-making. This requires a multi-faceted approach that integrates continuous data quality control, performance calibration, and structured confidence assessment throughout the analytical workflow. By adopting the protocols and strategies outlined in this article—such as using quality control standards, systematically evaluating matrix effects, and applying a confidence scale for identifications—researchers can generate more reliable, defensible, and comparable data. As the field moves forward, the community-wide adoption of such standardized performance assessments will be crucial for unlocking the full potential of HRMS-based NTS in protecting environmental and public health.
Within the framework of high-resolution mass spectrometry (HRMS) for non-target screening (NTS) of environmental pollutants, a singular analytical technique is often insufficient for confident compound identification and risk assessment. Orthogonal confirmation—the practice of using independent, complementary methods to verify findings—is paramount. This application note details integrated protocols for correlating data from HRMS-based NTS with Effect-Based Methods (EBM) and Nuclear Magnetic Resonance (NMR) spectroscopy. This multi-pronged strategy aims not only to identify unknown contaminants but also to link their chemical presence to biological activity and elucidate their definitive structures, thereby providing a robust foundation for environmental monitoring and chemical regulatory decisions [1].
Experimental Protocols & Workflows
Workflow for Orthogonal Confirmation
The following diagram illustrates the overarching strategy for integrating NTS, EBM, and NMR.
Protocol 1: HRMS-Based Non-Target Screening and Prioritization
This protocol covers the initial steps for detecting and prioritizing unknown chemical features in complex environmental samples [10] [1].
- 1. Sample Preparation: Extract water, soil, or biota samples using solid-phase extraction (SPE) or accelerated solvent extraction (ASE). Use internal standards to correct for matrix effects and instrument variability.
- 2. LC-HRMS Analysis:
- Chromatography: Utilize reversed-phase C18 columns with water and methanol (or acetonitrile) gradients for compound separation.
- Mass Spectrometry: Acquire data in full-scan mode (e.g., 100-1500 m/z) using an electrospray ionization (ESI) source, operating in both positive and negative ionization modes. Ensure a mass resolution of >50,000 to distinguish isobaric compounds.
- 3. Data Pre-processing: Process raw HRMS data using software (e.g., XCMS, MS-DIAL) for peak picking, alignment, and feature finding (retention time, m/z, intensity). The vast number of generated features necessitates stringent data quality filtering to reduce noise and false positives [10].
- 4. Feature Prioritization: Apply a tiered prioritization strategy to focus identification efforts [10]:
- Suspect Screening: Screen features against custom databases of expected contaminants (e.g., pharmaceuticals, pesticides, industrial chemicals).
- Chemistry-Driven Prioritization: Prioritize features indicative of hazardous compound classes, such as halogenated substances (via distinct Cl/Br isotope patterns) or potential transformation products.
- Temporal/Spatial Trends: Identify features with significant intensity changes across sampling locations (e.g., upstream vs. downstream of effluent) or over time.
Protocol 2: Correlation with Effect-Based Methods
This protocol links chemical features to biological effects, bridging the gap between chemical presence and potential hazard [10] [1].
- 1. In Vitro Bioassays: Test the original sample extract in a battery of cell-based bioassays to assess specific toxicological endpoints. Common assays include:
- Cytotoxicity assays (general baseline toxicity)
- Genotoxicity assays (e.g., micronucleus test)
- Receptor-based assays (e.g., estrogenicity via ERα-CALUX, antiandrogenicity via AR-CALUX)
- 2. Effect-Directed Analysis (EDA): If the sample shows significant biological activity, initiate EDA.
- Fractionation: Separate the sample extract into multiple fractions using high-performance liquid chromatography (HPLC).
- Biotesting: Test each fraction in the relevant bioassay(s) to pinpoint the retention time window(s) responsible for the observed effect.
- 3. Virtual EDA (vEDA): As a complementary approach, use quantitative structure-activity relationship (QSAR) models to predict the potential toxicity of the prioritized suspect list from the NTS workflow [10]. This computational prioritization can guide targeted fractionation and testing.
- 4. Correlation: Overlay the bioassay activity profile of the HPLC fractions with the base peak chromatogram from HRMS analysis. The chemical features detected by HRMS within the active fraction(s) become high-priority candidates for identification.
Protocol 3: Structural Elucidation via NMR Spectroscopy
For the final confirmation of structure, especially for novel compounds, NMR is indispensable. This protocol is applied to the pure or highly enriched candidate compound isolated from the active fraction.
- 1. Sample Preparation: Isolate the candidate compound from the active fraction using semi-preparative or analytical HPLC. Pool multiple injections if necessary. Evaporate the solvent and re-dissolve the compound in a deuterated solvent (e.g., DMSO-d6, CD3OD).
- 2. 1D NMR Experiments:
- ¹H NMR: Provides information on the number, type, and environment of hydrogen atoms in the molecule.
- ¹³C NMR (often DEPT): Reveals the number and type of carbon atoms (CH3, CH2, CH, C).
- 3. 2D NMR Experiments: These experiments are critical for establishing atom connectivity and spatial relationships [71].
- COSY (Correlation Spectroscopy): Identifies protons that are coupled to each other through 2-3 bonds (homonuclear through-bond correlations).
- HSQC (Heteronuclear Single Quantum Coherence): Correlates directly bonded ¹H and ¹³C nuclei, essential for assigning the molecular skeleton.
- HMBC (Heteronuclear Multiple Bond Correlation): Detects long-range correlations between ¹H and ¹³C nuclei (typically 2-4 bonds apart), crucial for connecting structural fragments.
- Advanced Techniques: For larger molecules or complex cases, relaxation-optimized heteronuclear experiments (e.g., for ¹H-¹⁵N) can be employed to extend the size limit of NMR characterization [72].
- 4. Data Integration: Combine the structural constraints from all NMR experiments with the exact mass and fragmentation pattern from HRMS to propose a definitive molecular structure.
Data Presentation
Key Parameters for HRMS and NMR Analysis
Table 1: Summary of Key Analytical Parameters for Orthogonal Confirmation.
| Technique | Key Parameter | Typical Value/Type | Function/Purpose |
|---|---|---|---|
| LC-HRMS | Mass Resolution | > 50,000 FWHM | Distinguish isobaric compounds with small mass differences. |
| Ionization Mode | ESI (+/-), APCI | Efficiently ionize a broad range of chemical classes. | |
| Mass Accuracy | < 2 ppm | Generate confident molecular formula assignments. | |
| MS/MS Fragmentation | Data-Dependent Acquisition | Provide structural information for identification. | |
| NMR | Magnetic Field Strength | 400 - 800 MHz | Increase signal resolution and sensitivity. |
| 1D Experiments | ¹H, ¹³C | Determine basic carbon and hydrogen framework. | |
| 2D Experiments [71] | COSY, HSQC, HMBC | Establish through-bond connectivity and atom correlations. | |
| Inverse Detection [72] | ¹H-¹⁵N HSQC | Sensitive detection of heteronuclei like nitrogen in large molecules. |
The Scientist's Toolkit: Essential Research Reagents & Materials
Table 2: Key Research Reagent Solutions for Orthogonal Confirmation Workflows.
| Item | Function/Application |
|---|---|
| Deuterated Solvents (e.g., DMSO-d6, CD3OD) | NMR sample preparation; provides a locking signal for the spectrometer and avoids dominant solvent signals in the ¹H spectrum. |
| Internal Standards (Isotope-Labeled) | Quality control in HRMS; correct for matrix effects and instrument drift during quantitative and semi-quantitative analysis. |
| SPE Cartridges (e.g., Oasis HLB, C18) | Environmental sample preparation; concentrate and clean up target analytes from complex aqueous matrices like wastewater or surface water. |
| Bioassay Kits (e.g., CALUX panels) | Effect-Based Methods; provide standardized, sensitive in vitro systems for detecting specific receptor-mediated toxicities (e.g., endocrine disruption). |
| NMR Reference Compounds (e.g., TMS) | NMR spectroscopy; provides a reference peak for chemical shift calibration (0 ppm) in the ¹H and ¹³C spectra. |
The synergistic application of HRMS-based NTS, Effect-Based Methods, and NMR spectroscopy provides a powerful framework for advancing environmental analytical science. This orthogonal confirmation strategy moves beyond simple compound detection to deliver a comprehensive understanding of environmental pollutants, linking their chemical identity to biological activity and definitive molecular structure. This integrated approach is critical for supporting robust environmental risk assessment, prioritizing chemicals of emerging concern, and informing evidence-based regulatory decision-making [1].
High-Resolution Mass Spectrometry (HRMS) has emerged as a powerful analytical technique that provides unparalleled accuracy in measuring the mass-to-charge ratio (m/z) of ions. This capability is fundamentally transforming how scientists approach the analysis of complex molecules, particularly in environmental science and drug development. Unlike traditional mass spectrometry methods like triple quadrupole mass spectrometers operating in tandem mass spectrometry (MS/MS) mode, HRMS instruments can distinguish compounds with the same nominal mass by precisely measuring their specific mass defects—the difference between the exact mass and the nominal mass of a compound [23] [15].
This technical note provides a comprehensive comparative analysis of HRMS versus traditional MS methodologies, focusing specifically on their respective selectivity and sensitivity characteristics when dealing with complex molecular structures. The content is framed within the context of non-target screening of environmental pollutants, a field where comprehensive detection of unknown chemicals is paramount. We present structured experimental data, detailed protocols, and analytical workflows to guide researchers and drug development professionals in selecting and implementing appropriate mass spectrometric strategies for their specific application needs.
Fundamental Technical Differences
The core distinction between HRMS and traditional MS lies in their fundamental operating principles and the type of information they provide. Traditional tandem mass spectrometry (MS/MS), typically performed on triple quadrupole instruments, achieves selectivity through compound-specific fragmentation and monitoring of precursor-to-product ion transitions [73]. This approach requires prior knowledge of the target analytes to establish optimal detection parameters.
In contrast, HRMS instruments such as Time-of-Flight (TOF) and Orbitrap analyzers provide high analytical specificity through accurate mass measurement with resolution typically exceeding 25,000 full width at half maximum (FWHM) [23] [15]. High resolution allows differentiation between isobaric compounds—those with the same nominal mass but different exact elemental compositions—based on minute mass differences resulting from nuclear binding energy variations between elemental isotopes [23].
The mass accuracy of HRMS instruments is typically specified in parts per million (ppm) and calculated as:
ppm = 1.0 × 10^6 × (measured mass - theoretical mass)/theoretical mass [23]
This level of mass precision enables the determination of elemental compositions, providing a powerful identification tool for unknown compounds in non-targeted screening applications [15].
Comparative Performance Data
Selectivity Comparison
The superior selectivity of HRMS has been demonstrated in multiple comparative studies. One investigation directly compared liquid chromatography coupled to HRMS versus LC-MS/MS using blank matrix extracts from fish, pork kidney, pork liver, and honey [74]. The results demonstrated that HRMS provides superior selectivity compared to MS/MS when data is recorded with a resolution of 50,000 FWHM.
Table 1: Selectivity Comparison Between HRMS and Traditional MS/MS
| Parameter | LC-HRMS | LC-MS/MS |
|---|---|---|
| Resolution | 50,000 FWHM | Unit resolution |
| Mass Accuracy | <5 ppm | ~0.1 Da |
| Selectivity Mechanism | Accurate mass measurement | Fragmentation patterns |
| False Positive Rate | Lower | Higher (documented cases) |
| Comprehensiveness | Full-scan of all ionizable compounds | Targeted analysis only |
A particularly telling example from the study involved the analysis of honey matrix, where an endogenous compound produced a false positive finding for a banned nitroimidazole drug when using MS/MS methodology. The interference showed identical retention time and perfect MRM ratio match with the external standard. However, HRMS measurement clearly resolved the interfering matrix compound and unmasked the false positive MS/MS finding [74].
Sensitivity Comparison
Sensitivity comparisons between the two techniques show context-dependent results. For targeted analysis of known compounds, MS/MS has traditionally demonstrated superior sensitivity, particularly for low-abundance analytes in complex matrices [73]. However, technological advancements in HRMS instrumentation have significantly closed this sensitivity gap.
Modern HRMS instruments now achieve comparable sensitivity to MS/MS systems, with limits of detection in the low nanomolar range for many applications [75] [76]. In drug metabolism and pharmacokinetics (DMPK) studies, HRMS has demonstrated sufficient sensitivity for quantitative analysis while simultaneously providing comprehensive metabolite detection capabilities [75].
Table 2: Sensitivity Comparison in Various Applications
| Application Area | HRMS Performance | Traditional MS/MS Performance |
|---|---|---|
| Environmental Screening | Broad-spectrum sensitivity at ng/L levels | Excellent for targeted compounds at ng/L levels |
| Peptide Quantitation | Low nanomolar range, suitable for permeability assays [75] | Slightly better limits of quantitation in plasma |
| Drug Stability Testing | Sufficient for monitoring degradation products | Requires method redevelopment for new degradants |
| Oligonucleotide Analysis | Able to detect low-abundance impurities without full chromatographic resolution [77] | Challenging due to unfavorable fragmentation |
The slightly lower limits of quantitation sometimes observed with MS/MS in targeted applications must be balanced against the comprehensive data acquisition capability of HRMS, which enables retrospective analysis without reinjection [76].
Experimental Protocols
Non-Target Screening of Environmental Water Samples
Objective: To identify and characterize emerging contaminants and transformation products in environmental water matrices using LC-HRMS.
Materials and Reagents:
- Solid Phase Extraction (SPE) cartridges: Oasis HLB (60 mg, 3 mL) or equivalent
- HPLC-grade solvents: Methanol, acetonitrile, acetone
- Formic acid (MS-grade)
- Ammonium formate or ammonium acetate (MS-grade)
- Internal standards: Stable isotope-labeled compounds (when available)
- Ultrapure water (18.2 MΩ·cm)
Instrumentation:
- Liquid chromatograph with binary pump and temperature-controlled autosampler
- High-resolution mass spectrometer (Q-TOF or Orbitrap) with electrospray ionization source
- Analytical column: C18 column (100 × 2.1 mm, 1.7-1.9 μm particle size)
Sample Preparation:
- Collect water samples in pre-cleaned glass containers
- Filter through 0.7 μm glass fiber filters to remove particulate matter
- Acidify to pH 3 with formic acid if analyzing acidic compounds
- Perform solid-phase extraction using HLB cartridges conditioned with 6 mL methanol followed by 6 mL ultrapure water
- Load samples at flow rate of 5-10 mL/min
- Dry cartridges under vacuum for 20-30 minutes
- Elute with 6 mL methanol followed by 6 mL acetone
- Concentrate eluent to near dryness under gentle nitrogen stream at 40°C
- Reconstitute in 100 μL initial mobile phase composition
LC-HRMS Analysis:
- Chromatographic separation:
- Mobile phase A: Water with 0.1% formic acid
- Mobile phase B: Methanol with 0.1% formic acid
- Gradient: 5% B to 100% B over 30 minutes, hold 5 minutes
- Flow rate: 0.3 mL/min
- Column temperature: 40°C
- Injection volume: 10 μL
- Mass spectrometric detection:
- Polarity switching: Positive and negative ESI modes
- Resolution: >50,000 FWHM
- Mass range: m/z 100-1500
- Source temperature: 300°C
- Sheath gas flow: 40 arb units
- Auxiliary gas flow: 10 arb units
- Spray voltage: 3.5 kV (positive), 3.0 kV (negative)
- Data acquisition: Full scan with data-dependent MS/MS (top N)
Data Processing:
- Perform peak picking with open-source software (MZmine 2) or vendor software
- Apply blank subtraction to remove background contamination
- Screen against target, suspect, and unknown compound lists
- Use in-silico fragmentation tools for structure elucidation
- Apply prioritization strategies (intensity, frequency, trend, toxicity prediction)
Quantitative Analysis of Peptide Therapeutics
Objective: To quantify peptide-based therapeutics and their metabolites in biological matrices using HRMS.
Materials and Reagents:
- Stabilization additives: Isopropyl alcohol (IPA) for esterification prevention
- Protein precipitation solvents: Acetonitrile with 0.1% formic acid
- Digestion enzymes: Trypsin (for protein cleavage)
- Internal standards: Stable isotope-labeled peptide analogues
Instrumentation:
- UHPLC system with temperature-controlled autosampler
- Hybrid Quadrupole-Orbitrap mass spectrometer (e.g., Q-Exactive)
- Analytical column: C8 or C18 column (50 × 2.1 mm, 1.7 μm)
Sample Preparation:
- Add stabilization additives immediately after sample collection
- Perform protein precipitation with cold acetonitrile (1:3 sample:acetonitrile ratio)
- Vortex for 30 seconds and centrifuge at 15,000 × g for 10 minutes
- Transfer supernatant to new tube and evaporate under nitrogen at 40°C
- Reconstitute in mobile phase A
LC-HRMS Analysis:
- Chromatographic separation:
- Mobile phase A: Water with 0.1% formic acid
- Mobile phase B: Acetonitrile with 0.1% formic acid
- Gradient: Optimized for peptide retention and separation
- Column temperature: 50°C
- Mass spectrometric detection:
- Resolution: 35,000-70,000 FWHM
- Scan mode: Full scan (m/z 300-2000) with parallel reaction monitoring (PRM)
- AGC target: 3e6 ions for full scan, 2e5 ions for MS/MS
- Maximum injection time: 100 ms
- Isolation window: 2-4 m/z for PRM
- Collision energies: Optimized for specific peptide fragmentation
Data Analysis:
- Extract ion chromatograms with 5 ppm mass tolerance
- Use isotope pattern matching for confirmation
- Quantify using internal standard method
- Perform fragmentation pattern analysis for metabolite identification
Visualized Workflows
Non-Target Screening Workflow for Environmental Pollutants
Non-Target Screening Workflow for Environmental Pollutants Using HRMS
Technology Selection Framework
Decision Framework for HRMS versus Traditional MS Selection
Research Reagent Solutions
Table 3: Essential Research Reagents for HRMS Analysis
| Reagent/Material | Function/Purpose | Application Notes |
|---|---|---|
| HFIP (Hexafluoroisopropanol) | Ion-pairing reagent for oligonucleotide separation | Improves ESI efficiency and chromatographic resolution when paired with amines [77] |
| Pentylamine | Moderate hydrophobicity ion-pairing reagent | Minimizes adduct formation in RNA therapeutic analysis; more environmentally friendly than longer-chain alternatives [77] |
| Stable Isotope-Labeled Standards | Internal standards for quantification | Correct for matrix effects and recovery variations; essential for accurate quantification |
| Isopropyl Alcohol (IPA) | Stabilization additive | Prevents ex-vivo esterification of compounds during sample preparation [76] |
| Formic Acid | Mobile phase additive | Promotes protonation in positive ESI mode; improves chromatographic peak shape |
| Ammonium Formate/ Acetate | Mobile phase buffer | Provides consistent pH for reproducible retention times |
| Oasis HLB SPE Cartridges | Sample preparation | Broad-spectrum extraction of diverse chemical classes from water matrices |
| Enzymes (Trypsin, Protease) | Protein digestion | Cleaves proteins into peptides for analysis of protein-based therapeutics |
Application-Specific Considerations
Environmental Pollutant Monitoring
HRMS has become indispensable for comprehensive monitoring of chemical pollution in water resources, extending far beyond the limited lists of priority substances defined in environmental regulations [3]. The non-target screening (NTS) capabilities of HRMS allow for:
- Detection of newly emerging compounds and transformation products even before their environmental impact is fully understood [3]
- Retrospective analysis of stored data as new contaminants are identified, without requiring reanalysis of samples [3]
- Source identification through contamination fingerprints characteristic of specific domestic, industrial, or agricultural activities [3]
- Trend monitoring to identify signals with changing patterns over space or time, indicating emerging chemical hazards [3]
The implementation of HRMS in regulatory monitoring programs represents a paradigm shift from targeted component-based monitoring to comprehensive mixture assessment, enabling more effective protection of water resources [3].
Pharmaceutical Applications
In drug development, HRMS has proven particularly valuable for studying complex molecules that challenge traditional MS/MS approaches:
- Peptide-based therapeutics often exhibit unfavorable fragmentation patterns that hamper identification of sensitive and selective MRM transitions [75]
- Cyclic peptides with unnatural amino acids and non-peptidic moieties may undergo biotransformations typical for small molecules, requiring comprehensive detection capabilities [75]
- Peptide-drug conjugates represent complex structures where HRMS can simultaneously monitor proteolytic degradation, linker cleavage, and payload metabolism [75]
- Stability testing benefits from HRMS through identification of degradation pathways and optimization of stabilization strategies [76]
The qualitative and quantitative capabilities of HRMS make it particularly suitable for supporting both discovery-phase and regulated bioanalytical studies in pharmaceutical development [76].
The comparative analysis of HRMS versus traditional MS reveals a complex landscape where each technology offers distinct advantages. Traditional MS/MS remains a powerful tool for targeted quantitative analysis of known compounds, particularly when ultra-trace sensitivity is required. However, HRMS provides superior capabilities for non-targeted screening, unknown identification, and comprehensive sample characterization.
The decision between these technologies should be guided by the specific analytical requirements: HRMS is clearly superior for discovery-phase research, method development, and situations requiring comprehensive compound detection, while traditional MS/MS may still be preferred for routine monitoring of established target compounds where maximum sensitivity is critical.
As HRMS technology continues to evolve, with improvements in sensitivity, speed, and data processing capabilities, its adoption across environmental monitoring, pharmaceutical development, and clinical applications is expected to grow. The ability to perform retrospective data analysis and the comprehensive nature of HRMS data acquisition make it an increasingly valuable platform for addressing the complex analytical challenges of modern chemical analysis.
Within environmental pollutant research using high-resolution mass spectrometry (HRMS) for non-target screening (NTS), the characterization of very polar and hydrophilic compounds remains a significant analytical challenge [1] [78]. Hydrophilic Interaction Liquid Chromatography with Fluorescence Detection (HILIC-FLD) represents a well-established chromatographic technique for the separation and quantification of such polar analytes. This application note benchmarks conventional HILIC-FLD against emerging HRMS techniques, framing the comparison within the context of developing robust analytical methods for identifying unknown environmental contaminants. While reversed-phase liquid chromatography (RPLC) often forms the basis of LC-MS analyses, its utility is limited for very polar compounds that show poor retention [79] [78]. HILIC addresses this limitation by providing an orthogonal separation mechanism, retaining polar and hydrophilic compounds that are typically unretained in RPLC mode [80]. The technique employs a hydrophilic stationary phase and a mobile phase with a high organic solvent content, which not only improves separation but also enhances electrospray ionization (ESI) efficiency, leading to increased MS sensitivity [78]. This document provides a detailed comparison of these techniques and standardized protocols to support researchers in environmental and pharmaceutical analysis.
Comparative Performance Data: HILIC-FLD vs. HRMS Methods
The quantitative performance of HILIC-FLD for glycan analysis has been systematically compared with advanced HRMS methods in recent studies. Table 1 summarizes key findings from a comparative study analyzing monoclonal antibody glycosylation, highlighting the relative strengths and limitations of each technique [81].
Table 1: Comparison of Analytical Techniques for N-Glycan Characterization
| Analytical Technique | Key Advantages | Key Limitations | Major Glycoforms Agreement | Sample Preparation Complexity |
|---|---|---|---|---|
| HILIC-FLD | High sensitivity for fluorescently labeled glycans; Quantitative reliability; Lower instrument cost [81] [82]. | Limited structural detail; Cannot characterize co-eluting species without standards [81]. | Yes (for major species) [81] | High (time-consuming, multi-step labeling) [83] [81] |
| Released Glycan HRMS | Mass confirmation; High specificity; Compatible with modern fast labeling (e.g., RapiFluor-MS) [81] [82]. | Requires specific labeling for optimal sensitivity; Can be affected by matrix effects [83]. | Yes [81] | Medium (simplified with newer kits) [83] |
| Middle-up/Intact HRMS | Minimal sample prep; Site-specific information; Can monitor multiple attributes simultaneously [83] [81]. | High instrument cost; Complex data analysis; May require deconvolution software [81]. | Yes [81] | Low (rapid enzymatic digestion) [83] |
| Glycopeptide-based MAM | Site-specific glycosylation data; Can characterize other PTMs simultaneously [81]. | Complex data analysis; Requires proteolytic digestion [81]. | Yes [81] | Medium (digestion and separation required) [81] |
A critical finding from comparative studies is that while all these methods demonstrate strong agreement in identifying and quantifying major glycoforms, they each offer distinct advantages [81]. HILIC-FLD remains a robust, cost-effective solution for quantitative profiling, while HRMS methods provide superior structural characterization and can be integrated into multi-attribute monitoring (MAM) workflows [83] [81].
Experimental Protocols
Standard HILIC-FLD Protocol for Released N-Glycan Analysis
This protocol details the conventional method for profiling N-glycans released from glycoproteins, adapted from published methodologies [81] [82].
Materials & Reagents:
- Monoclonal antibody or other glycoprotein sample
- PNGase F (e.g., New England BioLabs, P0704S) [83] [81]
- 2-Aminobenzamide (2-AB) labeling kit (e.g., ProZyme Signal 2-AB-plus Labeling Kit) [81]
- HILIC-SPE µElution plate (e.g., Waters GlycoWorks HILIC µElution plate) [83]
- LC-MS grade water, acetonitrile (ACN)
- Ammonium bicarbonate, formic acid
- 10-kDa molecular weight cut-off (MWCO) filters (e.g., PALL Corporation, OD010C33) [81]
Procedure:
- Denaturation & Deglycosylation:
- Buffer-exchange 50 µg of glycoprotein into digestion buffer using a 10-kDa MWCO filter.
- Denature the protein by incubating with 1% Rapigest surfactant and 5 mM DTT for 30 min at 60°C [83].
- Alkylate with 10 mM iodoacetamide (IAA) for 30 min in the dark at room temperature [83].
- Enzymatically release N-glycans by incubating with PNGase F (2-3 µL, ~500,000 U/mL) for 18 hours at 37°C [83] [81].
Glycan Purification & Labeling:
- Separate released glycans from the protein using a 10-kDa MWCO filter [81].
- Purify glycans using a HILIC-SPE µElution plate: condition with water, equilibrate with 90% ACN, load sample in high-ACN solvent, wash with 90% ACN, and elute with 1 mM ammonium citrate in 10% ACN [83].
- Dry the eluate completely using a centrifugal evaporator.
- Label purified glycans with 2-AB dye (dissolved in 30% acetic acid in DMSO) by incubating at 65°C for 3 hours in the dark [83].
- Remove excess dye via a second HILIC-SPE purification step [83]. Dry and store labeled glycans at -20°C prior to analysis.
HILIC-FLD Analysis:
- Column: Waters Acquity BEH Amide (2.1 × 150 mm, 1.7 µm, 130 Å) [81].
- Mobile Phase: A: 50 mM ammonium formate, pH 4.4 (aqueous); B: Acetonitrile [81].
- Gradient: 80% B to 50% B over 45-60 minutes [81].
- Temperature: 40-60°C column temperature.
- Detection: Fluorescence with λ~ex~ = 330 nm and λ~em~ = 420 nm [81].
- Injection Volume: 1-10 µL.
Data Analysis:
- Identify glycans by comparing retention times to 2-AB-labeled glucose unit (GU) standards.
- Quantify by calculating the relative peak area of each glycan as a percentage of the total integrated peak area [81].
Middle-Up HILIC-HRMS Protocol for Glycan Analysis
This streamlined protocol, performed at the protein subunit level, offers a complementary approach with minimal sample preparation and site-specific information [83].
Materials & Reagents:
- Therapeutic monoclonal antibody (e.g., Adalimumab, Rituximab) [83] [81]
- IdeS protease (FabRICATOR, Genovis AB) or Papain [83]
- Dithiothreitol (DTT)
- Wide-pore HILIC column (e.g., Accucore 150 Amide-HILIC, 300 Å) [83]
- LC-MS grade water, ACN, formic acid
Procedure:
- Enzymatic Digestion:
- Incubate 10-20 µg of mAb with IdeS protease (1-2 µL per µg of mAb) for 30 minutes at 37°C to generate Fc/2 and Fab subunits [83].
Reduction:
- Add DTT to a final concentration of 50 mM and incubate for 10-15 minutes at 37°C to reduce disulfide bonds and generate individual light chains and Fd fragments [83].
Middle-Up HILIC-HRMS Analysis:
- Column: Wide-pore (e.g., 300 Å) HILIC stationary phase (e.g., Accucore 150 Amide-HILIC) [83].
- Mobile Phase: A: 0.1% Formic acid in water; B: 0.1% Formic acid in ACN.
- Gradient: Optimized from 80-85% B to 50-60% B over 15-25 minutes.
- MS Parameters: ESI-positive mode; Resolution > 60,000; Mass range: 800-4000 m/z [83] [81].
Data Processing:
The Scientist's Toolkit: Essential Research Reagent Solutions
Successful implementation of glycan analysis workflows depends on key reagents and materials. Table 2 lists essential solutions for the experiments described in this note.
Table 2: Essential Research Reagents and Materials for Glycan Analysis
| Item Name | Supplier Examples | Function & Application Notes |
|---|---|---|
| PNGase F | New England BioLabs [83] [81] | Enzyme for enzymatic release of N-linked glycans from glycoproteins for released glycan analysis. |
| IdeS Protease (FabRICATOR) | Genovis AB [83] | Protease for specific digestion of mAbs to generate Fc/2 and Fab subunits for middle-up analysis. |
| 2-AB Labeling Kit | ProZyme (Signal 2-AB-plus) [81] | Provides dye and reagents for fluorescent labeling of released glycans for HILIC-FLD detection. |
| RapiFluor-MS Labeling Kit | Waters [83] | Enables rapid labeling of glycans (<30 min) with a fluorophore that also enhances MS sensitivity. |
| HILIC-SPE µElution Plate | Waters (GlycoWorks) [83] | 96-well plate for high-throughput purification and desalting of released glycans prior to analysis. |
| Wide-pore HILIC Column | Thermo Fisher (Accucore 150 Amide-HILIC, 300 Å) [83] [80] | Stationary phase for separating large biomolecules like antibody subunits (~25 kDa) in HILIC mode. |
| BEH Amide HILIC Column | Waters (Acquity BEH Amide) [81] | Standard fully porous HILIC column for separation of released, labeled glycans. |
Application in Environmental Non-Target Screening
The principles and techniques of glycan analysis have significant parallels in environmental NTS using HRMS. The challenge of analyzing polar compounds in complex biological matrices is directly analogous to identifying unknown polar environmental pollutants, where HILIC-HRMS offers a powerful solution [1] [78]. The high organic content of HILIC mobile phases promotes efficient desolvation and ionization in the ESI source, leading to a reported ten to twenty-fold improvement in MS sensitivity for very polar compounds compared to RPLC-MS methods [80] [78]. This enhanced sensitivity is crucial for detecting trace-level emerging contaminants in environmental samples.
Furthermore, the orthogonal separation mechanism of HILIC complements RPLC, effectively widening the analytical window in NTS. This is vital for constructing a comprehensive picture of the chemical universe in environmental samples [79] [1]. The digital archiving capability of HRMS data allows for retrospective analysis of HILIC data when new information about potential pollutants emerges, making the combination of HILIC and HRMS a future-proof strategy for environmental monitoring and chemical regulation [60] [1]. Collaborative trials and networks like the NORMAN network are already working towards harmonizing HILIC-HRMS data acquisition and evaluation for this purpose [1].
HILIC-FLD remains a benchmark technique for the quantitative analysis of polar compounds like glycans, valued for its robustness and reliability. However, within the broader context of HRMS for non-target screening, middle-up and intact HILIC-HRMS methods present compelling advantages, including minimal sample preparation, site-specific information, and high sensitivity. The choice between these techniques is not mutually exclusive; rather, they form a complementary analytical toolbox. For comprehensive characterization of complex samples—whether therapeutic proteins or environmental pollutants—the orthogonal use of HILIC-FLD for quantification and HILIC-HRMS for structural identification and non-targeted discovery represents a powerful strategy to ensure both product quality and environmental safety.
High-Resolution Mass Spectrometry (HRMS) has emerged as a transformative analytical technology for the non-targeted screening (NTS) of environmental pollutants, enabling the detection and identification of known and unknown chemical substances with exceptional accuracy. The working principle of HRMS is based on its ability to measure the exact molecular weight of compounds with exceptional precision, clearly distinguishing ions that are extremely close in mass, which provides researchers with greater confidence when analyzing complex chemical mixtures [84]. Unlike traditional targeted methods that monitor a predetermined set of analytes, HRMS-based NTS employs a data-independent acquisition approach that creates a "digital archive" of sample composition, allowing retrospective analysis as new environmental concerns emerge [1].
The regulatory acceptance of HRMS methodologies has grown significantly as the technology has evolved from a research tool to a reliable platform for chemical monitoring and decision-making. Regulatory bodies increasingly recognize that current monitoring approaches cover only a small subset of the thousands of chemicals used in modern society, creating a critical need for more comprehensive analytical techniques [1] [7]. This application note examines the evidentiary foundation supporting the regulatory acceptance of HRMS for non-target screening, with particular attention to methodologies relevant to environmental monitoring and chemical safety assessment.
Regulatory Frameworks and HRMS Integration
Evolution from Targeted to Non-Targeted Approaches
Traditional regulatory monitoring programs, such as the EU Water Framework Directive, have historically focused on a limited set of priority substances (currently 45), while research studies using HRMS routinely monitor hundreds of substances in individual environmental samples [1]. This disparity has driven regulatory interest in NTS approaches that can more comprehensively assess chemical mixtures in the environment. The Information Platform for Chemical Monitoring (IPCHEM) has emerged as the European Commission's reference access point for chemical occurrence data in Europe, representing a significant step toward harmonizing monitoring data across environmental, human biomonitoring, food and feed, and product safety domains [1].
The NORMAN network (Network of Reference Laboratories, Research Centres and Related Organisations for Monitoring of Emerging Environmental Substances) has played a pivotal role in advancing the regulatory acceptance of HRMS-based NTS through collaborative trials, method harmonization, and knowledge exchange [7]. Their guidance documents represent the current state of knowledge on performing high-quality NTS studies and have been instrumental in establishing confidence in these methodologies among regulatory bodies [7].
Key Regulatory Applications of HRMS Data
HRMS-based NTS supports multiple regulatory functions across chemical management frameworks:
- Water Framework Directive Implementation: NTS can foster the selection of chemicals to be added to the Watch List and support the identification of River Basin Specific Pollutants [1].
- REACH Regulation: Environmental monitoring data from NTS can be used in substance evaluation through a weight-of-evidence approach, particularly for assessing persistence and bioaccumulation [1].
- Chemical Prioritization: NTS serves as a first screening step in exposure assessment to trigger more targeted monitoring and testing strategies [1].
- Early Warning Systems: The International Commission for the Protection of the Rhine (ICPR) has utilized NTS since 2012, documenting significant spill events of previously undetected compounds that would not have been identified under conventional monitoring programs [1].
Analytical Methodologies and Workflow Protocols
HRMS Instrumentation and Fundamental Principles
The analytical power of HRMS for non-target screening derives from its fundamental operating principle, which comprises three essential steps: ionization, mass analysis, and detection [84]. The high resolution and mass accuracy of modern HRMS instruments enable the differentiation of compounds with minimal mass differences, which is crucial for confident identification in complex environmental matrices.
Table 1: HRMS Instrumentation Components and Characteristics
| Component | Techniques | Applications in Environmental NTS |
|---|---|---|
| Ionization | Electrospray Ionization (ESI), Matrix-Assisted Laser Desorption Ionization (MALDI) | ESI is ideal for polar compounds, pharmaceuticals, pesticides; MALDI for larger molecules [84]. |
| Mass Analysis | Orbitrap, Time-of-Flight (TOF), Fourier Transform Ion Cyclotron Resonance (FT-ICR) | Orbitrap provides high resolution for complex mixtures; TOF offers rapid screening; FT-ICR delivers ultra-high resolution [84]. |
| Detection | High-precision detectors | Records ion intensity and exact molecular mass with high sensitivity [84]. |
Comprehensive NTS Workflow for Regulatory Analysis
The following workflow diagram illustrates the integrated process for HRMS-based non-target screening in regulatory environmental monitoring:
Sample Preparation Protocol: For liquid environmental samples (water, wastewater), minimal preparation is recommended to maintain the broadest chemical domain coverage. Direct injection is suitable for higher-concentration samples, while generic solid-phase extraction (SPE) with mixed-mode sorbents is preferred for trace analysis [7]. For solid samples (sediment, soil, biota), extraction with organic solvents such as methanol or acetonitrile is standard [7]. Quality control measures must include procedural blanks, replicated samples, and samples spiked with internal standards to monitor analytical performance [7] [18].
Chromatographic Separation: Generic chromatographic methods are employed to maximize the range of detectable compounds. For reversed-phase liquid chromatography, this typically involves a broad gradient (e.g., 5-100% organic solvent over 20-30 minutes) using C18 columns [7]. The retention time (RT) serves as a critical parameter for compound identification, with recent advances in RT prediction models and projection methods between different chromatographic systems significantly improving identification confidence [85].
HRMS Analysis: Data acquisition should include full-scan MS data with data-dependent or data-independent MS/MS fragmentation to enable compound identification. Both positive and negative electrospray ionization modes should be employed to broaden compound coverage, as different compounds ionize better in one mode versus the other [86]. Mass resolution should be sufficient to separate isobaric compounds, typically requiring a resolving power of ≥25,000-30,000 [7].
Prioritization Strategies for Regulatory Decision-Making
Seven-Tiered Prioritization Framework
The vast number of features detected in NTS analyses (often thousands per sample) creates a significant bottleneck in identification. A structured prioritization approach is essential for efficient resource allocation in regulatory contexts. Recent research has established seven complementary prioritization strategies that can be integrated into a comprehensive workflow [4] [10]:
Table 2: Prioritization Strategies for NTS in Regulatory Environmental Monitoring
| Strategy | Methodology | Regulatory Application |
|---|---|---|
| Target & Suspect Screening | Matching against predefined databases (NORMAN, PubChemLite, CompTox) | Rapid identification of known contaminants; leverages existing regulatory knowledge [4]. |
| Data Quality Filtering | Blank subtraction, replicate consistency, peak shape evaluation | Ensures data reliability; reduces false positives for regulatory action [4]. |
| Chemistry-Driven Prioritization | Mass defect filtering, homologue series, halogenation patterns | Targets specific compound classes (e.g., PFAS) with known regulatory concern [4]. |
| Process-Driven Prioritization | Spatial/temporal comparison (e.g., upstream vs. downstream) | Identifies persistent or newly formed compounds; links to emission sources [4]. |
| Effect-Directed Prioritization | Bioassay-directed fractionation, virtual EDA | Directly links chemical features to biological effects; prioritizes toxicologically relevant compounds [4]. |
| Prediction-Based Prioritization | QSPR models, MS2Quant, MS2Tox | Estimates risk quotients (PEC/PNEC) without reference standards [4]. |
| Pixel/Tile-Based Analysis | Chrom. image analysis before peak detection | Handles complex datasets (GC×GC, LC×LC); useful for large-scale monitoring [4]. |
Integrated Prioritization Workflow
The following diagram illustrates how these prioritization strategies can be integrated into a cohesive workflow for regulatory NTS applications:
This integrated approach enables a stepwise reduction from thousands of detected features to a manageable number of high-priority compounds worthy of further investigation and potential regulatory action. For example, an initial suspect screening might flag 300 potential compounds, which data quality filtering and chemistry-driven prioritization might reduce to 100 features. Process-driven analysis could then identify 20 features linked to poor removal in wastewater treatment, with effect-directed and prediction-based methods finally prioritizing 5 high-risk compounds for definitive identification and regulatory consideration [4].
Quantitative Assessment Without Reference Standards
Semi-Quantification Methodologies for Regulatory Applications
A significant challenge in regulatory NTS is obtaining quantitative data without authentic analytical standards for all detected compounds. Recent advancements in semi-quantification strategies have addressed this limitation, providing concentration estimates with sufficient accuracy for initial risk assessment [87] [86].
The foundation of these approaches lies in predicting ionization efficiency (IE) in electrospray ionization, which varies significantly between compounds and represents the primary source of quantitative uncertainty. Machine learning models, particularly random forest regression, have demonstrated promising predictive capability for IE with a mean error of 2.0-2.2 times for positive and negative ionization modes, respectively [87]. This prediction accuracy translates to an average quantification error of approximately 5.4 times, which is generally compatible with the accuracy of toxicology predictions used in preliminary risk assessment [87].
Table 3: Semi-Quantification Strategies for NTS in Regulatory Contexts
| Method | Principle | Accuracy & Limitations |
|---|---|---|
| Structural Analogy | Uses response factors of structurally similar compounds with available standards | Limited by availability of suitable analogs; variable accuracy depending on structural similarity [86]. |
| Internal Standard Referencing | Applies response of closest-eluting internal standard | Requires comprehensive internal standard set; accuracy depends on chemical similarity to standards [86]. |
| Machine Learning Prediction | Predicts ionization efficiency from molecular structure or MS/MS fragments | Mean error 2.0-2.2x for IE prediction; 5.4x for concentration in validation studies [87]. |
| Transformation Product Quantification | Uses parent compound response factor for known transformation products | Applicable to specific compound classes; assumes similar ionization behavior [86]. |
Protocol for Semi-Quantitative NTS Analysis
For regulatory applications requiring semi-quantification, the following protocol is recommended:
- Sample Preparation Dilution Series: Analyze sample dilutions to ensure semi-quantification falls within the linear range of the calibration curve and to assess potential matrix effects [86].
- Dual Ionization Mode Analysis: Run samples in both positive and negative ESI modes to improve compound coverage and quantification confidence [86].
- Quality Control Measures: Include technical replicates, spiked samples, and quality control samples with known compounds to monitor analytical performance [86].
- Ionization Efficiency Modeling: Implement machine learning-based IE prediction using validated models, ensuring the chemical space of target compounds is adequately represented in the training data [87].
- Uncertainty Reporting: Clearly document the estimated accuracy and confidence intervals for all semi-quantitative results in regulatory submissions.
The Scientist's Toolkit: Essential Research Reagents and Materials
Table 4: Essential Research Reagent Solutions for HRMS-Based NTS
| Reagent/Material | Function | Application Notes |
|---|---|---|
| Mixed-Mode SPE Cartridges | Broad-spectrum enrichment of contaminants with diverse physicochemical properties | Combines reversed-phase, cation-exchange, and anion-exchange mechanisms; maximizes compound coverage [7]. |
| LC Gradient Grade Solvents | Mobile phase preparation for chromatographic separation | Low UV absorbance and high purity minimize background interference; essential for sensitive detection [7]. |
| Retention Time Index Calibrants | Standardization of retention times across laboratories and methods | Enables more accurate compound identification through RT prediction and projection between different chromatographic systems [85]. |
| Quality Control Standards Mix | Monitoring of analytical performance and instrument stability | Typically includes compounds spanning a range of physicochemical properties; used in system suitability testing [18]. |
| Internal Standard Cocktail | Correction for matrix effects and instrument variability | Should include isotopically labeled analogs of common contaminants; added before sample preparation [18]. |
| MS/MS Spectral Libraries | Compound identification through fragmentation pattern matching | NORMAN, NIST, and other public databases provide essential reference data for suspect and non-target screening [7]. |
The growing body of evidence supports the regulatory acceptance of HRMS-based non-target screening as a complementary approach to traditional targeted methods. The technology's ability to provide comprehensive chemical characterization, retrospective data analysis, and early identification of emerging contaminants addresses critical gaps in current chemical monitoring paradigms [1].
Successful implementation in regulatory contexts requires continued method harmonization, standardized reporting, and appropriate validation frameworks. The recent guidance from the NORMAN network provides a solid foundation for quality assurance in NTS studies [7], while advances in prioritization strategies [4] [10] and semi-quantification approaches [87] [86] are addressing previous limitations.
As regulatory agencies increasingly adopt HRMS methodologies, the scientific community must continue to build the evidentiary foundation through collaborative trials, proficiency testing, and method validation studies. The integration of NTS with effect-based methods and computational toxicology approaches represents a promising direction for comprehensive chemical safety assessment in regulatory contexts [1] [4].
Conclusion
High-Resolution Mass Spectrometry for non-target screening represents a transformative tool for environmental science, moving beyond the limitations of predefined target lists to provide a holistic view of chemical pollution. The integration of sophisticated HRMS instrumentation with advanced data processing workflows enables the detection and identification of previously unknown contaminants, transformation products, and emerging threats. While challenges in standardization, data management, and compound identification remain, the ongoing harmonization of protocols and the development of open-access data platforms are paving the way for its broader adoption in regulatory monitoring. The future of HRMS-NTS is inextricably linked to artificial intelligence for data interpretation and its synergistic use with effect-based methods, which will be crucial for prioritizing toxicologically relevant compounds. For biomedical and clinical research, these advancements offer a powerful paradigm for comprehensive exposure assessment, biomarker discovery, and ensuring the environmental safety of pharmaceuticals, ultimately supporting a more proactive and protective approach to public and ecosystem health.
References
- 1. High resolution mass spectrometry-based non - target can... screening [https://enveurope.springeropen.com/articles/10.1186/s12302-019-0225-x]
- 2. Emerging contaminants: A One Health perspective - PMC [https://pmc.ncbi.nlm.nih.gov/articles/PMC11096751/]
- 3. High-resolution mass spectrometry to complement monitoring and track emerging chemicals and pollution trends in European water resources | Environmental Sciences Europe | Full Text [https://enveurope.springeropen.com/articles/10.1186/s12302-019-0230-0]
- 4. HPLC 2025 Preview: Prioritization Strategies in Non - Target ... Screening [https://www.chromatographyonline.com/view/hplc-2025-preview-prioritization-strategies-in-non-target-screening-of-environmental-samples-by-chromatography-with-high-resolution-mass-spectrometry]
- 5. - Non and priority assessment of organic target in... screening pollutants [https://pubmed.ncbi.nlm.nih.gov/40829274/]
- 6. Comprehensive HRMS-screening for persistent, mobile, and toxic compounds in first flush urban stormwater | npj Clean Water [https://www.nature.com/articles/s41545-025-00463-5]
- 7. NORMAN guidance on suspect and non-target screening in environmental monitoring | Environmental Sciences Europe | Full Text [https://enveurope.springeropen.com/articles/10.1186/s12302-023-00779-4]
- 8. Data acquisition methods for non-targeted screening in environmental analysis - ScienceDirect [https://www.sciencedirect.com/science/article/abs/pii/S0165993623000535]
- 9. Non-targeted analysis (NTA) and suspect screening analysis (SSA): a review of examining the chemical exposome | Journal of Exposure Science & Environmental Epidemiology [https://www.nature.com/articles/s41370-023-00574-6]
- 10. Prioritization strategies for non - target in screening ... environmental [https://pubmed.ncbi.nlm.nih.gov/40203635/]
- 11. Orbitrap LC-MS | Thermo Fisher Scientific - US [https://www.thermofisher.com/us/en/home/industrial/mass-spectrometry/liquid-chromatography-mass-spectrometry-lc-ms/lc-ms-systems/orbitrap-lc-ms.html]
- 12. Nontarget analysis and comprehensive characterization of halogenated... [https://pubmed.ncbi.nlm.nih.gov/35934429/]
- 13. Thermo Fisher Launches Orbitrap Exploris EFOX for Environmental and Food Safety Testing | LCGC International [https://www.chromatographyonline.com/view/thermo-fisher-launches-orbitrap-exploris-efox-for-environmental-and-food-safety-testing]
- 14. Optimization of LC- Orbitrap - HRMS acquisition and MZmine 2 data... [https://link.springer.com/article/10.1007/s00216-016-9919-8]
- 15. sciencedirect.com/topics/chemistry/ high - resolution - mass ... [https://www.sciencedirect.com/topics/chemistry/high-resolution-mass-spectrometry-hrms]
- 16. - High | Resolution Analysis | Measurlabs Mass Spectrometry HRMS [https://measurlabs.com/methods/high-resolution-mass-spectrometry-hrms/]
- 17. Suspect, non-target and target screening of emerging pollutants using data independent acquisition: Assessment of a Mediterranean River basin - PubMed [https://pubmed.ncbi.nlm.nih.gov/31207525/]
- 18. Unraveling non - target variability for LC- screening ... HRMS data [https://link.springer.com/article/10.1007/s00216-025-05966-1]
- 19. Assessment for the data processing performance of non - target ... [https://pubmed.ncbi.nlm.nih.gov/37866614/]
- 20. The New Era of Biosimilar Development | Science Hub | Mabion [https://www.mabion.eu/science-hub/articles/the-new-era-of-biosimilar-development/]
- 21. Navigating the Global Regulatory Landscape for Biosimilars - NEWS... [https://www.biosidus.com.ar/en/navigating-the-global-regulatory-landscape/]
- 22. - Non Using LC- target : Fundamentals... | SpringerLink Screening HRMS [https://link.springer.com/chapter/10.1007/698_2024_1098]
- 23. Present and Future Applications of High ... Resolution Mass [https://pmc.ncbi.nlm.nih.gov/articles/PMC6941556/]
- 24. Non-target screening techniques for environmental monitoring | NORMAN [https://www.norman-network.net/?q=node/190]
- 25. and Mass Spectrometry for Chromatography Analysis Environmental [https://www.azom.com/article.aspx?ArticleID=12518]
- 26. Trends in sample and preparation methods for the... separation [https://link.springer.com/article/10.1007/s00216-020-02811-5]
- 27. Identification of plastic additives: Py/TD-GC-HRMS method development and application on food containers - ScienceDirect [https://www.sciencedirect.com/science/article/abs/pii/S0165237022003151]
- 28. Prioritizing Non-Target Screening in LC– HRMS ... Environmental [https://www.chromatographyonline.com/view/prioritizing-non-target-screening-in-lc-hrms-environmental-sample-analysis]
- 29. Advancing non-target analysis of emerging environmental contaminants with machine learning: Current status and future implications - PubMed [https://pubmed.ncbi.nlm.nih.gov/40139034/]
- 30. Mass spectrometry imaging for biosolids characterization to assess ecological or health risks before reuse | Nature Communications [https://www.nature.com/articles/s41467-023-40051-0]
- 31. : Chromatography Goes Automated 2025 Sample Preparation [https://www.sepscience.com/chromatography-2025-sample-preparation-goes-automated-11259]
- 32. Non-target screening with high-resolution mass spectrometry: critical review using a collaborative trial on water analysis - PubMed [https://pubmed.ncbi.nlm.nih.gov/25976391/]
- 33. Evaluation of Sample Preparation Methods for Non - Target ... Screening [https://pubmed.ncbi.nlm.nih.gov/34885646/]
- 34. Chemical Fingerprinting of Urban Runoff Using a Combined Iterative... [https://www.chromatographyonline.com/view/chemical-fingerprinting-of-urban-runoff-using-a-combined-iterative-dda-and-dia-workflow]
- 35. 2.1 Mass spectrometry data handling and (pre-)processing | The MetaRbolomics book [https://rformassspectrometry.github.io/metaRbolomics-book/0201-R_packages_for_metabolomics-Mass_spectrometry_data_handling_and_pre_processing.html]
- 36. 2: Modular framework for processing, visualizing, and... MZmine [https://bmcbioinformatics.biomedcentral.com/articles/10.1186/1471-2105-11-395]
- 37. mzmine documentation [https://mzmine.github.io/mzmine_documentation/index.html]
- 38. Annotating Nontargeted LC- HRMS /MS Data with Two Complementary... [https://pubmed.ncbi.nlm.nih.gov/30583579/]
- 39. Large-scale generation of in based spectral libraries to annotate... silico [https://link.springer.com/article/10.1007/s00216-025-06034-4]
- 40. A European proposal for quality control and quality assurance of... [https://enveurope.springeropen.com/articles/10.1186/s12302-020-00314-9]
- 41. Supporting non-target identification by adding hydrogen deuterium... [https://pmc.ncbi.nlm.nih.gov/articles/PMC6611743/]
- 42. Mass spectrometry for monitoring micropollutants in water - PubMed [https://pubmed.ncbi.nlm.nih.gov/17399974/]
- 43. - Non Using LC- target : Fundamentals, Key... | CoLab Screening HRMS [https://colab.ws/articles/10.1007%2F698_2024_1098]
- 44. Critical review on data processing algorithms in non - target ... [https://link.springer.com/article/10.1007/s00216-023-04776-7]
- 45. of trace pharmaceuticals and related... :: BioResources Analysis [https://bioresources.cnr.ncsu.edu/resources/analysis-of-trace-pharmaceuticals-and-related-compounds-in-municipal-wastewaters-by-preconcentration-chromatography-derivatization-and-separation-methods/]
- 46. Extraction and analysis of pharmaceutical in... - DORAS residues [https://doras.dcu.ie/16944/]
- 47. Environmental Applications of Mass Spectrometry for Emerging Contaminants [https://www.mdpi.com/1420-3049/30/2/364]
- 48. Mass spectrometry for environmental and wastewater monitoring | Spectroscopy Europe/World [https://www.spectroscopyeurope.com/article/mass-spectrometry-environmental-and-wastewater-monitoring]
- 49. Predicting environmental risks of pharmaceutical by... residues [https://pubmed.ncbi.nlm.nih.gov/38262535/]
- 50. Quantification Approaches in Non - Target LC/ESI/ HRMS : An... Analysis [https://pmc.ncbi.nlm.nih.gov/articles/PMC11483430/]
- 51. Non-target screening in water analysis: recent trends of data evaluation, quality assurance, and their future perspectives - PMC [https://pmc.ncbi.nlm.nih.gov/articles/PMC10951028/]
- 52. vs Repeatability Reproducibility [https://www.nikunjbhoraniya.com/2018/12/Repeatability-vs-Reproducibility.html]
- 53. , Repeatability , Replicability, Reusability... Reproducibility [https://arxiv.org/html/2312.11028v1]
- 54. 5.1 false and Positives - Sense & Sensibility & Science Negatives [https://sensibility.berkeley.edu/index.php/5.1_False_Positives_and_Negatives]
- 55. , accuracy, and Identification score confidence [https://dev.fingerprint.com/docs/identification-accuracy-and-confidence]
- 56. Chromatographic Co-elution | SpringerLink [https://link.springer.com/rwe/10.1007/978-3-642-11274-4_289]
- 57. Non-targeted screening of trace organic contaminants in surface waters by a multi-tool approach based on combinatorial analysis of tandem mass spectra and open access databases - ScienceDirect [https://www.sciencedirect.com/science/article/pii/S0039914021002149]
- 58. Separation of Chromatographic Co-Eluted Compounds by Clustering and by Functional Data Analysis - PMC [https://pmc.ncbi.nlm.nih.gov/articles/PMC8065729/]
- 59. Study on the Mass Spectrometry Fragmentation Patterns for Rapid Screening and Structure Identification of Ketamine Analogues in Illicit Powders - PMC [https://pmc.ncbi.nlm.nih.gov/articles/PMC10535375/]
- 60. Nontarget Screening with High in... Resolution Mass Spectrometry [https://pubmed.ncbi.nlm.nih.gov/28877430/]
- 61. Establish data infrastructure to compile and exchange environmental ... [https://link.springer.com/article/10.1186/s12302-019-0237-6]
- 62. (standards) - Wikipedia Harmonization [https://en.wikipedia.org/wiki/Harmonization_(standards)]
- 63. Progress, applications, and challenges in high-throughput effect-directed analysis for toxicity driver identification - is it time for HT-EDA? - PubMed [https://pubmed.ncbi.nlm.nih.gov/38992177/]
- 64. and Standardization of... | Nature Communications harmonization [https://www.nature.com/articles/s41467-020-18904-9?error=cookies_not_supported]
- 65. Approaches for assessing performance of high-resolution mass... [https://pmc.ncbi.nlm.nih.gov/articles/PMC9411239/]
- 66. Performance Metrics for Liquid Chromatography-Tandem Mass Spectrometry Systems in Proteomics Analyses - PMC [https://www.ncbi.nlm.nih.gov/pmc/articles/PMC2830836/]
- 67. DO-MS: Data-Driven Optimization of Mass Spectrometry Methods - PMC [https://pmc.ncbi.nlm.nih.gov/articles/PMC6737531/]
- 68. Quality Control Standards for Batch Effect Evaluation and Correction in Mass Spectrometry Imaging - PMC [https://pmc.ncbi.nlm.nih.gov/articles/PMC12120824/]
- 69. Development and Performance Evaluation of an Adapted QuEChERS-Gas Chromatography–Mass Spectrometry Method for the Analysis of Cocaine in Surface Water Samples [https://www.mdpi.com/2813-446X/3/4/23]
- 70. Quantitative Mass Spectrometry Imaging Protocols for Spatially Heterogeneous Samples - PMC [https://pmc.ncbi.nlm.nih.gov/articles/PMC12138873/]
- 71. Two-dimensional nuclear ... - Wikipedia magnetic resonance [https://en.wikipedia.org/wiki/Two-dimensional_nuclear_magnetic_resonance_spectroscopy]
- 72. Relaxation Optimized Heteronuclear Experiments for Extending the... [https://pubmed.ncbi.nlm.nih.gov/40101958/]
- 73. High Mass Resolution Versus MS/MS - ScienceDirect [https://www.sciencedirect.com/science/article/abs/pii/B9780444538109000018]
- 74. Comprehensive comparison of liquid chromatography selectivity as provided by two types of liquid chromatography detectors (high resolution mass spectrometry and tandem mass spectrometry): "where is the crossover point?" - PubMed [https://pubmed.ncbi.nlm.nih.gov/20630179/]
- 75. : an essential tool for DMPK studies | Bioanalysis Zone HRMS [https://www.bioanalysis-zone.com/dmpk-hrms-essential-tool_spotl_hrms_dmpk/]
- 76. HRMS in Drug Development: An Interview with Nicholas Ingram of IQVIA Laboratories | LCGC International [https://www.chromatographyonline.com/view/hrms-in-drug-development-an-interview-with-nicholas-ingram-of-iqvia-laboratories]
- 77. Analyzing Small RNA-based Therapeutics and Their Process Impurities... [https://www.chromatographyonline.com/view/analyzing-small-rna-based-therapeutics-and-their-process-impurities-using-fast-and-sensitive-lc-hrms]
- 78. HILIC–MS — High Resolution and Sensitivity for the Analysis of Very Polar Compounds | LCGC International [https://www.chromatographyonline.com/view/hilic-ms-high-resolution-and-sensitivity-analysis-very-polar-compounds]
- 79. Hydrophilic interaction chromatography – mass spectrometry for metabolomics and proteomics: state-of-the-art and current trends - ScienceDirect [https://www.sciencedirect.com/science/article/pii/S0026265X21010729]
- 80. Hydrophilic Interaction Liquid Chromatography HPLC and UHPLC Columns | Thermo Fisher Scientific - US [https://www.thermofisher.com/us/en/home/industrial/chromatography/liquid-chromatography-lc/hplc-uhplc-columns/hilic-hplc-columns.html]
- 81. Assessment of monoclonal antibody glycosylation: a comparative study... [https://link.springer.com/article/10.1007/s00216-024-05261-5]
- 82. Quantitative High-Throughput and High-Sensitivity Glycoprofile... [https://pubmed.ncbi.nlm.nih.gov/39460925/]
- 83. Quantitative N-Glycan Profiling of Therapeutic Monoclonal Antibodies Performed by Middle-Up Level HILIC-HRMS Analysis - PMC [https://pmc.ncbi.nlm.nih.gov/articles/PMC8617915/]
- 84. Working Principle of HRMS [https://resolvemass.ca/working-principle-of-hrms/]
- 85. Do experimental projection methods outcompete retention time prediction models in non-target screening? A case study on LC/HRMS interlaboratory comparison data - PMC [https://pmc.ncbi.nlm.nih.gov/articles/PMC12268317/]
- 86. Guide to Semi-Quantitative Non - Targeted Using... Screening [https://www.bohrium.com/paper-details/guide-to-semi-quantitative-non-targeted-screening-using-lc-esi-hrms/812311891970883585-3450]
- 87. Quantification for non-targeted LC/MS screening without standard substances | Scientific Reports [https://www.nature.com/articles/s41598-020-62573-z]